
Abstract
The application of an effective and reliable foot type classification method is very important for foot type judgment, injury risk assessment, and correction. Therefore, this paper mainly aims to propose a new foot type classification method for young people based on bitmap index (BI), compare it with the traditional footprint classification method, and put forward and analyze the factors affecting foot type classification. Thirty-one healthy volunteers were asked to perform two types tests in order to study the plantar pressure distribution with static and dynamic conditions, the first type is footprint test with full load of static, and the other type is plantar pressure distribution, which contains four different tests: no load, half load, and full load of static state, as well as dynamic plantar pressure distribution during process of walking. The Intraclass Correlation Coefficient results (ICC) were good reliable and reproducible for BI value with dynamic test (DT-BI value 0.738, 95% confidence interval [0.535, 0.848],
Introduction
It is generally believed that the function of the foot depends on the foot type, so effective foot type classification is very important for further research on foot function. In past decades, many scholars paid more attention on methods of foot type classification, such as the direct observation method of foot image, which relies on professional evaluation, but the operation is too subjective to have universal reference. 1 Foot type classification depends on the parameters such as hallux valgus index, 2 the midfoot dorsal angle, 3 and arch height index (AHI), 4 as well as navicular height (NNH), 5 which can be calculated by professional instruments and equipment, although the process above is very complicated, the results is more accuracy. 6 Traditional foot type classification such as footprint parameter 7 and arch index (AI) 8 need foot shape ink, not only the experimental operation is complex, but also the result is influenced by human factors. The improved plantar pressure detection method on AI is more convenient and faster, but needs the help of image recognition method. 9 In dynamic classification method of foot type, Heidelberg foot classification method is most popularly used, which requires higher professionalism and accuracy, and the construction of experimental platform is more complex. 10 It can be concluded from literatures above that the objectivity, accuracy, and convenience, as well as specialty of foot type classification are the main evaluation indicators. Such as Yamashita et al. 11 presented a smartphone-based 3D foot-scanning method to analyze the structure of the human foot.
The most commonly used foot type classification methods are footprint method and plantar pressure method, which need to collect, process, and store a large number of force sensor data. 12 Meanwhile, it is not easy to be widely used due to expensive data collection system. Based on existing equipment, many scholars presented a great number of researches. Chuckpaiwong et al. 13 according to the contact area of medial midfoot, and the maximum force of lateral forefoot, as well as the peak pressure to distinguish the normal foot and flatfoot. Bertani et al. 14 classified the normal foot and flexible flatfoot based on the ground reaction force with the help of three-dimensional dynamometer. Mei et al. 15 using sensor function shoes and one- dimensional convolutional neural network (1D-CNN) to classified foot type.
The existing foot type classification methods based on foot morphology could be put into one of the following categories: visual non-quantitative inspection, 16 anthropometric values, 17 and footprint parameters,18–23 as well as radiographic evaluation. 24 Furthermore, measurement using criteria of foot function can also be used for evaluation foot type. These typical foot type classifications are used to classify foot arch into three stages according to specific indications (normal, high, and low arch). In order to evaluate the possible influence of foot structure on musculoskeletal injury, people use different methods to classify the foot-type, most of which are based on static morphological features. 25 Although clinicians often measure their patients’ static lower limbs, 26 few studies have been published to support their ability to predict dynamic foot function. If the specific joint structure features based on static measurement are used for foot type classification, an association must be established between static foot structure and dynamic foot function. 27
Cavanagh and Rodgers 18 firstly proposed the define of AI, and used both in static and dynamic analysis. The arch index (AI) is defined as the ratio of Mid-Foot-Contact-Area (MFCA) relative to the Total-Foot-Contact-Area (TFCA) without toes, and it is associated with foot arch type because the higher MFCA indicates a lower arch for foot.5,6 A great number of researchers have shown that AI mainly affected by bone structure of foot, and the thickness of plantar soft tissue will affect the footprint area, but has no effect on the accuracy of AI. 28 Moreover, the accuracy of foot type classification by AI has been widely studied and verified, and it has the advantage of convenient calculation.
Therefore, this study intended to present a general methodology of human foot type classification for young adults, which is combined with the foot pressure characteristics under static and dynamic conditions. The effectiveness of this method is verified by comparative experiments. It only needs a testing instrument and a remote computer. The purpose of this study is to determine that foot feature classification of young adults based BI value will be reliable. Some of these plantar pressure parameters can be used as indicators for the auxiliary evaluation of foot type.
Method
This was a cross-sectional study, which was conducted in the biomechanical laboratory in accordance with the guidelines for research on reporting reliability and consistency (GRRAS).27,29 All methods were approved by the IRB and subjects completed informed consent forms.
Sample size
G*power 3.1.9.7 is used to estimate the planned sample size (α = 0.05, 1 − β = 0.80, Faul et al. 30 ). Considering the differences of research variables and the stability of results, if the interaction is to be observed in the experimental design of repeated measurement of two factors, all experiments calculate the planned sample size according to the standard of medium effect size (effect size f = 0.25, Faul et al.), and the result is 24 samples. In the correlation analysis, When the coefficient of determination ρ2 = 0.093, the total sample was calculated to be 62.
Sample characteristics
A body fat scale (Haier body fat scale, ZNC01-C8) was used to obtain the BMI (Body Mass Index) value of the subjects, and a plantar pressure measuring plate (Jasenco, JSP-C5, France) was used to obtain the plantar pressure, and adjust the center of the index finger and heel (Figure 2(a)).
Therefore, 31 asymptomatic young adults (62 samples) were recruited aged 22–27 years (17 males, 14 females, age 24.450 ± 1.082 years, height 169.580 ± 7.903 cm, weight 63.594 ± 14.245 kg, BMI 23.003 ± 6.904 kg/m2, mean ± SD) from university in this study. The inclusion criteria require young adults to stand on one leg for at least 5 s. All subjects had no neuromuscular diseases in the first 6 months before participating in the study, and individuals with lower limb injury, symptoms, surgery, or onset of osteoarthritis in the first half of the year were not included. People who had participated in any moderate or intense physical activity before the test, such as running, jogging, dancing, and other physical activities, were also excluded.
Instruments and procedures
In order to verify the effectiveness of a new method for foot-type classification, and the foot print and plantar pressure experiment were carried out. The footprint method is one of the most classical foot type classification methods. Compared with other foot type classification methods, footprint method has the advantages of simple operation, low cost, and long time-consuming.
(1) Footprint. Figure 1 shows the specific acquisition process of AI. Before the test, the non-toxic and harmless dye was evenly applied to the sole of the feet of the subjects, as shown in Figure 1(f). Secondly, the subjects were standing on 80 × 50 cm clean tipping paper to obtain the footprint, and scanned the footprint by the printer, as shown in Figure 1(a).

Image recognition technology: (a) footprint initial diagram; (b) convert original drawing to binary diagram; (c) the foot axis is defined as the connected line from the middle point of the heel to the middle point of the second metatarsal, and to rotate the foot axis vertically in binary diagram; (d) delete the toe part and extract the plantar contour, and obtained the TFCA without toes; (e) extracted the MFCA and calculated the ratio of MFCA relative to the TFCA without toes; (f) the scene of footprint method; (g) the foot arch index.
Finally, the image recognition results were performed using MATLAB R2016a (Mathworks, USA), and the foot arch index is calculated (Figure 1(g)). The calculation process of AI is defined as

where, A is the area of forefoot, B is the area of midfoot, and C is the area of rearfoot. When the value of the AI ≤ 0.21, it means high arch foot, and when the value of 0.2 < AI < 0.26, it means normal foot, as well as the value of AI ≥ 0.26, it concludes flat foot. 18
(2) Plantar pressure test. In this experiment, the planter pressure test is mainly divided into static and dynamic, and each group of data need to be measured three times in order to obtain the mean value and reduce the influence of measuring error. Static and dynamic tasks were performed barefoot.
The static tests contain three types, which are no-load, half-load and full-load. Each foot has to go through the stages of single support, double support, and swing repeatedly, which respectively represents that the foot is in the full load-bearing state, half load-bearing state, and no load-bearing state, as showed by Figure 2. Before the static test, each participant was informed of the specific experimental process and conducted five warm-up tests.

Experimental scene: (a) acquisition system diagram, (b) no load-bearing state, (c) the test scene of plantar pressure for half-load, (d) full load-bearing state, and (e) the dynamic test.
The detailed static experiment process is as follow. Firstly, subjects were asked to sit upright on the chair, with the sitting depth of 90° between the knee and leg, and the plantar pressure distribution were collected under the condition of no load. Secondly, the subjects stand upright with eyes closed, with both feet on the plantar pressure measuring plate, and make the center of the index finger and heel in a straight line, in order to obtain the plantar pressure distribution under half load state. Finally, the subjects closed their eyes and stood on their left and right feet, respectively, so as to measure the plantar pressure distribution of both feet under full load.
In the dynamic plantar pressure test, the midgait method 31 is used to obtain the dynamic plantar pressure data. Participants are required to walk through the plantar pressure measuring board with their left foot, and then walk back with their right foot, so that the dynamic plantar pressure distribution of both feet can be obtained. The specific experimental process is as follows. First, the subjects walked straight ahead at their chosen speed for 10 m, with the equipment in the middle. Then, while walking on the pressure board, participants ensured that the index finger of their foot was on the marked white line. Finally, three successful experiments were collected for each dynamic task, with an interval of 15 min between the two experiments to eliminate the effect of fatigue.
Data processing
For all participants, three identical trails were selected to calculate the average values of the data for each participant’s right feet and left feet, respectively. As shown in Figure 4(a), the toe part is removed from the isobaric area of the plantar, and the rest is divided into three equal parts. Among them, the area of one small square is recorded as
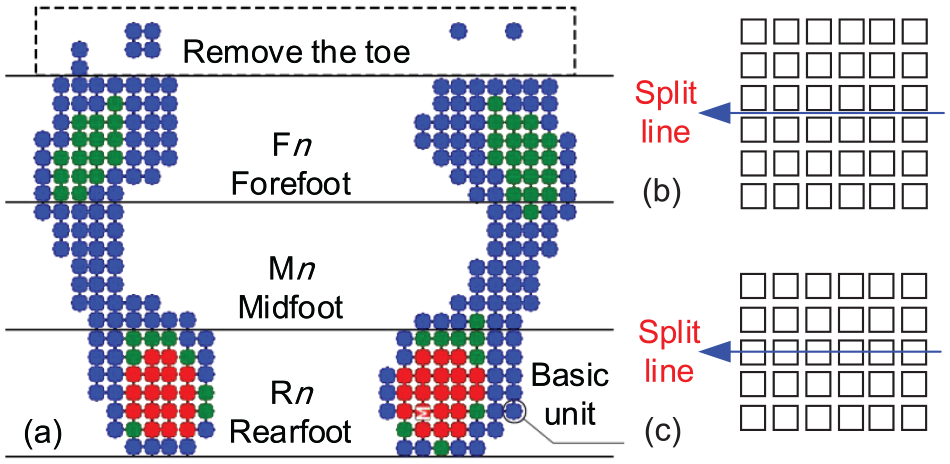
Isobaric view of plantar pressure chart (a) shows the plantar pressure distribution. (b and c) It represent the case where the dividing line is on or not on the small square.
Then, this work introduced a new method Arch Index
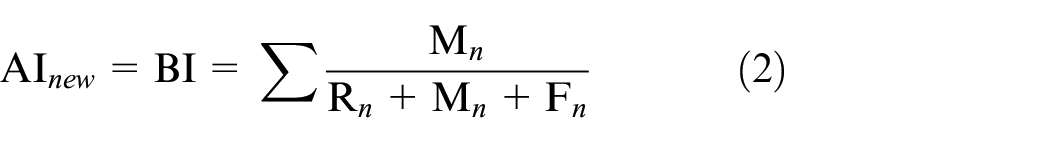
The isobaric view of foot plantar is divided into sixteen parameters as follow, (1) the value of BI with no-load (NL-BI), (2) high pressure with no-load (NL-HP), (3) medium pressure with no-load (NL-MP), (4) low pressure with no-load (NL-MP), (5) the value of BI with half-load (HL-BI), (6) high pressure with half-load (HL-HP), (7) medium pressure with half-load (HL-MP), (8) low pressure with half-load (HL-LP), (9) the value of BI with full-load (FL-BI), (10) high pressure with full-load (FL-HP), (11) medium pressure with full-load (FL-MP), (12) low pressure with full-load (FL-LP), (13) the value of BI with dynamic test (DT-BI), (14) high pressure with dynamic test (DT-HP), (15) medium pressure with dynamic test (DT-MP), and (16) and low pressure with dynamic test (DT-LP).
The dynamic plantar contact is described as five distinct instants (Figure 4(a)), which are include initial contact phase (ICP), rear foot contact phase (RFCP), mid foot contact phase (MFCP), fore foot contact phase (FFCP), as well as total foot contact phase (TFCP), respectively. The gray track of point M in Figure 5 represents the track of COP (center of pressure). Due to the movement of COP, there are changes in plantar maximum pressure (MP) and average pressure (AP). Then, the plantar pressure data is normalized by time, and the plantar pressure curve is drawn by origin (version 2021) (Figure 4(b)).

(a) Five distinct phases of foot contact. All images represent data within 3 s. (b) Variation curve of maximal pressure with dynamic test.
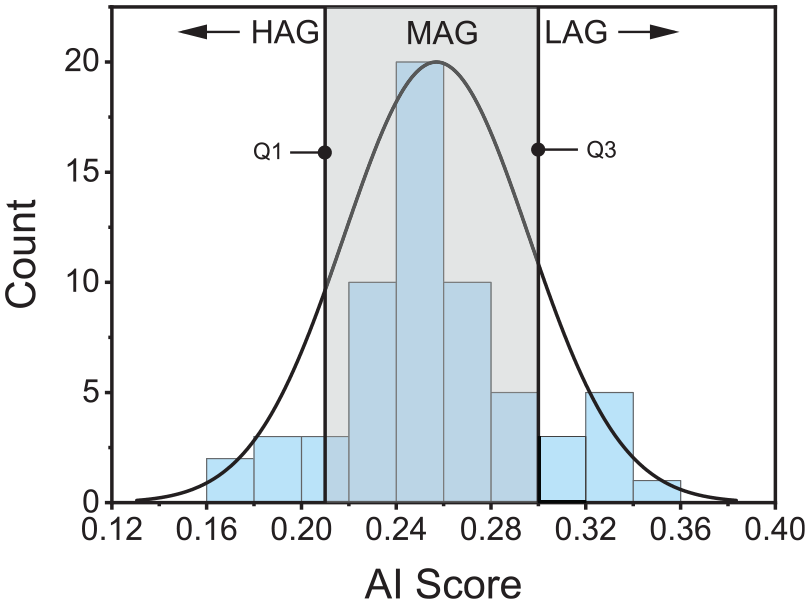
Histogram of AI scores obtained from 62 participants aged 22 to 27 years.
Figure 4(b) shows plots the variation of the maximal pressure throughout five distinct phases of foot contact with during dynamic test throughout five distinct phases of foot contact (Figure 4(a)). The pressure changes can be observed by M mark point (Figure 4(a)) during walking, it is clear that
Two wave crests (

The distance of


Statistical analysis
The average values for the plantar pressure and the described variables were obtained by averaging the discrete values in three selected trials. Foot type is classified by arch index, which used MATLAB R2016a (Mathworks, USA) to achieve image recognition for footprint. In the plantar pressure test, 19 parameters related to foot type were selected to analyze using Spearman correlation coefficient.
Next, the assumption of normally distributed data was verified using the Shapiro-Wilk test, and was confirmed for all variables. Consequently, differences between the nine conditions (age, gender, height, mass, BMI, NL-BI, HL-BI, FL-BI, and DT-BI) were compared using one-way repeated measures ANOVA. Furthermore, the consistency between NL-BI, HL-BI, FL-BI, and DT-BI and AI was tested, and the classification accuracy was measured by Kappa coefficient and density plots. All statistical tests were done with the statistical program SPSS (Version 26) and p < 0.05 was taken as a level of significance.
Results
In order to verify and evaluate the new method of foot-type classification in the above research, 62 samples were selected for static and dynamic experimental tests according to the test scheme in 2.2. The specific results are as follows. The arch index is a traditional method for foot type classification, the results of AI are arranged from small to large using a large number of experiments. The first quartile Q1 = 0.217 and the third quartile Q3 = 0.261 were taken as the boundary of the foot type classification, and the value of AI ≤ 0.217 means pes cavus, whereas, the condition of 0.217 < AI < 0.261 implies normal feet, as well as the value of AI ≥ 0.261 signifies pes planus.
Similarly, the values of AI for 62 samples (31 participants) in this study were calculated, and their Q1 and Q3 quartiles were taken to divide all foot types into three categories (Q1 = 0.235, Q3 = 0.277), which are LAG group (the lower arch group, AI ≥ 0.277), MAG group (the middle arch group, 0.235 < AI < 0.277), and HAG group (the higher arch group, AI ≤ 0.235) (Figure 5). It was found that the subject occurs asymmetric feet due to one of the feet is the main load-bearing foot. Although the subject has difference foot type data (such as high arch and normal foot, or flat foot and normal foot) commonly, it was not occurred abnormal phenomenon, such as one foot is flat arch but the other is high arch.
Representative data of Spearman correlation coefficient are presented in Figure 2 and descriptive statistics are presented in Table 1. A significant effect of feedback (Table 1) was found NL-BI (p = 0.006), HL-BI (p = 0.001), FL-BI (p < 0.001), and DT-BI (p < 0.001) but not age (p = 0.226), gender (p = 0.444), height (p = 0.174), mass (p = 0.675), and body mass index (p = 0.232). Also, the significant mark of the figure (Figure 6) has the same rule for the ratio of MFCA with four different states. In three static states (no-load, half-load, and full-load) and dynamic test, the plantar pressure has extremely similar distribution rules for half-load, full-load, and dynamic test (p < 0.05).
Participant characteristics by footprint group. Values reported as mean ± standard deviation unless otherwise noted.

Reported using the foot arch index (AI) scale as the median score (25th, 75th percentile value).
Significant effect: p < 0.05; indicated in bold.

Correlation coefficient diagram.
It can be concluded from the research, the foot type of young adults was not significantly related to age, gender, height, and mass, as well as BMI, which indicates that participants’ foot type data is not affected by these factors. So the follow-up study may have clinical significance. For example, it has been shown that a more pronated foot type with greater body fat, and the obese needs to identify the flatfoot, because it is also one significant factor of the obesity and falls for the old.32–34 Razeghi and Batt 17 summarized the factors influencing the formation of the foot arch, including age, gender, race, shoes, and the age of wearing shoes, as well as proposed that the use of an effective and reliable foot type classification method is crucial for evaluating the relationship. The relationship included not only foot structure and function, but also foot type and injury risk.
Further calculate the minimum value, the first quartile Q1, the median value, the third quartile Q3, and the maximum value of NL-BI, HL-BI, FL-BI, DT-BI, and AI, as shown in Table 2. Then, according to the frequency distribution histogram of NL-BI(Figure 7(a)), HL-BI(Figure 7(b)), FL-BI(Figure 7(c)), and DT-BI(Figure 7(d)), observed the area between Q1 and Q3, and found that the HL-BI, FL-BI, and DT-BI scores are more concentrated than NL-BI scores.
Distribution characteristics of five groups of experimental data.

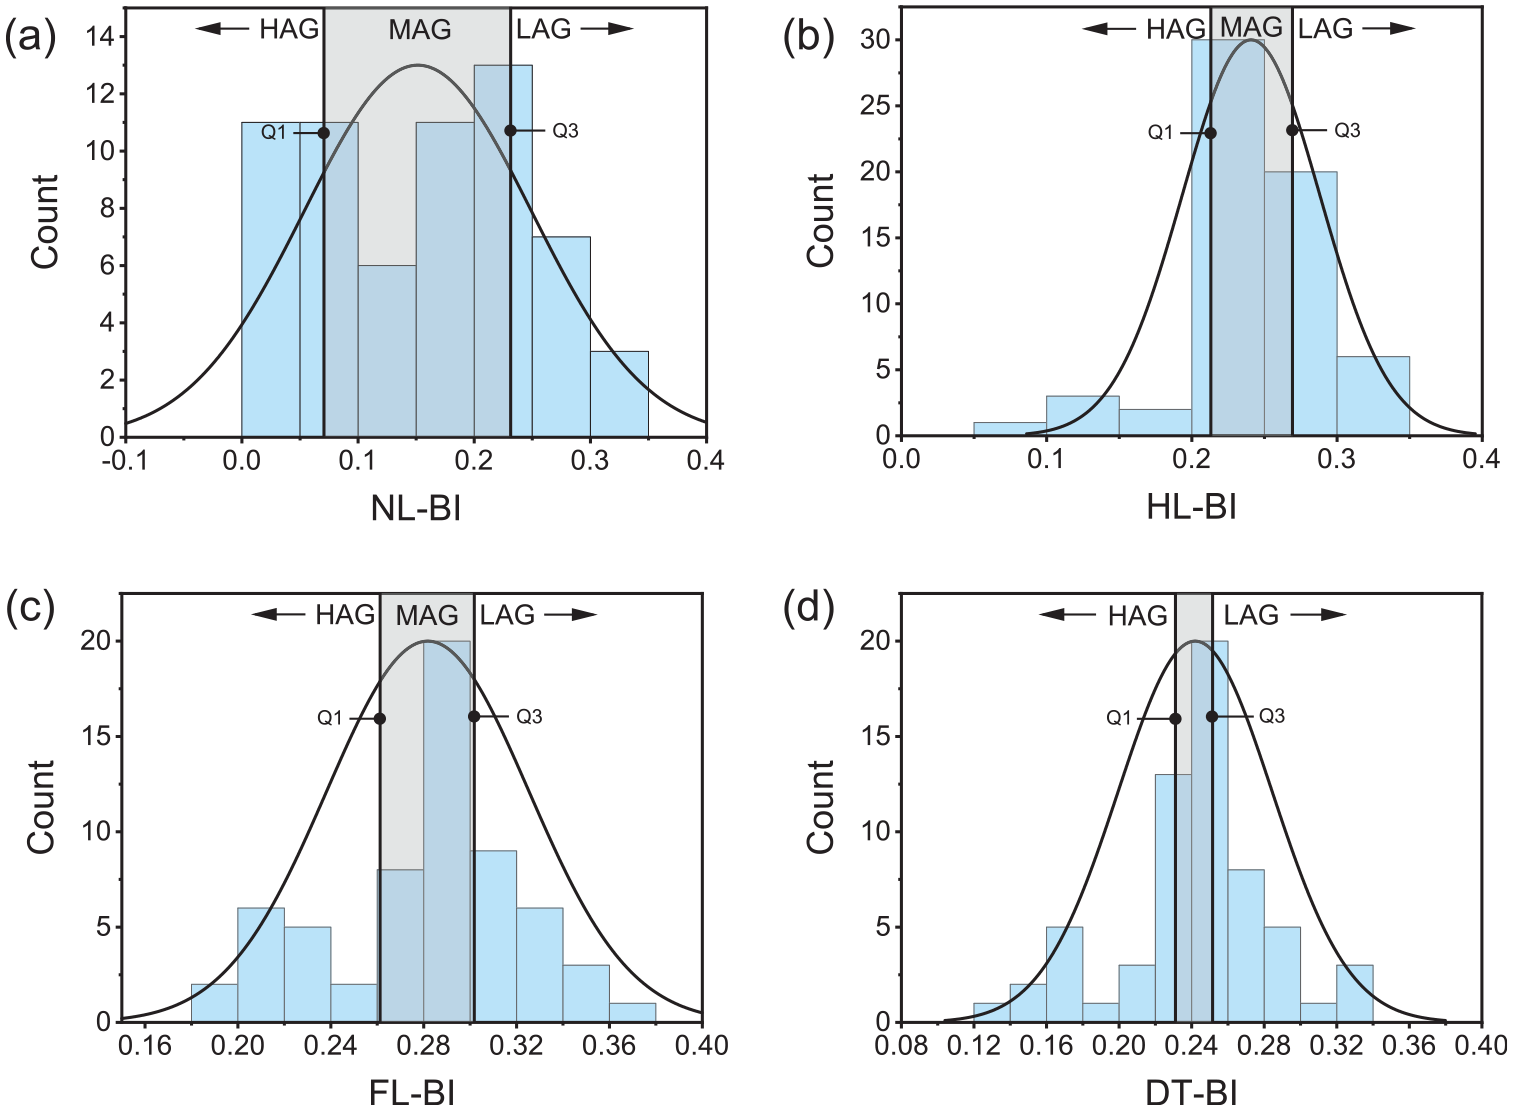
Histogram of (a) NL-BI, (b) HL-BI, (c) FL-BI and (d) DT-BI scores.
Five methods were used to evaluate, which can divide 62 samples (31 participants) into LAG, MAG, and HAG. Now through the calculation of intraclass correlation coefficient (ICC) and Kappa consistency coefficients in SPSS software, the consistency of the classification results of the five classification methods are analyzed. The Intraclass Correlation Coefficient (ICC) results were good reliable and reproducible for both measurements (DT-BI value 0.738, 95% confidence interval [0.535, 0.848],
According to the results of statistical analysis, it can be seen whether the value of NL-BI, HL-BI, FL-BI, and DT-BI only belong to one group of LAG, MAG, and HAG relative to the AI value. In the LAG group, HL-BI (p = 0.01 < 0.05), FL-BI (p = 0.01 < 0.05), and DT-BI (p = 0.001) is significant (see Table 3). In the HAG group, only the DT-BI (p = 0.001) is significant.
Using Kappa consistency test. Compared NL-BI, HL-BI, FL-BI, and DT-BI with Arch Index (AI) respectively.

Significant effect: p < 0.05; indicated in bold.
Significant effect: Kappa ≧ 0.75; the diagnostic results of the two methods are consistent; indicated in bold.
Significant effect: 0.4 ≦ Kappa < 0.75; the diagnostic results of the two methods are generally consistent; indicated in bold.
Similarly, in the histogram of the density distribution of AI, NL-BI, HL-BI, FL-BI, and DT-BI as shown in Figure 8., HL-BI, FL-BI, and DT-BI have similar normal distributions with AI, but the density distribution of NL-BI has obvious difference. It is further verified that the BI value can be used to scientifically and accurately distinguish the foot type. Using four methods to compare with AI to analyze whether it is LAG or MAG, HAG or MAG, LAG or HAG (Figure 8). The results show that the value of NL-BI (k = 0.602, p < 0.05), HL-BI (k = 0.889, p < 0.001), FL-BI (k = 1.000, p < 0.001), and DT-BI (k=0.791, p < 0.001) have high consistency between LAG and HAG, while DL-BI has the highest consistency with AI.

Distribution and density plots.
In our study, it can be found that the plot of maximal pressure occurs the lower peak, the upper peak and the valley, and different individuals produce different results. The lower peak (

Effect of plantar pressure on the activity of the different foot types: (a) maximal pressure diagram, (b) distance diagram of pressure, (c) peak diagram of averages pressure and (d) index diagram of maximal pressure.
One aim of our study was to evaluate reproducibility of the dynamic parameter of
It needed to be highlighted that (1) the experimental sample size is too small, and (2) the parameters of normal participants were compared with those of patients. It may have influence on the experimental results. So, it will be considered seriously in our future researches.
Conclusion
This paper presents a method of foot type classification for young adults based on static and dynamic plantar pressure distribution. The correlation between static foot structure and dynamic foot function was studied, and the classification method was compared with the traditional method. The results of this study supported the hypothesis that (1) The proposed general method of human foot-type classification can accurately judge the foot type, which is verified by comparative experiments; (2) AI can be described by HL-BI (p < 0.05), FL-BI (p < 0.05), and DT-BI (p < 0.05), which seems to provide a reproducible measurement; (3) the dynamic parameter included
Footnotes
Handling Editor: Chenhui Liang
Declaration of conflicting interests
The author(s) declared no potential conflicts of interest with respect to the research, authorship, and/or publication of this article.
Funding
The author(s) disclosed receipt of the following financial support for the research, authorship, and/or publication of this article: This work was supported by Ministry of education Youth Fund Project (Grant number 21XJC760003), Outstanding Talents Support Program Project (Grant number 106-451420001), and Common technology and field fund for equipment pre research (Grant number 106-418321001). The authors would like to express their appreciation to the agencies.