
Abstract
A modified progressive damage model is constructed to analyze the damage mechanics and damage development of composite laminates induced by low-velocity impact in this article. The damage modes are judged by the 3D Hashin failure criterion. A modified damage evolution model, which was constructed based on through-thickness normal strain component
Keywords
Introduction
Compared with traditional aerospace materials, composite materials are conducive to improving structural strength and reducing weight. 1 However, their poor impact resistance may raise barely visible impact damage (BVID)2,3 subjected to low-velocity impact, which will seriously endanger the safety and overall strength of aircraft. Numerical simulation is considered as an efficient tool to describe the complicated dynamic impact behavior of composite laminates.4,5 Therefore, a finite element model that can simulate the dynamic mechanical behavior and damage development of composite laminates induced by low-velocity impact is needed to be established. 6
The complex mechanical properties of composite materials can be simulated by the constitutive models.
7
Among these developed constitutive models, progressive damage model (PDM)8,9 including failure criteria and damage evolution model has been introduced in many studies to describe the damaged mechanics of composite materials.10,11 Considering that composite materials are usually composed of fiber and matrix, it is necessary to apply failure criteria to determine the specific damage mode of fiber and matrix. In recent years, the 3D Hashin criterion,12,13 Chang-Chang criterion,14,15 and Puck criterion16,17 have been adopted in many studies. Among the three failure criteria, except the 3D Hashin criterion, the matrix damage initial conditions of the other two criteria ignore the through thickness stress component
Once one of fiber or matrix damage modes appears during impact, it is necessary to adopt appropriate damage evolution model to simulate the stiffness degradation of composite laminates. In previous studies, the predefined constants18,19 or exponential degradation models
20
can successfully simulate the reduction of the stiffness. Lisbôa et al.
21
determined the damage variables of composite cylinders under radial considering the winding pattern through experimental test. The experimental results are in good agreement with the finite element results. Almeida et al.
22
studied the open-hole tension characteristics with variable-axial composite laminates by using a predefined constant degradation model. However, numerous of empirical parameters or empirical formulas limit the application range and prediction accuracy of these two degradation models. Sun et al.,
23
Liu et al.,
24
Long et al.
25
developed the energy evolution model in their works to study the progressive damage process of composite materials. Ferreira et al.
26
proposed a UEL (User Element subroutine) based on a continous damage model to evaluate the damage of composite materials. Almeida et al.27,28 studied the buckling and post-buckling properties of filament wound composite tube under axial compression by adopting progressive damage model based on energy evolution model. Although the damage mechanical behavior of composites in 3D was studied in their works,29,30 only the transverse strain
The inter-laminar delamination, which will seriously reduce the overall strength of composite laminates, is a typical damage mode induced by low-velocity impact. 31 Therefore, it is necessary to apply an appropriate tool to simulate the development of inter-laminar delamination. There are two efficient tool that can be adopted to predict delamination, including virtual crack closure technique (VCCT) 32 and cohesive zone model (CZM). 33 However, the crack initiation and propagation path need to be predefined when the VCCT is implemented, which cannot satisfy the requirements of damage prediction. In contrast, CZM with damage initiation criterion and damage evolution model will be more suitable for simulating the development of delamination.2,7
In this article, a finite element model that can simulate the dynamic mechanical behavior and damage development of composite laminates is implemented in ABAQUS/Explicit package subjected to low-velocity impact. The stiffness degradation of composite materials is simulated by a proposed three-dimensional damage evolution model including
Methodology
Three aspects should be considered in finite element model of composite materials subjected to low-velocity impact: (1) Appropriate composite failure criteria to determine each damage modes; (2) Appropriate damage evolution model is applied according to the damage modes of composite materials; (3) Appropriate numerical technology to simulate the initiation and development of inter-laminar delamination.
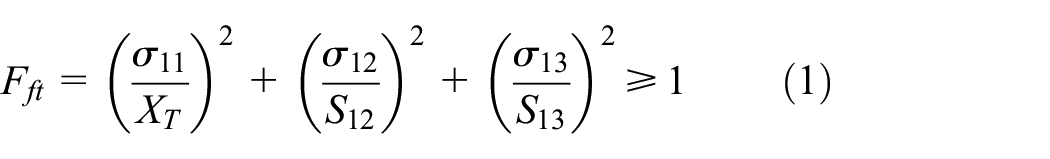
Failure initiation criterion
The traditional failure criteria, which can only judge the failure of composite materials,
2
are mainly based on equivalent stress and equivalent strain, such as Tsai-Wu and Tsai-Hill criterion. However, the manufacturing characteristics of composite materials require that the damage modes of matrix and fiber should be clearly observed through failure criteria. The 3D Hashin criterion, as the most popular failure criterion, can accurately predict four main damage modes of composite materials, and has been widely used in numerous studies because the influence of
Fiber tensile damage (
Fiber compressive damage

Matrix tensile damage

Matrix compressive damage

Where
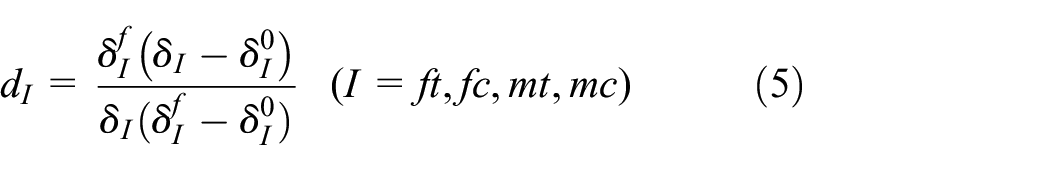
Damage evolution model
When the value of damage criterion is equal to 1, it is necessary to apply suitable damage evolution model to describe the continuous degradation process of composite stiffness. The damage evolution model including fracture energy of fiber and matrix has been introduced in many studies.34,35 The strength and damage variables of each element nodes are closely related to their strains

The constitutive model of damage evolution model based on fracture energy of composite materials.
Fiber tensile and compressive damage evolution model
According to the initial conditions of fiber tensile damage (


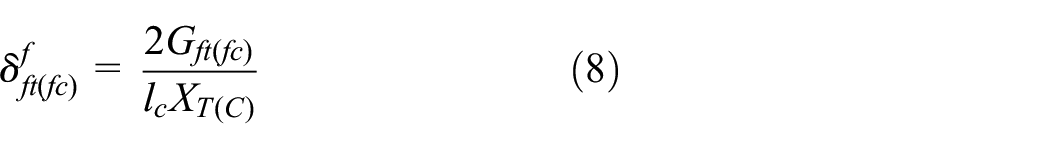

Where
Matrix tensile and compressive damage evolution model
The original energy evolution model only introduced the transverse strain
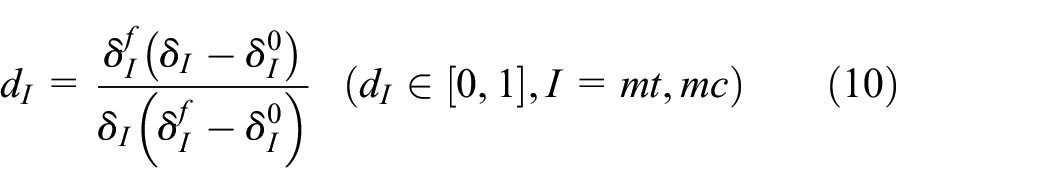


Where
Computation of equivalent strain for the original and modified damage evolution model.

Damage matrix of composite materials
The damage variables of fiber and matrix should be introduced in the damage matrix of composite materials to capture the changes of the mechanical behavior. The degraded compliance matrix


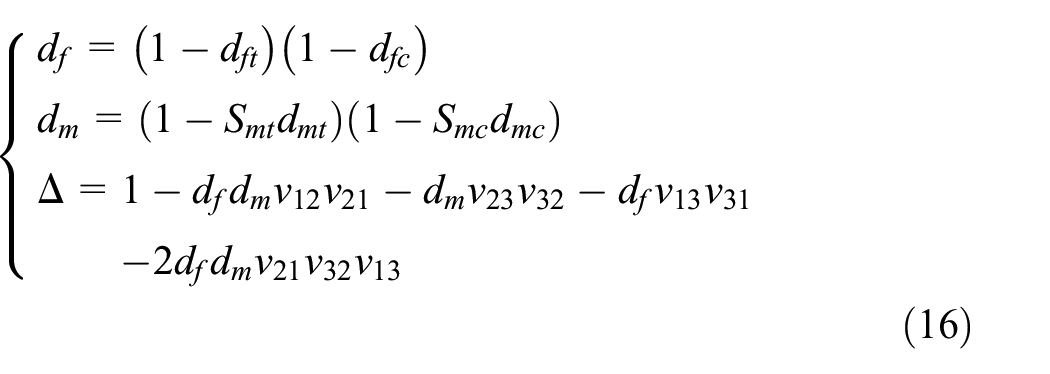
Where the total fiber damage variable
Delamination
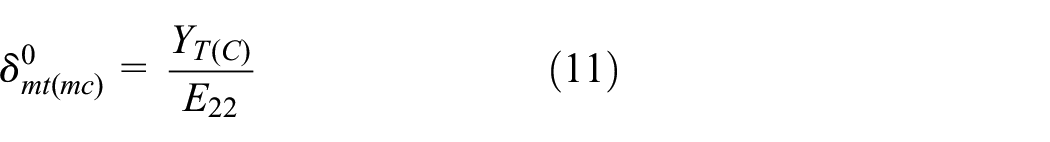
In this paper, the cohesive elements with bilinear traction-separation relationship are inserted between layers to predict the initiation and development of inter-laminar delamination. The Quadratic failure criterion is used to judge the initiation of delamination, as shown in equation (17). The Benezeggaph and Kenane (B-K) criterion36,37 is used to describe the evolution of delamination, as shown in Eq. 18.

Where
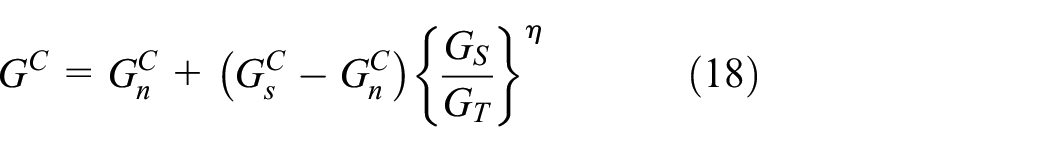
Where
Finite element model for low-velocity impact
Dimension parameters and boundary conditions
In this study, the finite element model composed of composite laminate and impactor is established in ABAQUS/Explicit package to capture the changes of mechanical behavior. The geometric parameters are illustrated in Figure 2. The geometric dimensions of the finite element model are provided by Shi et al. 2 The composite laminate with a diameter of 75 mm is composed of eight layers with a thickness of 0.25 mm and seven interfaces with a thickness of 0.0075 mm and the stacking sequence is [0/90]2S. Considering that the semicircular impactor with a diameter of 15 mm will not be significantly deformed during the low-velocity impact, it is regarded as an analytical rigid impactor to reduce the computation cost. Constrain the freedom of impactor in the X and Y directions to ensure that the direction of movement of the impactor is always perpendicular to the composite laminate. In order to obtain the three impact energies of 7.35, 11.03, and 14.7 J in the experiment test, the mass of the impactor with a speed of 3.83 m/s is set to 1, 1.5 and 2 kg respectively.
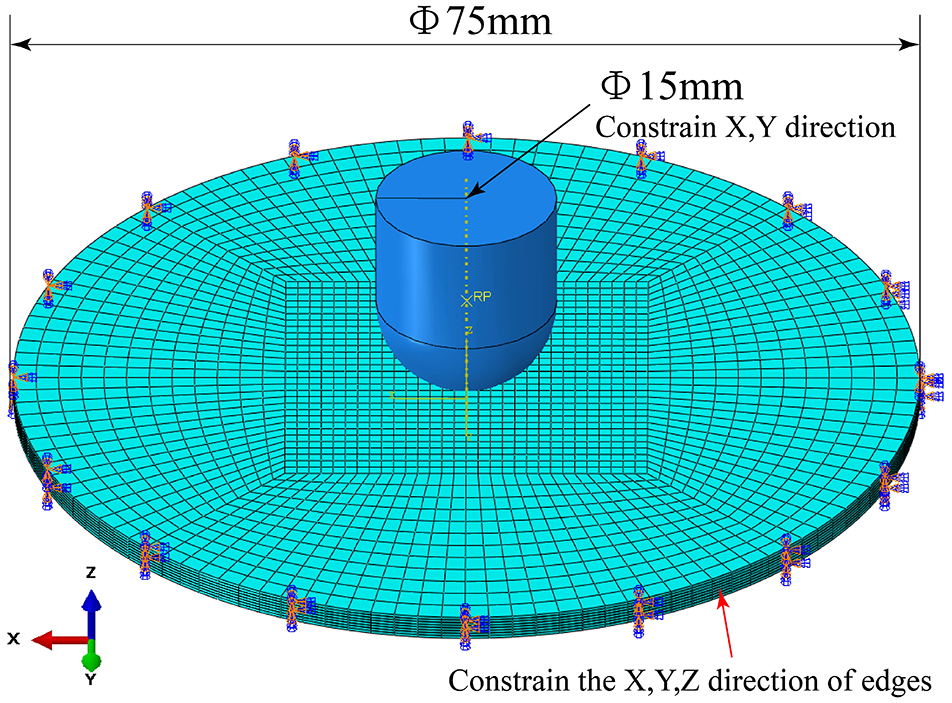
The dimensional parameters and boundary conditions of finite element model.
Mesh types and contact algorithm
In this model, seven interfaces with a thickness of 0.0075 mm, which are composed of 13,860 eight-node three-dimensional cohesive elements (COH3D8), are inserted into layers to simulate the initiation and evolution of delamination. In order to avoid excessive deformation of composite laminates, the maximum degradation of cohesive element is controlled at 0.99. The material properties of cohesive element provided by Zhou et al. 7 are shown in Table 2. Eight layers, which are composed of 15,840 eight-node elements with reduced integration (C3D8R), are used to simulate the intra-laminar damage of composite materials. The distortion control is activated to avoid excessive element deformation. The properties of composite materials provided by Shi et al. 2 is shown in Table 3. Appropriate mesh density can ensure the accuracy and efficiency of the computation. Therefore, the size of 1 mm × 1 mm elements are applied to simulate the experimental damage zone.


A suitable contact algorithm shoule be implemented to simulate the contact between the impactor and the composite laminate, which will be beneficial to obtain more accurate numerical results. The general contact algorithm in ABAQUS/Explicit package is adopted in this article, and the friction coefficient between the impactor and the composite laminate is 0.5.38,39
Numerical results and discussion
In this section, the results of FEM and experiment results of Shi et al. 2 under three impact energies (7.35, 11.03, and 14.70 J) are compared to verify the effectiveness of the modified progressive damage model. Moreover, the sensitivity of cohesive element thickness is studied.
Model validation
In this part, the mechanical behavior changes of composite laminates predicted by FEM, including impactor energy, react force, displacement, and damage development, are compared to experimental data under three impact energies (7.35, 11.03, and 14.70 J). By comparing the differences between original and modified damage evolution model, the advantages of
Mechanical behavior changes of composite laminates
Figure 3 illustrates the energy-times curves of impactor predicted by original and modified damage evolution model. The original damage evolution model in method A only considers
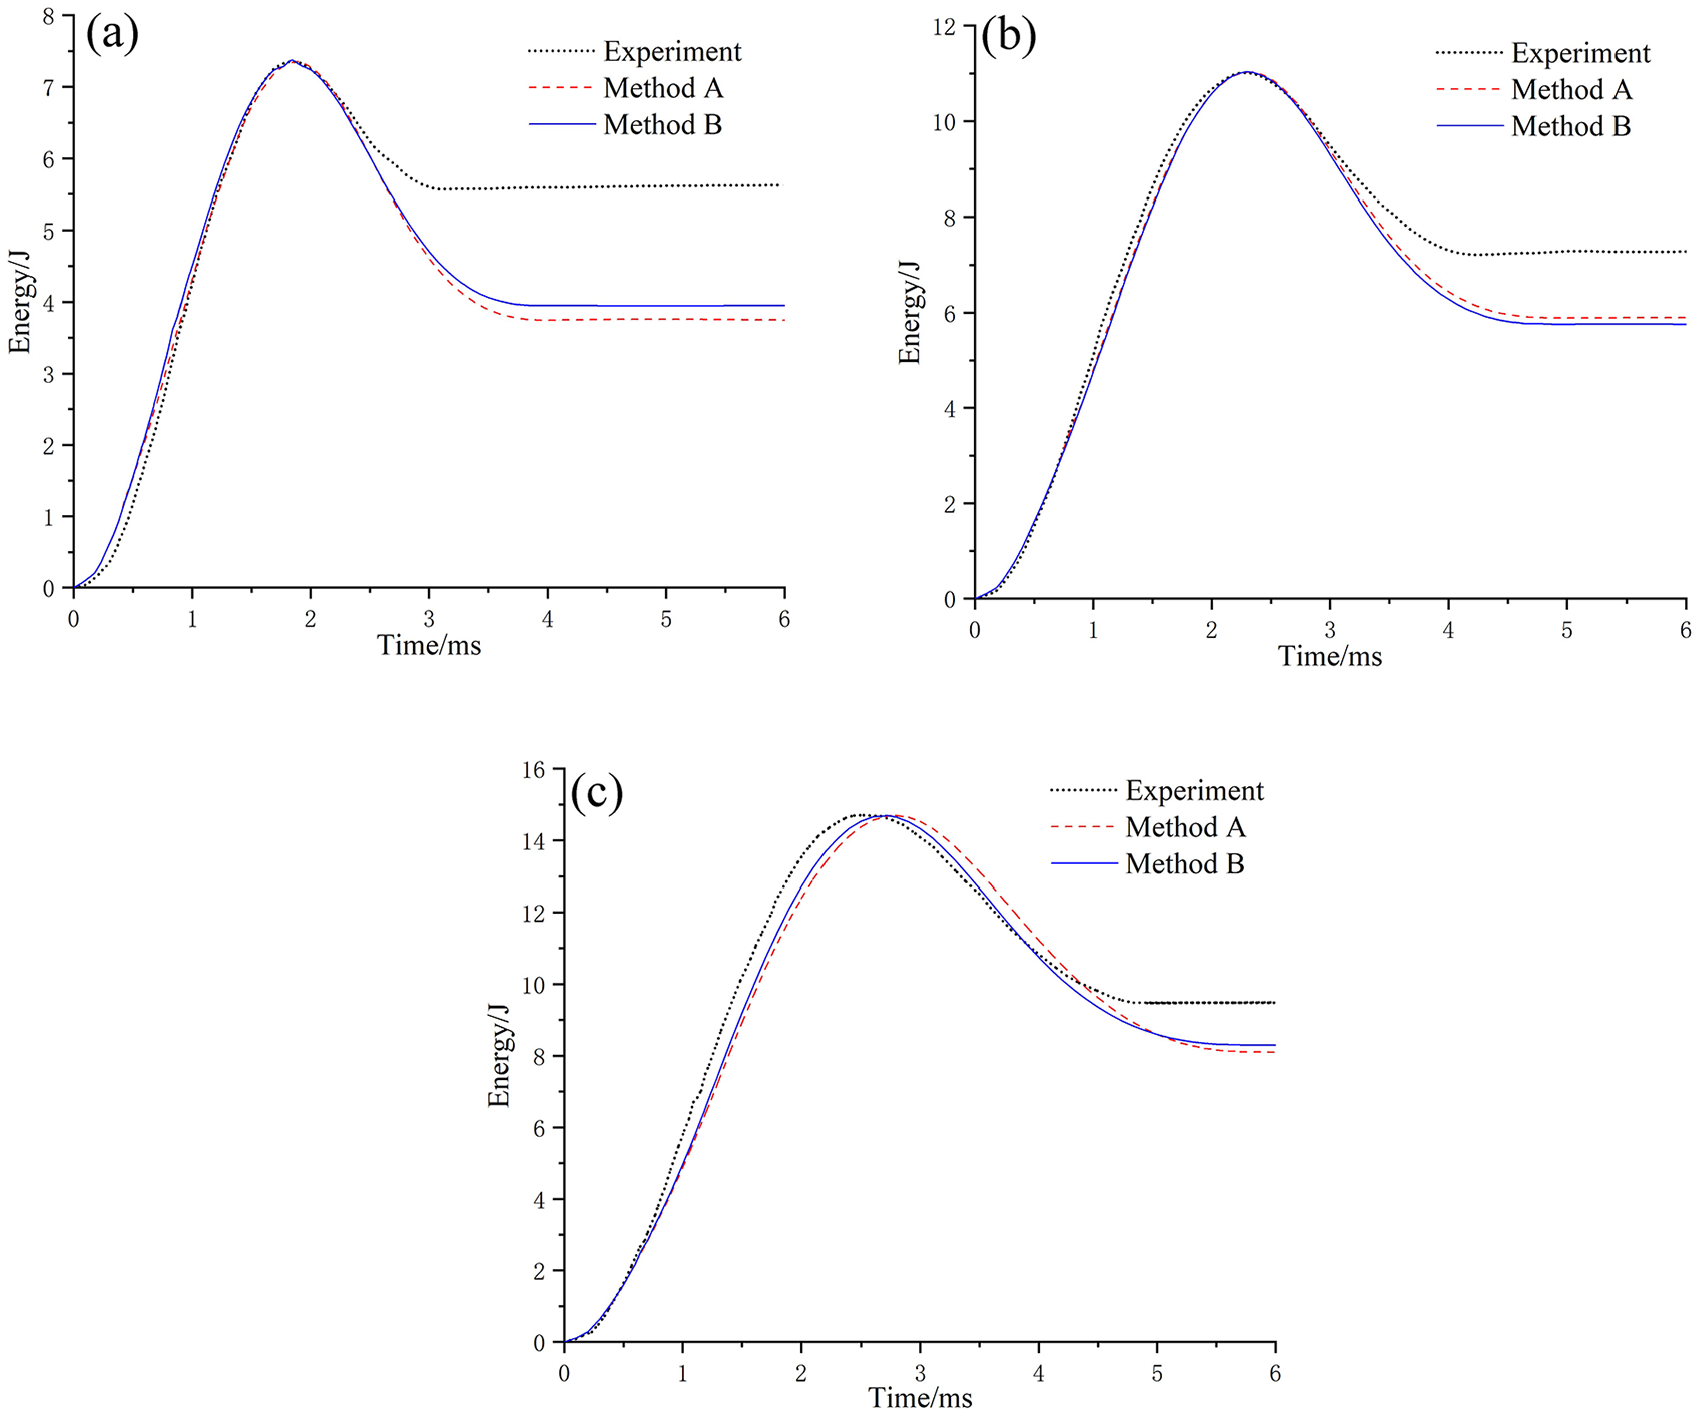
Energy-time curves of FEM and experiment under three impact energies: (a) 7.35 J, (b)11.03 J, and (c) 14.7 J.
Comparing Figure 3(a) to (c), the FEM results of three different impact energies have a good agreement with experimental data. The final absorbed energy of two damage evolution models is always lower than experiment, but the difference between FEM and experiment will gradually decrease with the increase of impact energy. The reasons for the phenomenon may come from two aspects: (1) It is difficult for FEM to accurately describe the complex contact behavior induced by low-velocity impact, such as the interaction between the matrix and the fiber in the composite material, and the friction force between the layers. (2) There is still a certain residual bonding strength between the layers because the maximum degradation of cohesive elements is controlled at 0.99. Method B leads to a higher energy absorption rate of composite laminates than method A, which is reflected in the energy-time curve of method B always reaches the peak point before method A, which makes the result of method B closer to the experimental results. The energy-curves at the rebound stage predicted by method B have good relationship with the experimental results, especially under the impact energy of 14.7 J. The reason is that the computation of matrix damage variables in modified damage evolution model is controlled by
It is found that considering
The strain component of central element on the back side.

Figure 4 shows force-time curves of FEM results and experiments of different impact energies (7.35, 11.03, and 14.7 J). It is observed that there will be a more severe vibration amplitude in impact phase when the method A is implemented. In contrast, the overall vibration amplitude predicted by method B is relatively stable. The phenomenon indicates that the modified progressive damage model can make the damage stiffness matrix

Force-time curves of FEM and experiment under three impact energies: (a) 7.35 J, (b) 11.03 J, and (c) 14.7 J.
Comparing Figure 4(a) to (c), the FEM results of three impact energies have a good agreement with experiment force-time curves. It is found that when the impact energy increases from 7.35 to 14.7 J, the differences of the peak force between method A and experimental result becomes larger, while the maximum force predicted by method B has the opposite trend, which agrees well with the experiment. In the rebound phase, the difference between the force-time curves predicted by the two methods under low level impact energy is small. However, under impact energy 14.7 J, there is a significant difference between method A and method B. The reason is that the
Figure 5 illustrates the force-displacement curves of FEM and experiment under three impact energies. It is found that the force-displacement curves of method A and method B under impact energy 7.35 and 11.03 J are greater than experimental curves in rebound phase. The force-displacement curve predicted by method B are in good agreement with the experimental data under the impact energy of 14.7 J. The maximum displacement obtained by method B which represents the maximum deformation of composite laminate is closer to the experimental results, and the maximum displacement is almost the same as the experimental results when the impact energies are 7.35 and 11.03 J. This verifies the effectiveness of the proposed damage evolution model which was constructed based on through-thickness normal strain component

Force-displacement curves of FEM and experiment under three impact energies: (a) 7.35 J, (b) 11.03 J, and (c)14.7 J.
Damage modes and damage distribution
One advantage of FEM is the convenience to observe dynamic impact process and damage modes. In this part, the dynamic process of impact and failure, matrix tensile damage, matrix compressive damage, and inter-laminar delamination of composite laminate are studied in detailed.
Figure 6 illustrate the process of impact and failure under the impact energy of 11.03 J. At 2.12 ms, the kinetic energy of the impactor has been completely absorbed. It is found that during the entire impact process, multiple failure modes appeared on the composite laminate. From the point of damage propagation rate, the entire impact process could be divided into three stages. (1) The damage develops slowly. Due to the excellent design mechanical properties of composite laminates, the damage propagation rate is low. However, the duration of this stage is short, because the occurrence of fiber damage makes the load-bearing capacity of the composite laminates drop sharply; (2) The damage develops rapidly. The larger impact energy makes each damage mode spread rapidly at this stage. Among them, the propagation rate of matrix tensile damage is the largest, which propagates from the bottom of the composite laminate to the impact surface. The development direction of matrix compression damage is opposite to that of matrix tensile damage. The end of this stage is marked by the kinetic energy of the impactor being 0. (3) Rebound stage. Due to the absence of external impact loads at this stage, the damage modes on the composite laminate hardly propagate.

The process of impact and failure under the impact energy of 11.03 J.
The distribution of matrix tensile damage on each layer predicted by two damage evolution model under the impact energy of 14.7 J are shown in Figure 7. The elements in the red region have been completely damaged, while the blue denotes undamaged region. It is found that the area of matrix tensile damage is the largest on the fifth, sixth, and seventh layers. Furthermore, the area of matrix tensile damage increases from first layer to seventh layer. The reason for the phenomenon could come from two aspects: (1) The bend deformation of the composite laminate gradually increases from the first layer to the eighth layer, resulting in a larger tensile load; (2) The impact load transmitted by layer aggravates the matrix tensile damage. Also, more serious matrix tensile damage areas appeared on each layer predicted by method B. This can be explained by the introduction of

The distribution of matrix tensile damage on composite laminate under the impact energy of 14.7 J: (a) Method A and(b) Method B.
The matrix tensile damage on each layer shows different shapes. The matrix tensile damage shape of the first to seventh layers is similar to rectangle, but not all the long sides of the rectangle are parallel to the fiber orientation of the corresponding layer, such as the first and sixth layers. The tensile damage shape of the matrix on the eighth layer is similar to butterfly shape. These phenomena suggest that the propagation direction of matrix tensile damage is influenced by fiber direction and impact load. There are tiny hollows shapes with different areas on each layer predicted by method A, but this phenomenon has been effectively alleviated after applying method B, especially in the top four layers. The tiny hollows shape can be attributed to the Hashin criterion which uses the summation of transverse and out-of-plane normal stress to evaluate the tension and compression failure for matrix.
7
However, the modified progressive damage model including
The distribution of matrix tensile damage of composite laminates predicted by two progressive damage model under the impact energy of 14.7 J are shown in Figure 8. It is found that compared with the matrix compression damage, the matrix tensile damage shows a more serious damage area, which indicates that the main reason for the decrease of the overall strength of composite laminates is the excessive area of matrix tensile damage. The area of matrix compressive damage gradually decreases from the first layer to last layer. The reason could be that the C3D8R element and COH3D8 element whose damage variables reaches 1 is not deleted in this paper so that the first layer keeps contact with impactor, which makes the propagation orientation of matrix compressive damage is from first layer to eighth layer. A phenomenon needs to be noted is that although the method A and method B show the similar matrix compression damage area, there are scattered damage near the impact center of each layer predicted by method B. The reason could be that the through thickness strain component

The distribution of matrix compressive damage on composite laminate under the impact energy of 14.7 J: (a) Method A and (b) Method B.
The distribution of inter-laminar delamination predicted by FEM and experiment under 14.7 J impact are shown in Figure 9. By comparing Figure 9(a) to (c), it is found that delamination area predicted by FEM is composed of complete damaged region (red region), undamaged region (blue region), and partially damaged region (the rest color region). Among them, the partially damage region surrounds the complete failed region, which indicates that delamination damage extends outward from the center of each layer. The delamination damage area which includes complete damage region and partially damage region predicted by two methods is larger than the X-ray radiograph. Compared to method A, method B shows a more severe area of complete delamination damage. The reason could be that method B shows lager area of matrix tensile damage, which leads to higher interface force.

The distribution of inter-laminar delamination of 14.7 J impact energy predicted by FEM and experiment: (a) X-ray radiograph, (b) overall delamination distribution of method A, (c) overall delamination distribution of method B, (d) delamination on seven interfaces of method A, and (e) delamination on seven interfaces of method B.
The distribution of delamination on each interface predicted by two damage evolution models are illustrated in Figure 9(d) and (e), respectively. It is found that both two methods capture that the development orientation of delamination on the last five interfaces is parallel to the fiber direction of the layer below the corresponding interface, but the first interface has the opposite trend. The reason for this phenomenon could be that the development orientation of delamination on interface 1 is controlled by the high-level friction force, while the propagation orientation of delamination on last five interfaces is influenced by bending deformation. Both methods have observed that the delamination on the interface 2 is mainly partial damaged region, which indicates that the interface 2 still maintains certain load-bearing capacity. Furthermore, the area displayed on the interface 6 is mainly the complete delamination damage, with few partial failures. The main difference between the two methods for predicting delamination is the area of complete damaged region. Method A shows larger delamination area than method B because the maximum deformation of the composite laminates predicted by two methods shows the similar trend. On the remaining six interfaces, the delamination area predicted by method B is larger than that of method A. It should be noted that in the numerical analysis, more accurate mechanical properties and refined meshes could make the computation results closer to the experiment. However, the certain error between FEM and experiment is beneficial to improving the design allowable value of composite structure and improve the safety factor.
In summary, the modified three-dimensional progressive damage model considering
Research on degradation model versatility
Another impact event is taken to verify the versatility of the modified damage evolution model in this article.
40
The dimension parameters of the Graphite/epoxy composite laminate with the stacking sequence of


Finite element model subjected to low velocity impact in Kim et al. 40

Mechanical behavior of FEM and experiment under different impact energies: (a) RF-T curves of 5 J impact energy,(b) RF-T curves of 15 J impact energy, (c) RF-U curves of 5 J impact energy, and (d) RF-U curves of 15 J impact energy.
Sensitivity study on cohesive element thickness
In this part, the sensitivity of cohesive element thickness is analyzed to study its influence on energy absorption and peak force. Four groups of values (0.001, 0.004, 0.0075, 0.01 mm) under the 14.7 J impact are applied to obtain the changes of energy absorption and peak force, shown in Figure 12. It is found that when the cohesive element thickness is 0.004 mm, the values of absorbed energy is the largest, but the peak force is the smallest. As the cohesive element thickness increases, the energy absorption value and peak force of the composite laminate begin to stabilize. However, the excessively large thickness of the cohesive element not only causes the element to warpage during the calculation process, but also increases the size of the finite element model, making the analysis results of no reference significance. Therefore, according to the analysis results of this paper, the thickness of the cohesive element in the finite element model should be adopted between 0.001 and 0.0075 mm.

The absorbed energy and peak force of cohesive elements with four thicknesses under the impact energy of 14.7 J.
Conclusion
This paper establishes a finite element model which can simulate the dynamic impact mechanics and damage development of composite laminates induced by low-velocity impact. The damage modes and damage initiation are judged by the 3D Hashin criterion. The stiffness loss of composite materials is described by the proposed modified damage evolution model which includes the
Compared with experimental results, the errors of the peak force predicted by proposed method under three impact energies are 4.7%, 6.9%, and 3.2%, while the errors of the original model are 5.1%, 10.4%, and 7.7%, respectively. Therefore, the proposed method is more suitable for simulating the mechanical behavior of composite laminates under low-velocity impact. The positive influence of considering
The limitations of 3D Hashin criterion to compute the matrix damage has been well overcome by the modified damage evolution model, which reduces the area of the tiny hollowed region and improves the application and prediction accuracy of the 3D Hashin criterion.
The delamination area predicted by the modified progress damage model is larger than the experiment results, which indicates that the finite element model based on modified progressive damage model with
A sensitivity study on cohesive element thickness shows that the absorbed energy and peak force will tend to be stable as the thickness increases, but considering the actual size of structure, the recommended cohesive element thickness should be adopted between 0.001 and 0.0075 mm.
In summary, the modified progressive damage model has good versatility and can be directly applied to analyze the damage mechanics and mechanical behavior of composite laminates with other stacking sequences induced by impact load.
Footnotes
Handling Editor: Chenhui Liang
Declaration of conflicting interests
The author(s) declared no potential conflicts of interest with respect to the research, authorship, and/or publication of this article.
Funding
The author(s) disclosed receipt of the following financial support for the research, authorship, and/or publication of this article: This work has been supported by the National Natural Science Foundation of China (11702046), Major Theme Project of Chongqing Technology Innovation and Application Development (cstc2019jscx-zdztzx0028, cstc2019j scx-zdztzx0020).