
Abstract
In this study, the GA-CNN model is proposed to realize the automatic recognition of rolling bearing running state. Firstly, to avoid the over-fitting and gradient dispersion in the training process of the CNN model, the BN layer and Dropout technology are introduced into the LeNet-5 model. Secondly, to obtain the automatic selection of hyperparameters in CNN model, a method of hyperparameter selection combined with genetic algorithm (GA) is proposed. In the proposed method, each hyperparameter is encoded as a chromosome, and each hyperparameter has a mapping relationship with the corresponding gene position on the chromosome. After the process of chromosome selection, crossover and variation, the fitness value is calculated to present the superiority of the current chromosome. The chromosomes with high fitness values are more likely to be selected in the next genetic iteration, that is, the optimal hyperparameters of the CNN model are obtained. Then, vibration signals from CWRU are used for the time-frequency analysis, and the obtained time-frequency image set is used to train and test the proposed GA-CNN model, and the accuracy of the proposed model can reach 99.85% on average, and the training speed is four times faster than the model LeNet-5. Finally, the result of the experiment on the laboratory test platform The experimental results confirm the superiority of the method and the transplantability of the optimization model.
Keywords
Introduction
Rolling bearing is an important part of modern mechanical equipment, and its running state directly affects the working performance of equipment. Statistically, about 30% of the failures of rotating machinery and equipment are caused by rolling bearings. Therefore, fault diagnosis of rolling bearing is of great significance for industrial production.
At present, common fault diagnosis methods include vibration analysis method, thermal analysis method, and acoustic signal analysis method, 1 etc. The thermal analysis method is often expensive and has poor timeliness. The acoustic signal analysis method can complete the diagnosis task quickly and at low cost. However, this method is greatly affected by environmental factors, and is suitable for fault diagnosis tasks in a specific environment. Unlike the above two analysis methods, the vibration analysis method can be analyzed in time domain,2–4 frequency domain, or time-frequency domain.5–8 The vibration signal contains more equipment status information. Especially for bearing components, the early characteristic information of high frequency region is very important for equipment diagnosis and maintenance, and the early fault main characteristic information can be obtained from the vibration signal. Therefore, this paper adopts the vibration analysis method to diagnose the bearing faults.
With the development of deep learning algorithms, it is feasible to perform fault diagnosis by the network model. The industrial field fault data can be collected and input into the network model; after the model training, the efficiency of fault diagnosis in the model will be greatly improved. In contrast, traditional diagnostic techniques have some shortcomings in both accuracy and speed of diagnosis. In recent years, deep learning has developed rapidly in the field of speech recognition 9 and image recognition 10 by unique feature extraction methods.11–15 Xiao et al. converted the original time-domain signals into two-dimensional images directly. After gray processing, these images were input into CNN combined with the AMSGrad algorithm to improve the accuracy of rolling bearing fault recognition. 16 Yuan et al. proposed a rolling bearing fault diagnosis method based on wavelet time-frequency diagram and CNN. In this method, the wavelet time-frequency diagram is input into the improved CNN model to identify the running state of rolling bearings. 17
Kumar et al. 18 proposed a novel convolutional neural network (NCNN), which added the sparsity to the original cost function of convolutional neural network, and a new triangular cross-entropy function was proposed to calculate the sparsity cost, so as to realize the effective identification of bearing defects under the condition of small samples. Zhang et al. train the CNN model by using the two-dimensional time-frequency image set obtained from PWVD analysis. The results showed that the proposed model can identify and classify 15 running states of rolling bearings. However, during the establishment of the CNN model, the optimal parameters are selected through six groups of different numbers of convolution kernels. That is to say, manual selection and adjustment of parameters is a troublesome and time-consuming process. 19
Through the above multiple cases, it can be proved that CNN has high research value in the field of fault recognition, but it also has inherent shortcomings. The structure of the CNN model is complex, and over-fitting and gradient dispersion are prone to occur during the training process. Besides, there are many parameters in the model, and the parameter selection and adjustment highly rely on manual experience. Therefore, it is of practical significance to propose an adaptive optimization method for CNN hyperparameters. To this end, Li 20 proposed a method for CNN hyperparameter optimization based on particle swarm optimization algorithm.
In this study, based on the preprocessing of vibration signals, a genetic algorithm (GA)-based CNN hyperparameter optimization method is proposed to realize the intelligent fault diagnosis of rolling bearings. The proposed GA-CNN model is also verified by sample sets, the results show that this model has high accuracy and training speed. This method can effectively find the best parameters of the model and deploy them on the intelligent operation and maintenance platform. With the accumulation of industrial field data, the network model is continuously improved to achieve an accurate diagnosis.
Optimization of CNN structure
Convolutional neural network
The convolutional neural network (CNN) is a multi-layer neural network with advantages of local connection and weight sharing. Its incomplete connection and weight sharing network structure reduces the complexity of the network model and reduces the number of weights. Typical convolutional neural networks are usually composed of different numbers of convolutional layers, pooling layers, full connection layers, and other layers.
The core of the CNN convolution layer is the convolution kernel, and the principle is the same as the filter. The mathematical model of convolution operation is as follows:

where
The pooling layer of the CNN is also known as the down-sampling layer, which is used to reduce the dimension of feature graph. The mathematical model of pooling operation is as follows:

where
The CNN full connection layer classifies the extracted features and expands the output of the pooling layer of the previous layer as a one-dimensional vector. The mathematical model of full connection operation is as follows:

where
Optimization of model structure
There are many classical models of convolutional neural networks. From the LeNet-5, AlexNet, VGGNet, and ResNet, the number and complexity of network layers increase with the increasing demand for feature extraction capability. In addition, due to the limited amount of data, over-fitting and gradient dispersion are prone to occur in the training process of the CNN model. To this end, the overlapping sampling method is used, and the batch normalization (BN) layer and Dropout processing technology are introduced in this study to avoid the above problems.
The addition of the BN layer can effectively prevent gradient dispersion and gradient explosion, and greatly improve the training speed of network.
During each CNN training, Dropout processing can make some neurons fail randomly, increasing the diversity of the model. As a result, the over-fitting of the CNN model is effectively avoided and the robustness is improved. The visualization of Dropout technology is shown in Figure 1. Each circle represents a neuron, where the red dotted line is inactivated and the dotted arrow represents there is no nerve conduction.

Dropout technology visualization.
The hidden layer structure of the optimized CNN model is C1-BN2-S3-C4-BN5-S6-F7(Dropout)-F8(Dropout). That is to say, a BN layer is added after each convolutional layer and Dropout processing is performed after the full connection layer. Figure 2 shows the optimized CNN structure.
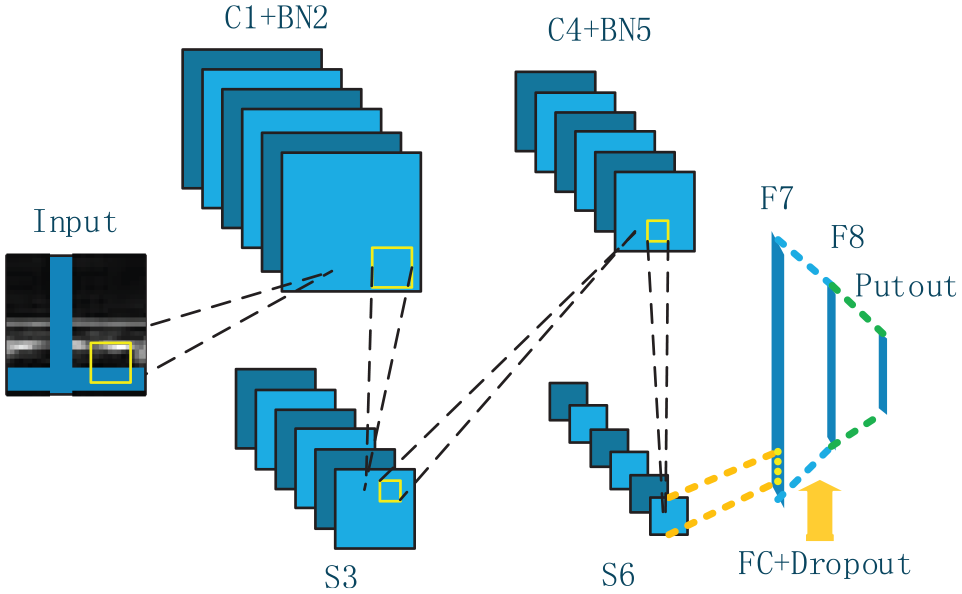
Optimization of the CNN structure.
CNN hyperparameter optimization based on GA
Genetic algorithm
Genetic Algorithm (GA) is a random search method that simulates natural selection and population genetic. Just like the survival of the fittest rule in nature, GA inherits high-quality genes to offspring through eliminating inferior genes and inheriting high-quality genes, so as to obtain the optimal offspring genes repeatedly. The algorithm has good global optimization performance.
Compared with manual parameter selection and adjustment, genetic algorithm is faster and more accurate. The GA model can be described as follow:

where
Hyperparameters optimization process of CNN
Before the CNN hyper-parameter optimization, hyperparameters are encoded in a form similar to human chromosomes by binary coding. In other words, each hyperparameter has a mapping relationship with the corresponding gene loci on the chromosome. Each chromosome represents a CNN hyperparameter combination. After many times of genetic evolution, the chromosome containing the optimal gene is obtained
The hyperparameter optimization process based on GA is as follows:
Step 1: Population initialization. A random value is generated as the initial value within the value range of all hyperparameters that need to be optimized. When all hyperparameters are searched in this operation, the population initialization is finished.
Step 2: Population evaluation. In this step, the fitness value of the individuals in the population to the objective function is calculated.
In this study, population evaluation refers to the accuracy of the bearing state recognition of the CNN model constructed by the combination of different hyperparameters. The fitness value is defined as follows:

where f is the target function; Fit is the fitness value corresponding to an individual;
Step 3: Operator selection. In this step, the common roulette model is adopted, and individuals with higher fitness values in the population are more likely to be selected. The probability of being selected is marked as Pn, and the selection operator can be expressed as follows:

where M is the quantity of population;
Step 4: Operator crossover. The individuals selected in the previous step are crossed according to a specific operator probability Pc to determine whether the chromosomes cross and generate new individuals.
Step 5: Operator mutation. Each chromosome is randomly mutated at the same gene locus according to the preset mutation probability Pm.
Step 6: Update chromosomes. The fitness value of the new chromosome is recalculated.
Step 7: Stop judging. In this step, whether evolution generation T reaches the preset maximum is judged. If not, return to Step 3 and enter the next iteration.
Step 8: The optimal hyperparameter solution is obtained, and the CNN model can be built with optimized hyperparameters. The validity of the model can be verified by the follow-up experiment.
The flow of the genetic algorithm is shown in Figure 3.

Genetic algorithm flow chart.
Recognition steps of rolling bearing running state
Figure 4 shows the identification method of the rolling bearing running state based on the GA-CNN model.
Step 1: Classify the running states of rolling bearings and obtain the original vibration signal data under different running states.
Step 2: Adopt the time-frequency analysis method of short-time Fourier Transform (STFT) to establish a time-frequency graph sample set, including a training set and a test set.
Step 3: Optimize the structure of the CNN model.
Step 4: Determine the hyperparameters to be optimized in the CNN, and conduct automatic optimization of parameters through the GA algorithm.
Step 5: Build the CNN model with optimized hyperparameters and conduct the CNN model training and testing.
Step 6: Compare with the classical LeNet-5 model and verify the effectiveness of the proposed method.
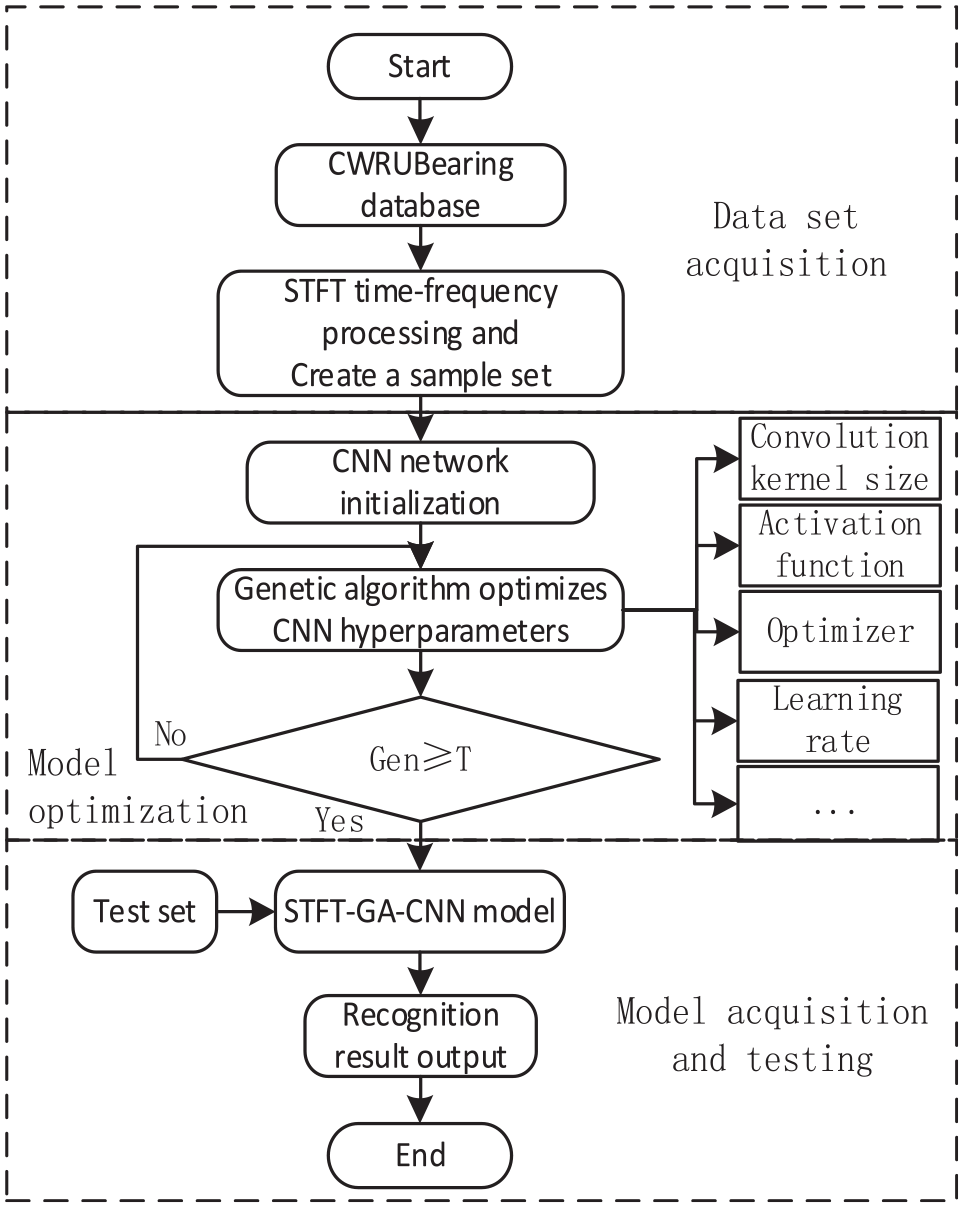
STFT-GA-CNN method flowchart.
Experimental verification
Classification of rolling bearing running state and acquisition of original data
The data from the Bearing Data Center of Case Western Reserve University (CWRU) 21 contains bearing data under multiple operating conditions and various operating conditions, and the amount of data is relatively sufficient, which is very suitable for the state recognition of bearing operating based on deep learning. Therefore, the data sets used in this study are all from the Bearing Data Center of CWRU in the United States. Figure 5 shows the experimental platform The bearing data of the drive end of the platform is selected as experimental data. The bearing model is a deep groove ball bearing SKF6205, the load state is HP1, the motor speed is 1772 r/min, and the sampling frequency of the signal acquisition device is 12 kHz.

CWRU bearing failure test platform.
Due to the limited amount of data in the Bearing Data Center of CWRU, overlapping sampling is adopted in this study to ensure the sample size of model training and test.
The selected data set contains four common operating states of rolling bearings, namely normal condition (NC), inner ring failure (IF), outer ring failure (OF), and rolling element failure (BF). The damage lengths of the three failure states are divided into 0.18, 0.36, and 0.54 mm. In addition, the damage directions of outer ring failure of the bearing are divided into three directions of 6 o’clock, 3 o’clock, and 12 o’clock. Finally, there are 16 types of bearing running states, as shown in Table 1. A total of 300 experimental samples are selected for each state, each sample is composed of 1024 data points, and the sample set is divided into the training set and the test set at a ratio of 5:1.
Running states of bearing.

Establishment of rolling bearing data set
In this study, the Short-Time Fourier transform (STFT) analysis method is adopted in the production method of the time-frequency image sample set. The basic idea of the STFT is to segment the non-stationary signal into countless short-time sequences, and then perform each segment of the time sequence. The Fourier transform formula is as follows:

where
The generated time-frequency diagram is trimmed to remove the coordinate information and retain only time-frequency diagram information. Due to the limited space, the time-frequency images of four types of bearing running states are displayed corresponding to NC, IF, OF, and BF states, as shown in Figure 6(a)–(d). Although the color image has richer feature information, a large amount of data processing is also required. Therefore, the image is grayed, and the imresize function is used to reconstruct the image size into a 28 × 28 gray-scale image. Eventually, the final sample of the time-frequency image sample set is obtained, as shown in Figure 7. The original time-frequency images corresponding to NC, IF, OF and BF are shown in Figure 7.

Time-frequency diagram of vibration signal under different conditions of rolling bearing: (a) NC state, (b) IF state, (c) OF state and (d) BF state.

Time-frequency diagram after compression: (a) NC state, (b) IF state, (c) OF state and (d) BF state.
Experimental process and results analysis
Setting of experimental parameters
In the genetic algorithm, the population number M is 50, the genetic evolution generation number T is 6, the crossover probability Pc is 0.3, and the mutation probability Pm is 0.1.
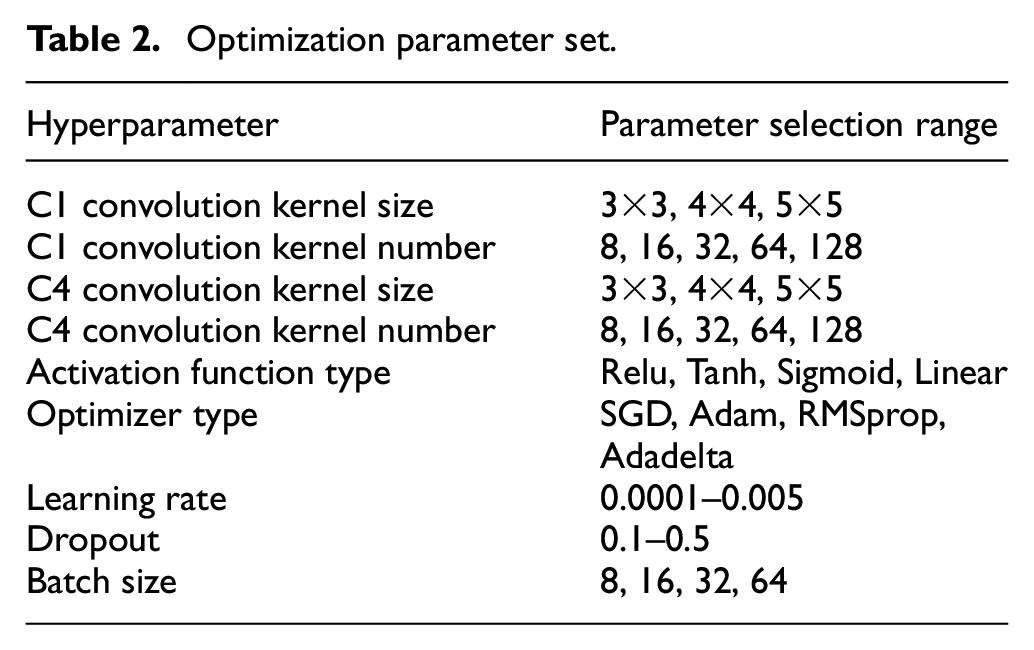
Table 2 shows the CNN hyperparameters to be optimized and their searching range. The size and number of convolution kernels have a direct impact on the performance of the CNN model. At the same time, the activation function type of the activation layer, the type of the optimizer, the size of the learning rate, the size of the batch, and the loss rate of the dropout layer are all important to the training progress of the CNN model. Therefore, the above hyperparameters are selected to be optimized. The searching range of each hyperparameter is expanded as far as possible on the basis of mainstream settings to seek the optimal solution.
Optimization parameter set.
Analysis of results
After the genetic algorithm optimization experiment, the obtained data are shown in Table 3. The top three hyperparameter combinations with the highest identification accuracy is listed as follows.
Hyperparameter combinations with highest accuracy.

There are three GA-CNN models combined with hyperparameters achieving high recognition accuracy for rolling bearing running state. It indicates that the proposed method is effective for the automatic selection of model hyperparameters. As shown in Table 3, the convolutional kernel of 6 × 6 is not selected for the top three models, because the large size of the convolutional kernel can induce noise and reduce the accuracy of classification. In addition, two activation functions with better performance, Relu and Tanh, are screened out through hyperparameter optimization. It can be seen that the first two hyperparameter combinations with the highest recognition accuracy are the results of the sixth generation of evolution, and the accuracy of the CNN model recognition will be improved with the increasing number of evolution generations.
As shown in Figure 8, the abscissa is the number of population evolution generations, and the ordinate is the recognition accuracy. The blue prismatic data points represent the average recognition accuracy of the current evolutionary generation, and the red square data points represent the highest recognition accuracy of the current evolutionary generation. It can be seen that with the continuous evolution of the population, the average recognition accuracy of the CNN model increases greatly. It indicates that the accuracy of the CNN model recognition will be improved with the increasing number of evolution generations.

Recognition accuracy curve.
Analysis of comparative experiment results
To verify the effectiveness of the proposed method, the performance of the GA-CNN model is compared with that of the LeNet-5 model. The network parameters of both models are set as follows: The maximum number of iterations is set to 50, BatchSize to 8, the learning rate to 0.001, and Dropout to 0.3. As shown in Figure 9, the blue diamond markers and curves represent the recognition accuracy of the training set and test set of the GA-CNN model; the red square markers and curves represent the recognition accuracy of the training set and test set of the LeNet model, respectively. Similar to the markings in Figures 9 and 10 represents the change curve of the loss function during the training and testing of the two models. Through the comparison, it can be seen that the proposed GA-CNN model has higher recognition accuracy and faster loss function convergence than those of the LeNet-5 model.

Recognition accuracy curve.

Loss curve.
Figure 11 shows the confusion matrix plot for the experimental test set. The predicted fault type label is taken as the abscissa, and the actual fault type label is taken as the ordinate.

Test set classification results.
It can be seen from Figure 11 that the identification accuracy of the bearing state of label 9 is 94% (another 6% probability of being mistaken as label 13), and the identification accuracy of the other bearing states is 100%. After 10 experiments, the average recognition accuracy is 99.85%. Therefore, the proposed method for running state identification of rolling bearings is verified to be extremely effective.
Visualization of training process
To intuitively observe the training effect of each network layer of the GA-CNN model, the T-distributed stochastic neighborhood embedding (T-SNE) method is used to reduce the dimension of the features of some network layers and visualize them in the form of three-dimensional scatter plots, as shown in Figure 12.

T-SNE visualization of input layers and output layers.
Due to the limited space, the dimensionality reduction and visualization processing on the features of input layers, convolutional layers, and output layers are performed, as shown in Figure 12(a)–(d). The three coordinate axes respectively represent the first three dimensions after dimension reduction of features extracted from the current network layer. Each point represents a sample, and each color represents a bearing operating state, a total of 16 operating states. The specific correspondence between states and colors is shown in Figure 12(d).
Through the dimensionality reduction and the visualization processing of the input layer features, it can be seen that many sample points representing different bearing states overlap. resulting in the unidentifiable operating states, as shown in Figure 12(a).
After the dimensionality reduction and the visualization processing of features of convolutional layers, compared with the input layer, the clustering effect of the sample points in the same state becomes more obvious, as shown in Figure 12(b). It indicates that after the feature extraction of the convolutional layer, the distinguishability of the features has been further enhanced.
Finally, the above method is also used for the output layer. Intuitively, sample points of different bearing states have a higher degree of discrimination, and there are no overlapping sample points. It suggests that the GA-CNN network model has a very good effect on bearing state recognition. As shown in Figure 12(c), the proposed method proposed in this study can effectively extract the feature information in the image and accurately identify the running state of the rolling bearing.
Model transferability verification
In order to verify the superiority of the method and the portability of the optimization model in this paper, the mechanical transmission platform built by our team will be used for verification.
Bearings of different faults can be replaced on this platform to measure vibration signals of rolling bearings in different fault states (the bearing model is N205, which is different from the bearing SKF6205 in the Case Western Reserve University dataset). Three fault states are artificially created plus normal working state, so four kinds of bearing state data are collected through data acquisition system. The data acquisition system consists of NI cDAQ-9189 data acquisition card, NI-9234 sound and vibration input module, YD-186 piezoelectric sensor installed in the horizontal and vertical directions of the bearing housing. The connection of the test platform and the three kinds of fault bearing are shown in Figures 13–15:

Field connection diagram of the test platform.

Installation of vibration sensor.

Different types of faults.
Firstly, four kinds of bearing state data are collected through the data acquisition system, including normal state, inner ring fault state, outer ring fault state, and rolling element fault state. Using the same data processing method as before in this paper, the vibration signals are converted into time-frequency image, and divided into training set and test set. Since this is a process of model migration, the parameters of the convolutional layer are locked, only the parameters of the fully connected layer are trained. This method can greatly speed up the training speed of the model while maintaining good recognition performance. Finally, the test set is input into the model, and the test set confusion matrix is obtained and shown as Figure 16. The recognition accuracy of the four running states can reach 100%.

Classification results of test set.
Conclusions
In this study, the structure of the classical CNN model is optimized by adding BN layers and Dropout technology to avoid over-fitting and improve the network training speed by at least four times.
Genetic algorithm is used to automatically optimize 7 kinds of parameters in the CNN model, and the optimization range is the mainstream setting of corresponding parameters. This method can search the optimal hyperparameter more quickly and accurately, which greatly reduces the difficulty of CNN model design.
The CNN model constructed by the optimized hyperparameters can be used to identify the running state of rolling bearings. The average recognition accuracy of the proposed CNN model can reach 99.85%, and its training speed is four times faster than the classical CNN model LeNet-5.
The transferability of the model is verified, and the accuracy of bearing state recognition reaches 100%, which verifies that the optimized model has a good transferability. In the follow-up research work, our team will continue the further study of transfer learning and try to apply the proposed method to the fault diagnosis of gearboxes, motors, etc.
A hyperparameter optimization method of deep learning model applied to bearing fault diagnosis is proposed, which can find the best parameters of the model effectively. In a specific application environment, the trained network model can be deployed on the intelligent cloud platform to accurately diagnose the current running status of the device.
Footnotes
Handling editor: Chenhui Liang
Declaration of conflicting interests
The author(s) declared no potential conflicts of interest with respect to the research, authorship, and/or publication of this article.
Funding
The author(s) disclosed receipt of the following financial support for the research, authorship, and/or publication of this article: This work was financially supported by Basic Scientific Research project of Universities in Liaoning Province (LJKZ0352).