
Abstract
This paper describes three-dimensional unsteady simulations of sand–water flow within a turbine passage. Sand abrasion of a movable guide vane made from ZG06Cr13Ni4Mo is tested before and after tungsten carbide spray-coating. ZG06Cr13Ni4Mo forms medium- and high-strength stainless steel castings for engineering structures. Different sand particle sizes produce different wear forms on the guide vane. For 0.4-mm sediment particles, the guide vane head is more seriously worn by impact; for 0.058-mm sediment particles, the guide vane tail is more seriously worn by sediment scouring. Spray-coating the guide vane with tungsten carbide produces significant anti-sand-wear performance. Before tungsten carbide spraying, the total guide vane wear at the maximum position reached 45 μm after 90 h of testing, but after spray-coating, the guide vane wear at the maximum position was only 2.6 μm after 136 h of testing. Sand abrasion test results before and after tungsten carbide treatment are used to derive a calculation formula that provides a basis for anti-silt-abrasion hydraulic turbine design and operation. The movable guide vane’s life expectancy in a power plant was estimated. Before spraying, the guide vane had to be replaced after 22.7 months of operation at P = 11.4 MW, but it operated for 44.2 months after spray-coating.
Introduction
Silt abrasion is a common problem in hydropower stations located on silt-laden rivers. After long periods of silt abrasion, the surface materials of turbine components that are exposed to the flow will be damaged to varying degrees, thus reducing both the efficiency and the stability of the turbine. Wear of the turbine guide vanes for power stations in sediment-laden rivers is a serious problem and has been the subject of considerable research. Kang et al., 1 Thapa et al. 2 and Zhao et al. 3 analyzed the internal flow characteristics, the particle trajectories and the wall impact characteristics of Francis turbines using numerical simulations and also discussed the causes of the internal wear patterns in the turbines. Comparison of the calculation results with the actual wear situation allowed the factors that influence the wear of the water turbine guide vanes to be identified and an improved design method to reduce the wear was proposed. Gautam et al. 4 presented a case study of an Indian power plant containing a low-specific-speed Francis turbine. Numerical analysis of the flow inside the turbine was performed to investigate the causes of the various erosion patterns that occurred in the turbine components. Erosion of the guide vanes and the runner blades was mainly considered because of the complex flow phenomena that occurred around these areas. Leakage flow through the guide vane gap was found to be the main cause of erosion at the guide vane inlet. Chen et al. 5 studied the guide vanes in a mixed-flow hydraulic turbine at the Dongshuixia hydropower station. By considering the large eccentric shaft structure of the guide vane, numerical calculations using the large eddy simulation (LES) and discrete phase models (DPMs) were performed to study the erosion characteristics and mechanisms of the guide vane and its head cover end surfaces, along with the flow mechanism behind the guide vane, the mechanism causing undesirable erosion behind the shaft, and the law describing the effects of the turbulence integration scale, the turbulent kinetic energy, and the turbulence angle on the erosion. Shrestha et al. 6 discussed the sediment properties and their effects on erosion. Numerical analysis was performed to study the erosion of a Francis turbine by considering the synergistic effects of the sediment parameters (i.e. the sediment shape, size, concentration, hardness, and velocity) to predict the areas of the Francis turbine that were most vulnerable to sediment erosion. Han et al. 7 and Rakibuzzaman et al. 8 studied the sand wear characteristics of a movable guide vane in a Francis turbine using both the k-ε turbulence model and a DPM. The main wear appeared in the head and tail areas, and this was consistent with the test wear results. Kumar et al. 9 combined computational fluid dynamics (CFD) with experimental analysis to study the sand abrasion characteristics of turbine guide vanes made from different materials, and identified the materials with the best wear resistance. Han et al. 10 decomposed and reconstructed the tip leakage vortex (TLV) of a mixed flow pump operating as a turbine in pump mode using dynamic mode decomposition (DMD). The flow field was solved using a k-ω shear stress transport turbulence model and the solution was verified by experimental data. These results show that the DMD approach can decompose the dominant frequency of TLV evolution and its harmonic frequencies accurately. Liu et al. 11 proposed an iterative flow-based method to determine the best efficiency point in turbine mode based on a theoretical model. An argumentative analysis was performed using three centrifugal pumps and the results predicted by the theoretical model were compared with corresponding experimental measurements and numerical simulations. The predicted average changes in head and efficiency were found to be 6.12% and 5.51% for the pump and 5.40% and 3.63% for the turbine, respectively, which is sufficiently accurate for engineering practice. Choi et al., 12 Rajkarnikar et al. 13 and Philippe et al. 14 studied optimal design of the turbine guide vanes in an attempt to improve their wear resistance. Because of the serious wear that occurs in water turbine guide vanes, tungsten carbide (a derivative of refractory metal tungsten) has been applied to the vanes to enhance their rigidity and corrosion resistance. In recent years, spraying of tungsten carbide onto the guide vanes has been receiving increasing attention. Wang et al. 15 conducted cavitation and abrasion tests on four materials and compared the resulting wear characteristics. Their results showed that the hardness and abrasion resistance of the materials that were coated with tungsten carbide were higher than those of the other materials. Zhang et al. 16 analyzed the mechanism of abrasion damage caused by the flow parts of a turbine and clarified the representative technical processes for three coating types. They analyzed the advantages and disadvantages of these coatings and concluded that tungsten carbide provided the best abrasion prevention performance. In addition, Wang et al., 17 Guo et al. 18 and Agode et al. 19 studied the spraying process for and the anti-abrasion performance of tungsten carbide. Liu et al. 20 and Xiao et al. 21 have also presented related theoretical and experimental proofs for use in the design optimization of hydraulic turbines and multiphase pumps.
The studies described above have considered the turbine sediment wear problem from different viewpoints, e.g. by studying the wear law for movable guide vanes and blades via numerical simulation analysis, studying the wear law from a sediment particle size perspective, study of sediment wear prevention from the perspective of the materials of the overflow components, and abrasion prevention through optimized design of hydraulic turbines and multiple pumps. Research based on simulation technology has reached maturity, but there is a current lack of experimental research on the sediment wear of turbine overflow components because it would require considerable time and money to construct a test model machine according to the characteristics of a power station turbine; additionally, the internal flow of such a turbine is highly complex and thus it would be difficult to control its accuracy during testing. Therefore, in this paper, a winding sub-test bench design is used to study the wear behavior of a movable guide vane from the Yingxiuwan turbine model HLA982a-LJ-418. This test rig reduces the size of the movable guide vane from the power station to an equivalent scale that can restore the actual internal flow of the turbine based on the principles of similarity of motion and geometry, thus greatly reducing the test costs and time requirements. In this paper, the effects of three particle sizes (0.4 mm, 0.123 mm, and 0.058 mm) on the wear of the movable guide vane are analyzed via numerical simulations and the results are verified experimentally. In addition, a 3D morphometer was used to scan and image the movable guide vane under test while taking the specific form of wear on the guide vane surface into account. To reduce the wear, tungsten carbide was sprayed on the surface of the movable guide vane, the amounts of wear and wear curves were obtained for both materials, and the wear rate equation was fitted. Based on the amount of wear obtained from the testing, the life expectancy of the movable guide vane for use in a power station is estimated, thus providing a basis for scheduling of power station shutdown and maintenance.
Calculation model and meshing
When particle flow simulations are performed, the Euler-Lagrange method is often used, i.e. the Eulerian method is used to solve for the flow field and the Lagrange method is used to track the particle positions.
Numerical simulation method of flow field
The standard k-ε model is mainly applied to turbulence models with well-developed turbulence, particularly to turbulence with high Reynolds numbers. Additionally, the model does not take the effect of molecular viscosity into account. In this study, the flow medium inside the turbine is sand water, and the internal flow is very much sufficiently turbulent flow. The standard k-ε model for solid–liquid two-phase flow is thus used22–24.
Particle tracking model
The DPM formulation can be used to track the solid phases. The control equations for the DPM are given as follows:25–27

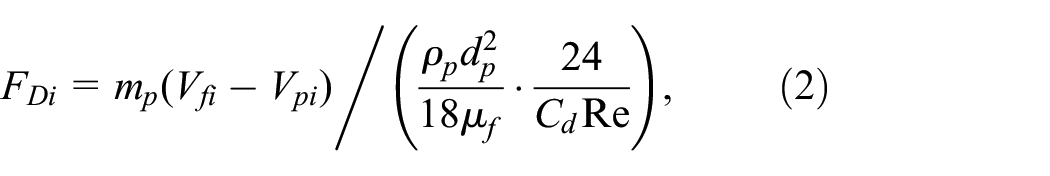
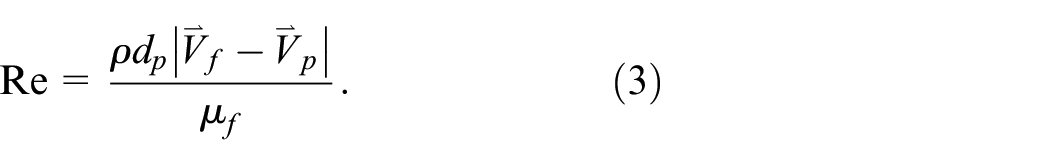
Here, mp is the mass of an individual particle; FD is the drag force; Fp is the pressure gradient force; FVM is the virtual mass force; dp is the sediment particle diameter (m); μf is the liquid (hydro)dynamic viscosity coefficient; CD is the drag coefficient; and Re is the Reynolds number of the sediment particles.
When considering the effect of the sand on the wall surface, a generic generalized wear calculation model can be used to provide a preliminary estimate of the surface wear on the guide vane. Therefore, the wear rate used in the numerical simulations is calculated as follows:

where
Meshing
The commercial software UG (Siemens Digital Industries Software) was used for the modeling. The three-dimensional model of the water body in the test section is shown in Figure 1. The commercial software ICEM (Ansys) was used to perform the grid partitioning. The hexahedral structured grid was divided as shown in Figure 2 to perform partial densification of the movable guide vane. During the wear calculation process, the number of grids used affects the amount of wear. Therefore, it was necessary to perform grid independence detection. Five groups of grids were selected to perform the clean water calculation. After the flow field was stabilized, discrete terms were then added for successive calculations. The relationship between the number of grid cells and the wear rate was then obtained, as shown in Figure 3. When the number of meshes increased, the wear rate showed a downward trend. When the number of meshes reached a specific value, the wear rate then tended to stabilize. According to Figure 3, the number of grid cells selected for the calculation was 496,690. The y+ distribution was then obtained through the calculation, as shown in Figure 4. Figure 4 shows that the maximum y+ value does not exceed 52.29, which indicates the reliability of the grid division process. The boundary conditions were determined using the turbine flow conditions under a load of P=11.8 MW (35.5% guide vane opening). The inlet boundary condition was set at a speed of 3.689 m/s, and the speed of the discrete term was set to be equal to the inlet water flow speed. During the test operation, the outlet pressure was determined based on the average pressure of the pressure gauge at the outlet. The outlet boundary was set to be a pressure outlet at a pressure of 14,700 Pa. The wall was set to be a nonslip solid boundary, and the discrete term was set to be the contact mode of the solid boundary. The particle size distribution of the measured sediment particles at the power station is as shown in Figure 5. Because the power station is equipped with sand discharge measures, the sediment particles that flow through the turbine are mainly of a size below 0.2 mm, but larger sediment particles will pass through occasionally. In the simulations, we used sediment diameters of 0.058 mm, 0.123 mm, and 0.4 mm, based on the consideration that the size of the majority of the sediment particles that flow through the turbine is less than 0.2 mm; according to Figure 5, selection of a sediment particle size below 0.2 mm accounts for approximately 15% and 40% of the total number of sediment particles based on size, i.e. 0.058 mm and 0.123 mm, respectively. In addition, sediment particles with sizes above 0.2 mm must also be considered because the sand discharge measures cannot guarantee complete interception of sediment particles sized above 0.2 mm; therefore the sediment particle size of 0.4 mm, which accounts for approximately 55% of the total number of sediment particles based on size, was selected.

3D model of the test bed.

Grid division of the test bench.

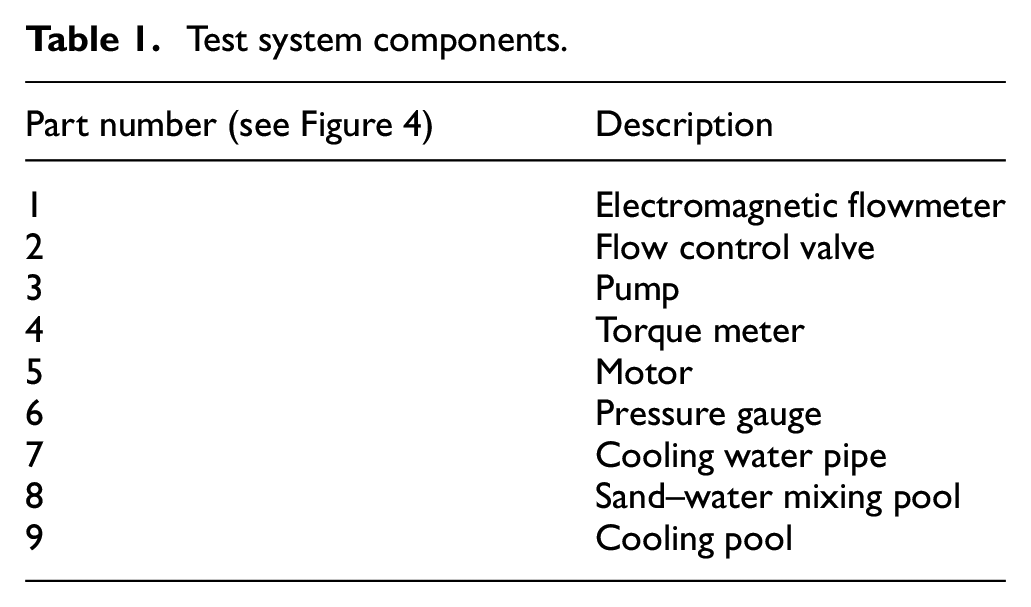
Grid independence verification results. The numbered items of test equipment are listed in Table 1.
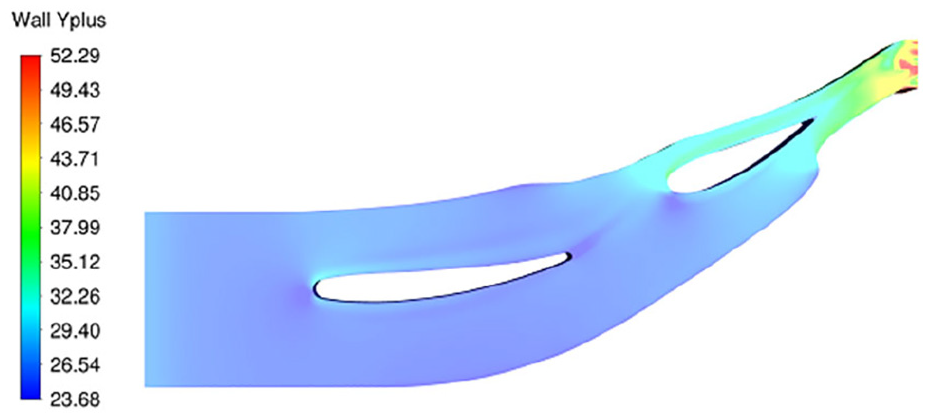
Distribution of y+.

Particle size distribution of the sediment.
Solution settings
By performing steady-state simulations of the test bench, the average velocity of the sediment particles was determined to be 7.65 m/s and the total test bench flow channel length was 0.93 m. The time required for a single sediment particle to travel from the inlet section to the outlet section of the test bench was found to be approximately 0.122 s. The total time required for the non-steady-state calculation was set at 1.22 s using a time step of 0.00061 s. The root mean square (RMS) value of the residuals was selected as the convergence criterion calculation result, and the convergence criterion was less than 10−5.
Sediment abrasion test
A sand abrasion test system comprising a cooling system, a power system, a sand–water mixing system, and a test section was constructed as shown in Figure 6. The component numbers shown in Figure 6 are explained in Table 1. The system has a maximum power of 630 kW, a maximum pressure equivalent to a 376-m-high water column, and a maximum flow rate of 482 m3/h. Test sediment samples were collected from the inlet section of the power station. To verify the numerical simulation results, the sediment particles with sizes of 0.058 mm, 0.123 mm and 0.4 mm were screened out using a screening method, with results as shown in Figure 7. The particle size parameters used for the three groups of sediment particles were the values determined by professional testing institutions, as shown in Table 2. The sand-to-water ratio with a sand content of 3.27 kg/m3 (which was the average sand content of the power station for many years) was measured in the laboratory. The wear-resistant material ZG06Cr13Ni4Mo was first developed for a load of P=11.4 MW (35.5% guide vane opening). The flow-around wear test was performed for the three sediment sizes, and was then performed again according to the actual requirements of the power station. The flow-around wear test was performed for the ZG06Cr13Ni4Mo material and for the tungsten carbide after spray-coating. The wear test work section is shown in detail in Figure 8. The lower end surface of the movable guide vane specimen was laser-engraved to ensure that the chordwise wear measurement positions of the specimen before and after testing remained the same, as illustrated in Figure 9.

Schematic diagram of the test bed system.
Test system components.

Physical map of the sizes of the different sediment particles.
Sediment particle size coefficient.


Schematic diagram of the wear test bed.

Laser engraving diagram of the movable guide vane specimen.
Calculation and analysis of test results
Analysis of calculation results
The commercial software FLUENT (Ansys) was used to perform the simulation calculations. The sand–water velocity, the fluid field pressure, the sand particle diameter, and the sand particle wear form in the test bench all have significant effects on the wear of the movable guide vane. Because the velocity flow diagrams and the pressure cloud diagrams for the three sediment grain sizes do not differ significantly, the numerical results for the 0.058-mm sediment grain size were used for the study, and the high-definition water flow line and the pressure cloud diagram for the movable guide vane are shown in Figures 10 and 11, respectively. The trajectories of the various sediment particles are shown in Figure 12. Figure 10 shows that the water velocity on the movable guide vane surface increases gradually from the head toward the tail. This increasing trend occurs because the flow channel section decreases in size continuously, thus forcing the water velocity to increase gradually. Figure 11 shows that the pressure on the front of the movable guide vane is lower than that on the back of the guide vane because the increase in the flow velocity acting on the front causes the pressure to decrease. Figure 12 shows that the head position of the movable guide vane is impacted severely by the sediment particles—the front and rear sides of the guide vane are mostly scoured by the horizontal movement of the sand, particularly near the tail area. Figures 13 and 14 show cloud diagrams for the wear rates at the front and back sides of the guide vane, respectively, for the different sediment particle sizes. The movable guide vane suffers the most severe wear at its head and tail positions. Comparison of the different sediment sizes shows that when dp=0.058 mm, the tail position of the movable guide vane is worn severely. This wear occurs because, when the flow channel section in the rear position decreases in size, the translational erosion of the sand–water mixture that is in contact with the movable guide vane increases, and the high sand–water flow velocity at the tail position thus makes the resulting wear more serious. When dp=0.123 mm, the movable guide vane suffers more severe wear at the front of the tail and at the back of the head because the larger sand particles that hit the head of the movable guide vane have greater potential energy, which results in serious wear at the head position. At the same time, the reduction in the number of sediment particles leads to insignificant translational scouring wear occurring at the tail position. When dp=0.4 mm, the impact wear is most serious at the head position, and the translational scouring wear that occurs at the tail position is less obvious. In addition, in the active guide vane tail position, use of smaller particle sizes leads to smaller relative motion with the water flow, which makes it more difficult to separate the particles from the energy-containing vortex and will not produce an additional turbulent vortex; use of larger particle sizes leads to greater relative motion with the water flow, making it easier to cause separation of the water flow and the sand particles, simultaneously producing greater sources of interference, and will produce an additional turbulent vortex. Because of the small flow channel size at the end of the movable guide vane, particularly at the back of the guide vane, the flow velocity increases, and when the sediment particle size increases, the sediment will then produce a turbulent vortex by deliquescence. Additionally, the wear rate at the tail position increases for sediment particle sizes if dp=0.058 mm and dp=0.123 mm, and the wear rate for dp=0.123 mm is greater than that for dp=0.058 mm, but when dp=0.4 mm, the wear rate at the end of the movable guide vane is less obvious; this is probably because of the large size of the sediment particles, which lead to downward flow and deposition on the bottom of the flow channel.

Velocity flow diagram.

Pressure cloud diagram.
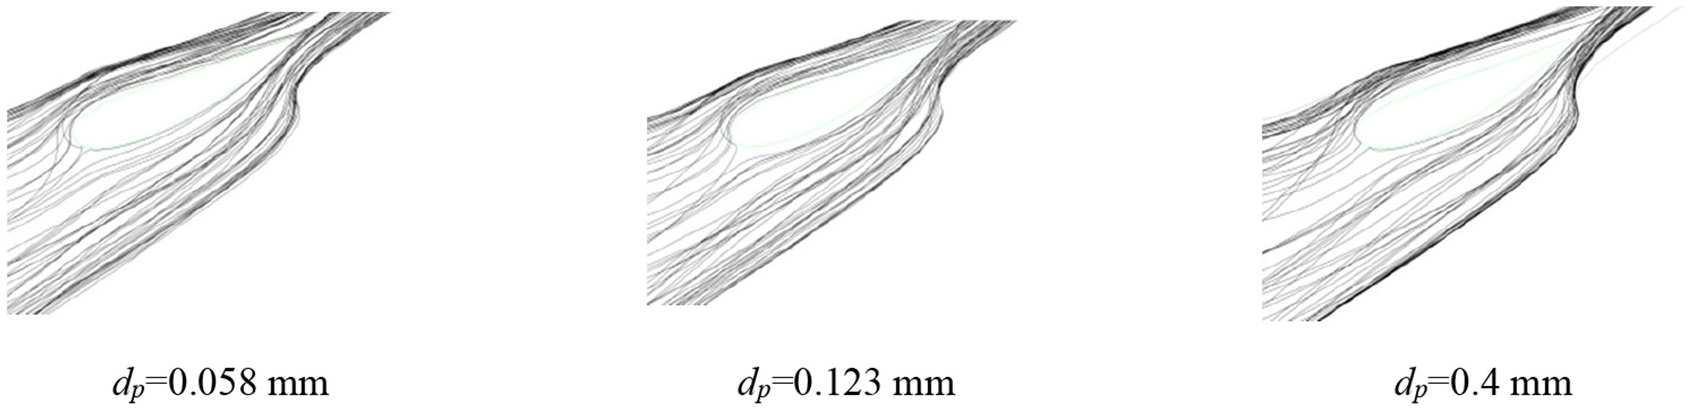
Trajectories of the sediment particles.

Front wear distribution of the movable guide vane.

Back wear distribution of the movable guide vane.
Analysis of test results
Surface wear of movable guide vane
The principle of the 3D profile measurement instrument (white light interferometer) is to measure optical path differences based on the principle of interference to determine the differences between the test piece surface and the selected reference surface. The computer-controlled driving device drives the objective lens to move to ensure that the surface of the sample under test enters the best possible interference position. The interference pattern is then collected using an image sensor, converted into a digital signal and stored in the computer’s memory. The data are analyzed and processed using a recognition algorithm, which allows the surface topography and contour information to be measured with a precision of 0.18 nm, as shown in Figure 15.

White light interference profiler.
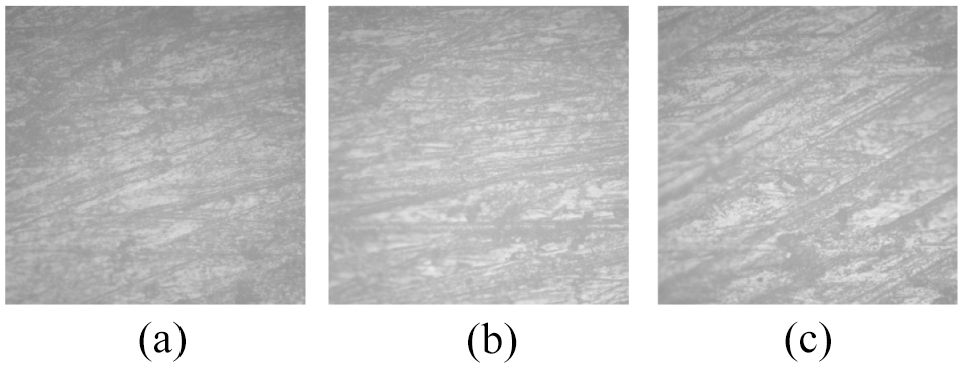
An optical 3D surface profiler with a 50× objective lens was used to examine the wear that occurred at 20%, 50% and 80% of the blade height of the movable guide vane after the corresponding tests; the lens is shown in Figure 16. The results of these measurements are shown in Figures 17 to 28. Figures 17 to 22 show the wear that occurred on the movable guide vane made from the ZG06Cr13Ni4Mo material on the front and back of the head for the three particle sizes. When dp=0.4 mm, a large area comprising wear pits appears on the back of the movable guide vane. This area appears because the sand particles are relatively large in size and thus contain significant potential energy. However, the head position on the back side is in direct contact with the sand, which means that serious collision and wear occurs. In contrast, the front head position of the movable guide vane is in contact with the sand particles. With reduced contact, a lower degree of impact wear occurs, which means that there are fewer wear pits and the wear depth is shallower. When dp=0.123 mm, there are obvious marks caused by the horizontal movement of the sand and scouring on the back of the movable guide vane, and a small number of deep wear pits is also observed. This behavior occurs because the potential energy contained within the sand decreases as the particle size decreases, which means that less wear is produced. Fewer pits are observed, but because of the flowability of the sand particles, obvious translational wear occurs when the sand particles and the water flow contact the movable guide vane together. When dp=0.058 mm, the head position on the back of the movable guide vane shows similar wear conditions, but because of the additional reduction in the sediment particle size, the resulting wear pits are less obvious. When dp=0.123 mm and dp=0.058 mm, the front head position of the movable guide vane is mostly scoured by the horizontal movement of the sand, but the smaller particle size in the dp=0.058 mm case causes the translational scouring and abrasion of the sand particles to be more severe. When dp=0.4 mm, several small wear pits appear on the front and back of the tail of the movable guide vane because fewer sand particles are present than in the other two cases, thereby causing reduced surface translational erosion and abrasion of the movable guide vane. However, because of the narrowing of the flow channel at the tail, some sediment particles will collide with the wall and the surface of the movable guide vane, which results in the appearance of wear pits at the tail. When dp=0.123 mm and dp=0.058 mm, the wear that occurs on the front and back of the movable guide vane shows obvious traces of translational erosion, and smaller wear pits are also apparent. A white light interference profilometer was used to read the surface height at the test position before and after wear, and the difference between the two heights was the wear depth of the surface. Figures 29 and 30 show the wear at fixed points on the head and tail of movable guide blades of different heights. It can be seen from Figures 29 and 30 that when dp=0.4 mm, the wear is most serious at the head on the back of the movable guide vane, while the wear at the tail is more serious when dp=0.058 mm. At the head on the front of the movable guide vane, there is little difference between the wear profiles of the three particle sizes; dp=0.123 mm and dp=0.058 mm show little difference in terms of wear quantity, and dp=0.4mm shows the lowest wear quantity. The test results are consistent with the numerical simulation results, thus verifying the reliability of the numerical simulations.

50× objective lens.
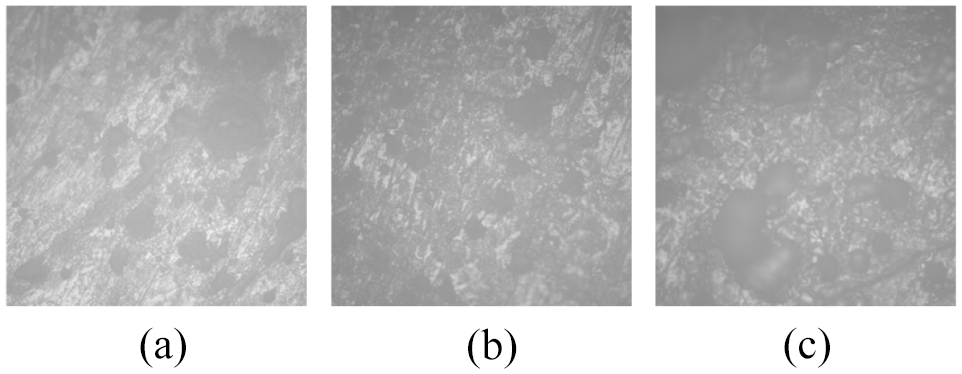
Head wear of the movable guide vane whendp=0.4 mm (back).

Head wear of the movable guide vane whendp=0.4 mm (front).
Head wear of the movable guide vane when dp=0.123 mm (back).

Head wear of the movable guide vane when dp=0.123 mm (front).
Head wear of the movable guide vane when dp=0.058 mm (back).
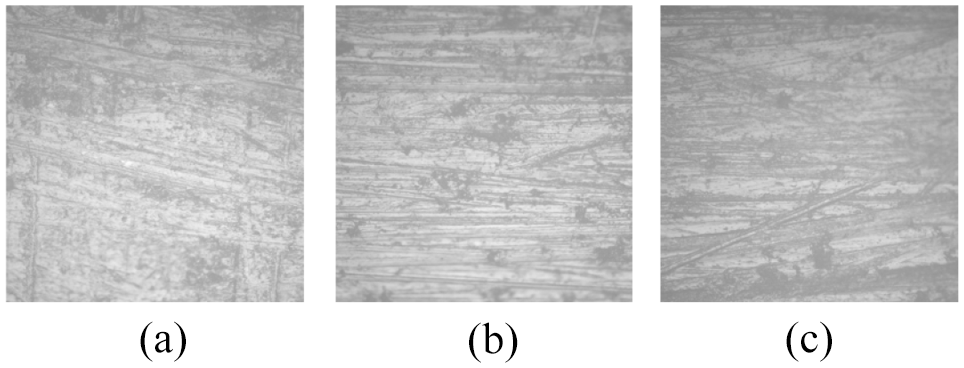
Head wear of the movable guide vane when dp=0.058 mm (front).

Tail wear of the movable guide vane whendp=0.4 mm (back).

Tail wear of the movable guide vane whendp=0.4 mm (front).

Tail wear of the movable guide vane whendp=0.123 mm (back).

Tail wear of the movable guide vane whendp=0.123 mm (front).
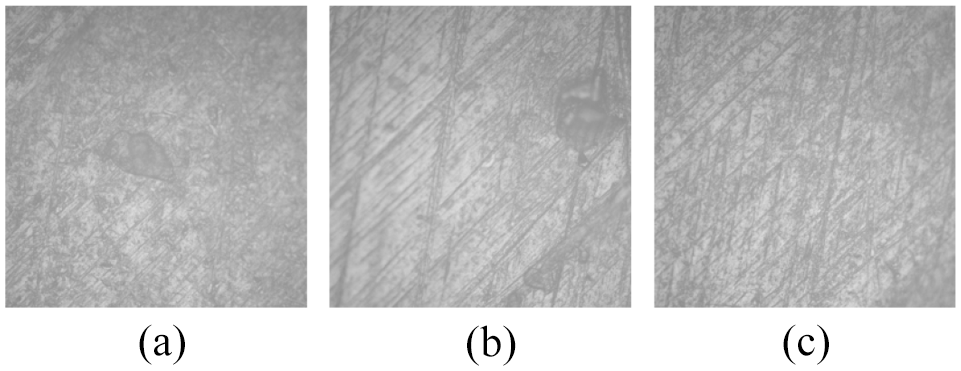
Tail wear of the movable guide vane whendp=0.058 mm (back).

Tail wear of the movable guide vane whendp=0.058 mm (front).

Back wear characteristics.

Frontal wear characteristics.
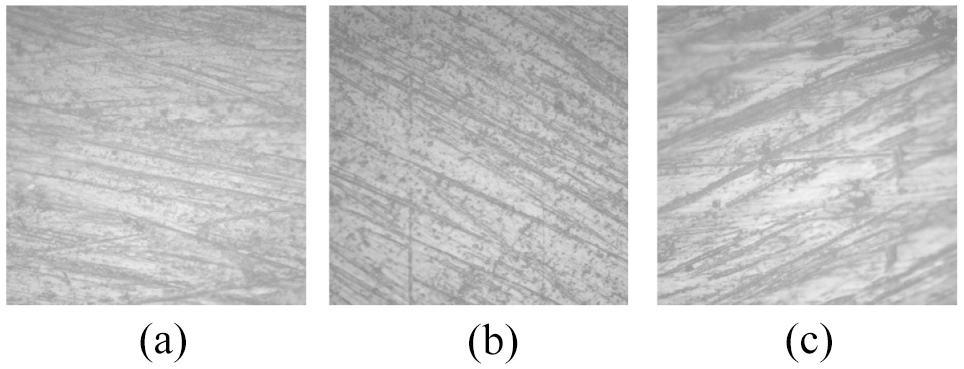
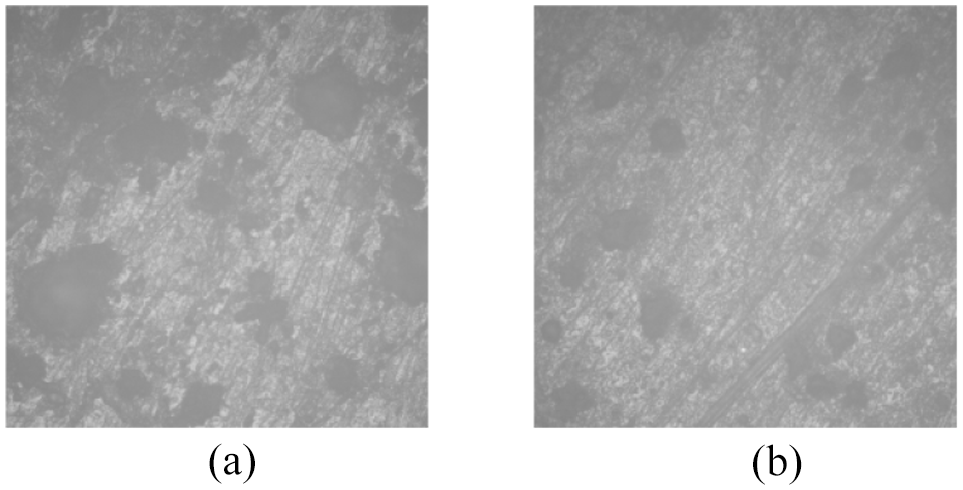
In this study, the surface of the ZG06Cr13Ni4Mo movable guide vane was coated with a 0.3-mm-thick tungsten carbide layer. The chemical composition index of the tungsten carbide powder is presented in Table 3. Wear testing of the ZG06Cr13Ni4Mo material and the spray-coated tungsten carbide was performed according to the actual size distribution of the sand in the power station. The test results are shown in Figures 31 to 34. The results show that the presence of the tungsten carbide coating layer results in fewer wear pits and zero large-scale wear. Obvious sand and water scour marks can be observed at the tail, but no obvious wear is present. Therefore, spray-coating the guide vane with tungsten carbide enhances the movable guide vane’s anti-wear performance.
Chemical composition index of tungsten carbide powder.

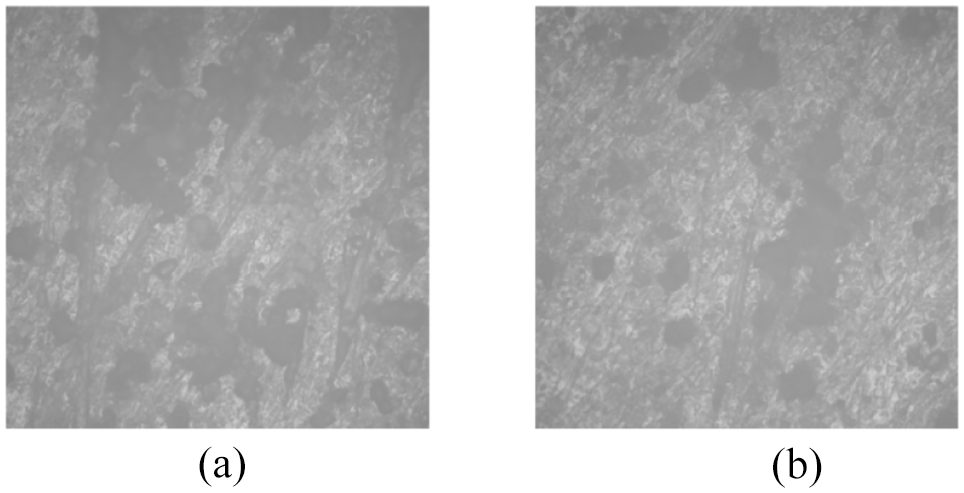
Wear on the back of the ZG06Cr13Ni4Mo guide vane (50% blade height).
Wear on the front of the ZG06Cr13Ni4Mo guide vane (50% blade height).
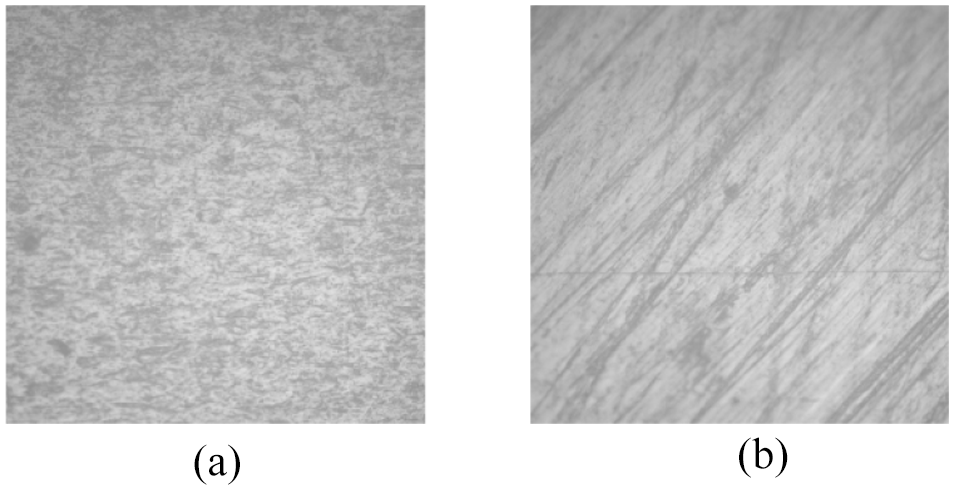
Wear on the back of the tungsten-carbide-sprayed guide vane (50% blade height).
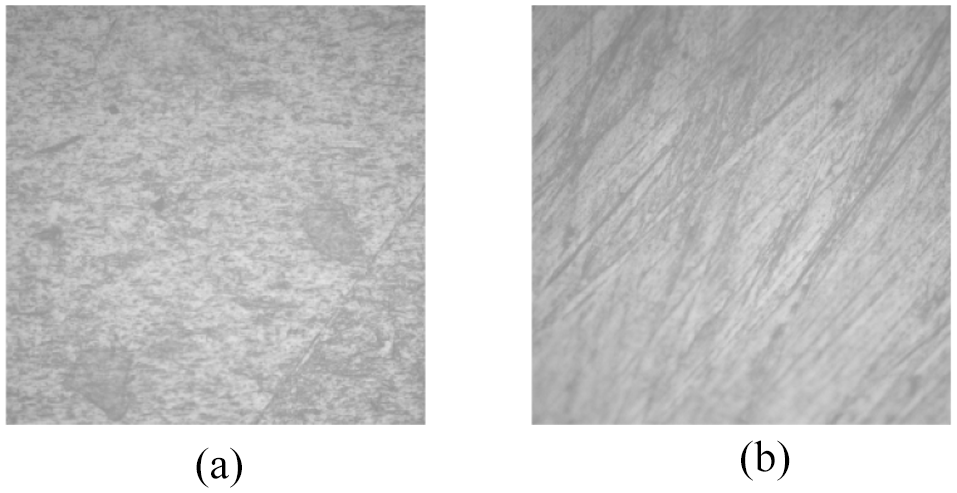
Wear on the front of the tungsten-carbide-sprayed guide vane (50% blade height).
Fitting of sediment wear rate formula
The formula28–30 used to determine the sediment wear rate for the flow parts of a turbine can be written as follows:

where
The distributions of ϕP, W and α on the 50% blade height surface of the conductive vane can be obtained through numerical simulations. By performing CFD post-processing, the x and y velocities were extracted at all points from the 50% blade height to the tail of the movable guide vane. The velocity vector for each notch at the 50% blade height can be obtained according to the velocity triangle principle, and the angle between the velocity vector and the tangent direction of the notch is the angle of incidence of the sand and water: the punch angle function is shown in equation (6). The wear distribution ΔZ at the 50% blade height of an active guide vane can be obtained by performing flow sediment wear tests, with results as shown in Figure 35. The data pertaining to ZG06Cr13Ni4Mo and the tungsten carbide coating are given in Tables 4 and 5, respectively. An error analysis of the measurement results given in Table 4 was performed by selecting five inscribed points at the 50% leaf height of the movable guide vane and then measuring the wear amount five times repeatedly for the error analysis, with results as shown in Table 6; the confidence level for the measurement results was 97%. The results obtained from the wear rate formula for an active guide vane based on the data given in Tables 4 and 5 are presented in Table 7. In addition, because the tungsten carbide coating thickness is only 0.3 mm, it accounts for a very small proportion (tending to zero) of the distance from the surface of the movable guide vane to the test bench side wall; therefore, the 0.3-mm-thick tungsten carbide spray-coating in this test does not have a significant effect on the experimental results.

where vx is the velocity in the x-direction (m/s); vy is the velocity in the y-direction (m/s); and M(x) is the active guide vane airfoil chord length function, which is obtained by fitting of the data points extracted from the active guide leaf design map.

Wear characteristics at 50% blade height.
Wear data for ZG06Cr13Ni4Mo material.

Wear data for tungsten carbide coating.

Error analysis results.

Coefficients of the sediment wear rate formula.

Lifetime prediction of movable guide vane
If the turbine is operated at P=11.4 MW and the sediment content is 3.27 kg/m3, then the total wear of the movable guide vane composed of the ZG06Cr13Ni4Mo material at the maximum wear area can be obtained based on the results after 90 h of testing. In addition, the total wear of the movable guide vane at the maximum wear area after spray-coating of the tungsten carbide material can also be obtained based on the results after 136 h of testing. The wear depth Δz of the worn parts at different locations can be estimated cumulatively.

where
According to the results presented in Figure 35, the area with the most serious wear in the movable guide vane made from ZG06Cr13Ni4Mo is found in the head, where the total wear amount was approximately 45 μm, and the most seriously worn area after tungsten carbide spraying was also found in the head, where the total wear amount was approximately 2.6 μm. Therefore, the wear life prediction results for the movable guide vane can be obtained as shown in Table 8.
Wear life prognosis for the movable guide vane.
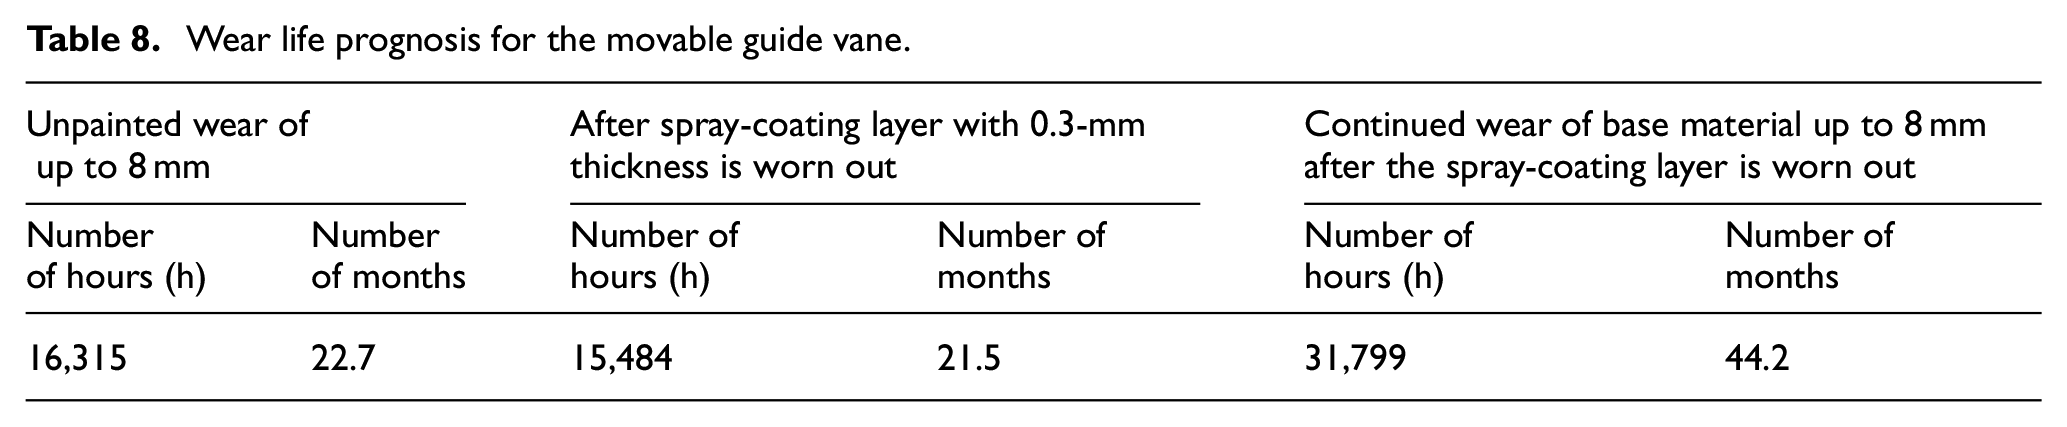
According to China’s Technical Guidelines for sediment abrasion of turbine parts, 31 an average sediment concentration of 3.27 kg/m3 and an output of 11.4 MW causes the maximum depth of wear to exceed 8 mm after 16,315 h (22.7 months) of continuous operation. When a 0.3-mm-thick layer of tungsten carbide was sprayed on the guide vane, operation continued for 15,484 h (21.5 months) until the tungsten carbide coating wore out. It took 44.2 months to wear the base metal down by 8 mm. A comparison of the wear in the guide vanes with and without the tungsten carbide coating is shown in Figure 36. The wear life of the movable guide vane is increased significantly by application of the tungsten carbide coating. Therefore, it is proposed that guide vanes should be sprayed with a tungsten carbide coating to improve their abrasion resistance to sediment.

Wear comparison results.
Conclusions
Numerical simulations and experimental analyses have been conducted to determine the wear laws for movable guide vanes with different sediment sizes. The head of the movable guide vane is mainly worn by the impact of the sand particles, whereas the tail is mainly worn by the horizontal movement of the sand. Different sediment sizes produce different degrees of wear at the head and tail positions on the movable guide vane. Smaller sand particles produce more severe translational erosion at the tail position and larger sand particles create more severe impact wear on the head.
Use of a 3D profiler to obtain the wear amount and wear curve for the movable guide vane surface showed that the movable guide vane made from ZG06Cr13Ni4Mo has a maximum wear position in its head after 90 h of testing; the total wear amount was approximately 45 μm, and the service life of the movable guide vane made from ZG06Cr13Ni4Mo was approximately 22.7 months according to our calculations. To extend the movable guide vane’s service life, tungsten carbide was spray-coated on its surface; as a result, the maximum wear position on the movable guide vane after tungsten carbide spray-coating was only 2.6 μm after 136 h of wear testing, and the service life of the movable guide vane after spray-coating was calculated to be approximately 44.2 months. Therefore, spray-coating of the movable guide vane structure with tungsten carbide is recommended to extend its service life.
The numerical simulations and the test results were used to derive a formula for the sand abrasion rate. The mud wear rate formula for the movable guide vane made from ZG06Cr13Ni4Mo is
The formulas above can also be used to predict the sand abrasion characteristics of other important flow components made from the same materials.
Footnotes
Handling editor: Chenhui Liang
Author contributions
All authors contributed equally to this work.
Declaration of conflicting interests
The author(s) declared no potential conflicts of interest with respect to the research, authorship, and/or publication of this article.
Funding
The author(s) disclosed receipt of the following financial support for the research, authorship, and/or publication of this article: This research was supported by the Key Special Project of the Key Research and Development Plan of “Research on Distributed Photovoltaic and Cascade Small Hydropower Complementary Combined Power Generation Technology” [project number 2018YFB0905200] and by the Sichuan Key Laboratory of Fluid Machinery and Engineering (under the Provincial Science and Technology Plan Project).
Data Availability
The data that support the findings of this study are available from the corresponding author and the first author upon reasonable request.