
Abstract
The deep learning model has gradually matured in the detection of mechanical faults. However, due to the changes in the mechanical operating environment and the application of new sensors in real work, the effect of the training model is not ideal in field applications. The key of this problem is the deviation of feature space mapping between training source domain and application target domain. This paper proposes an unsupervised adversarial domain adaptive fault diagnosis transfer learning model based on the minimum domain spacing to reduce the deviation. In adversarial network training, by training the weight parameters of the classifier, some features extracted by the composed classifier are added to the feature distribution of the target domain through weight changes, which reduces the feature distribution difference between the source domain and the target domain. It is reflected on the reduction of the maximum mean difference distance (MMD) between the two domains, and the fitting features of the data distribution are improved. Finally, through two experimental platforms of rolling bearing and planetary gearbox dataset, the results of six diagnostic tasks show that the new model reduces the amount of parameters by 33.66% and keeps accuracy more than 99% compared with the DANN model under the condition.
Keywords
Introduction
Mechanical equipment fault detection is gaining importance as an important tool for timely detection of equipment faults and prevention of safety accidents. The use of signal processing methods 1 to detect equipment faults requires inspectors to reserve a wealth of expertise and the method has low detection efficiency. The method of machine learning, 2 on the other hand, have the problem of consuming a lot of time to extract features and select features, and the high-dimensional features are difficult to mine. With the development of deep learning models, the use of deep learning (DL) models to detect mechanical faults has powerful data processing and feature extraction capabilities. Therefore, the use of convolutional neural networks (CNN) for mechanical fault detection has shown a booming trend.3–7
However, the current deep neural network-based detection methods still have some shortcomings, and two problems are more prominent:
Building problem of anomalous training dataset. Training a deep learning (DL) model that works well requires a large number of labeled datasets. In real scenarios, collecting a large number of label data sets often takes a lot of time and financial resources, which is expensive. Especially in harsh environments, collecting datasets of mechanical devices for training deep models is tantamount to being difficult.
Transfer problem of training results. For the construction of most DL models, it is usually assumed that the training and test sets have the same data distribution, and in fact most models are trained based on data sets with the same data distribution. Therefore, the models have better detection results. However, in the actual industrial production process, due to various factors such as environmental changes, there are often domain deviations between the training data and the test data. Therefore, when the well-trained model is applied to a new data set, the effect is often unsatisfactory.
Therefore, with the development of transfer learning (TL) techniques, its effective model transformation of similar data allows DL to be better applied to mechanical fault detection.8,9 TL is a machine learning method with which uses knowledge learned from the source domain to assist in solving new tasks in the target domain. Unsupervised domain adaptation (UDA) 10 is a branch of TL. This method usually uses moment matching method or adversarial learning strategy to learn a common feature space, find domain invariant features in the new space, and solve the problem of different data distribution in the source domain and target domain. The moment matching method generally calibrates the difference between the source domain and the target domain through a distance measurement, and maps the features to a common domain space, thereby learning the invariant features of the domain in the new feature space. Tzeng et al. 11 proposed the deep domain confusion (DDC) model to minimize the inter-domain MMD distance at the adaptation layer of the model. Cao et al. 12 introduced the soft joint maximum mean difference (SJMMD) for feature distribution alignment to reduce the marginal distribution and conditional distribution differences of the learned features and detected the planetary gearbox faults. In the deep convolutional neural network. 13 Azamfar et al. introduced MMD to detect cross-domain fault diagnosis problems in ball screws and demonstrated that the method can effectively extract cross-domain features. The strategy based on adversarial learning is to extract domain invariant features through adversarial training for the purpose of confusing the distribution of source and target domain data. Ganin and Lempitsky 14 proposed a high-performance domain adaptive neural network (DANN) consisting of classifier, feature extractor, and domain discriminator to confuse the distribution of source and target domain data. Chen et al. 15 proposed a domain adversarial transfer Network (DATN), which solves the problem of distribution discrepancies across domains using task-specific feature networks and domain adversarial training.
However, most of the existing model detection methods only consider the extraction of domain invariant features to reduce the inter-domain distribution differences in the feature extraction stage, while they ignore the importance of the weight parameter in the classification stage to fit the inter-domain distribution. To address this problem, this paper designs an unsupervised adversarial domain adaptive networks based on minimum domain spacing (MDS-ADAN), which is used to solve the problem of mechanical fault diagnosis between cross-domain sample data. The proposed model consists of a feature extractor, an adaptation layer, a classifier, and a domain discriminator. The model introduces MMD at the adaptation layer and the end of the classifier. The distribution difference between the domains is calibrated for the first time in the feature extraction stage, and the distribution difference between the domains is calibrated for the second time in the classification stage. In adversarial learning, the domain discriminator performs domain discrimination on the features of the source domain and the target domain. When the domain discriminator cannot distinguish the source of the feature, it is regarded as a domain invariant feature. The MDS-ADAN model is mainly compared with the DDC model and the DANN model, and experiments are carried out in six transfer sample experiments constructed on the rolling bearing test platform and the planetary gearbox test platform. The results show that the number of parameters of the model is 72.12% of the DDC model and 66.34% of the DANN model. While reducing the number of parameters, it can effectively improve the fitting degree of the inter-domain distribution and the accuracy of the model. The symbols and meanings used in this paper are shown in Table 1.
Symbol table and meaning.

The main points and contributions of this paper are as follows:
Experiments have proved the defects of the DDC model and the DANN model. For this reason, an unsupervised domain adaptive intelligent diagnosis model is proposed. This model combines MMD and adversarial methods. It is better than the DDC model that only uses MMD and the DANN model that only uses adversarial methods.
The proposed MDS-ADAN model introduces MMD to calculate the loss function twice in the adaptation layer and the end of the classifier. Part of the features extracted by the classifier are added to the feature distribution of the target domain through weight changes. This method has less model complexity, but effectively improves the inter-domain fitting ability, and realizes cross-domain learning for high-performance fault diagnosis.
The proposed fault diagnosis method has the property of unsupervised learning, which is still applicable when the target domain is not labeled.
The rest of this paper is organized as follows: the second part is devoted to related concepts, including domain adaptive and domain adversarial networks. In the third part the intelligent fault detection based on MDS-ADAN is described in detail. In the fourth part the effectiveness and superiority of the method is demonstrated on two testbeds and the results are discussed. The fifth part concludes the paper with a summary.
Related concepts
Domain adaptation
For unsupervised domain adaption, assume that the source domain
MMD measures the variability between sample distributions and is often used in domain adaptation to calculate the degree of variation between the source and target domain distributions.16–18 Specifically, MMD measures the degree of difference between the distributions of the two domains by measuring the mean value of the expectation of the source and target domains mapped onto the reproducing kernel Hilbert space (RKHS) through a kernel function, and converges the distributions of the two domains to be similar by minimizing this mean value. Thus, MMD minimizes the distance between the same class of features in the source and target domains, and the mathematical formula is expressed as follows:
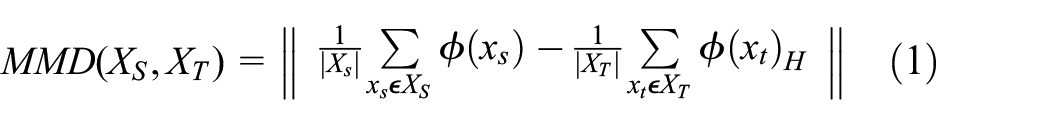
Among them,
Domain adversarial network
Inspired by generative adversarial networks (GAN),
19
adversarial strategies have been applied to the field of domain adversarial.20–22 Classical adversarial domain adaptation usually includes feature extractors

Among them,
The training of a domain adversarial network is a gaming process, and the parameters


Intelligent fault detection based on MDS-ADAN
In summary, the source and target domains can be confused by the adversarial strategy, but the inter-feature distance between the same category is not further considered, and the importance of the weight parameter in the classification stage to fit the inter-domain distribution is also ignored. Using only MMD can close the inter-feature distance of the same category, but the inter-domain confusion is not sufficient, and the distance between different categories is small. To solve the above problems, the MDS-ADAN model is proposed in this paper. To improve the accuracy of fitting the inter-domain distribution by introducing MMD in the adversarial network to minimize the distance between the same category features in the source and target domains, and introducing MMD at the end of the classifier for the second time to train the classifier weight parameters. The specific model structure is described as follows.
MDS-ADAN model structure
As shown in Figure 1, the overall network structure of the designed model contains a feature extractor, an adaptation layer, a classifier and a domain discriminator, and the weight parameters are assumed to be
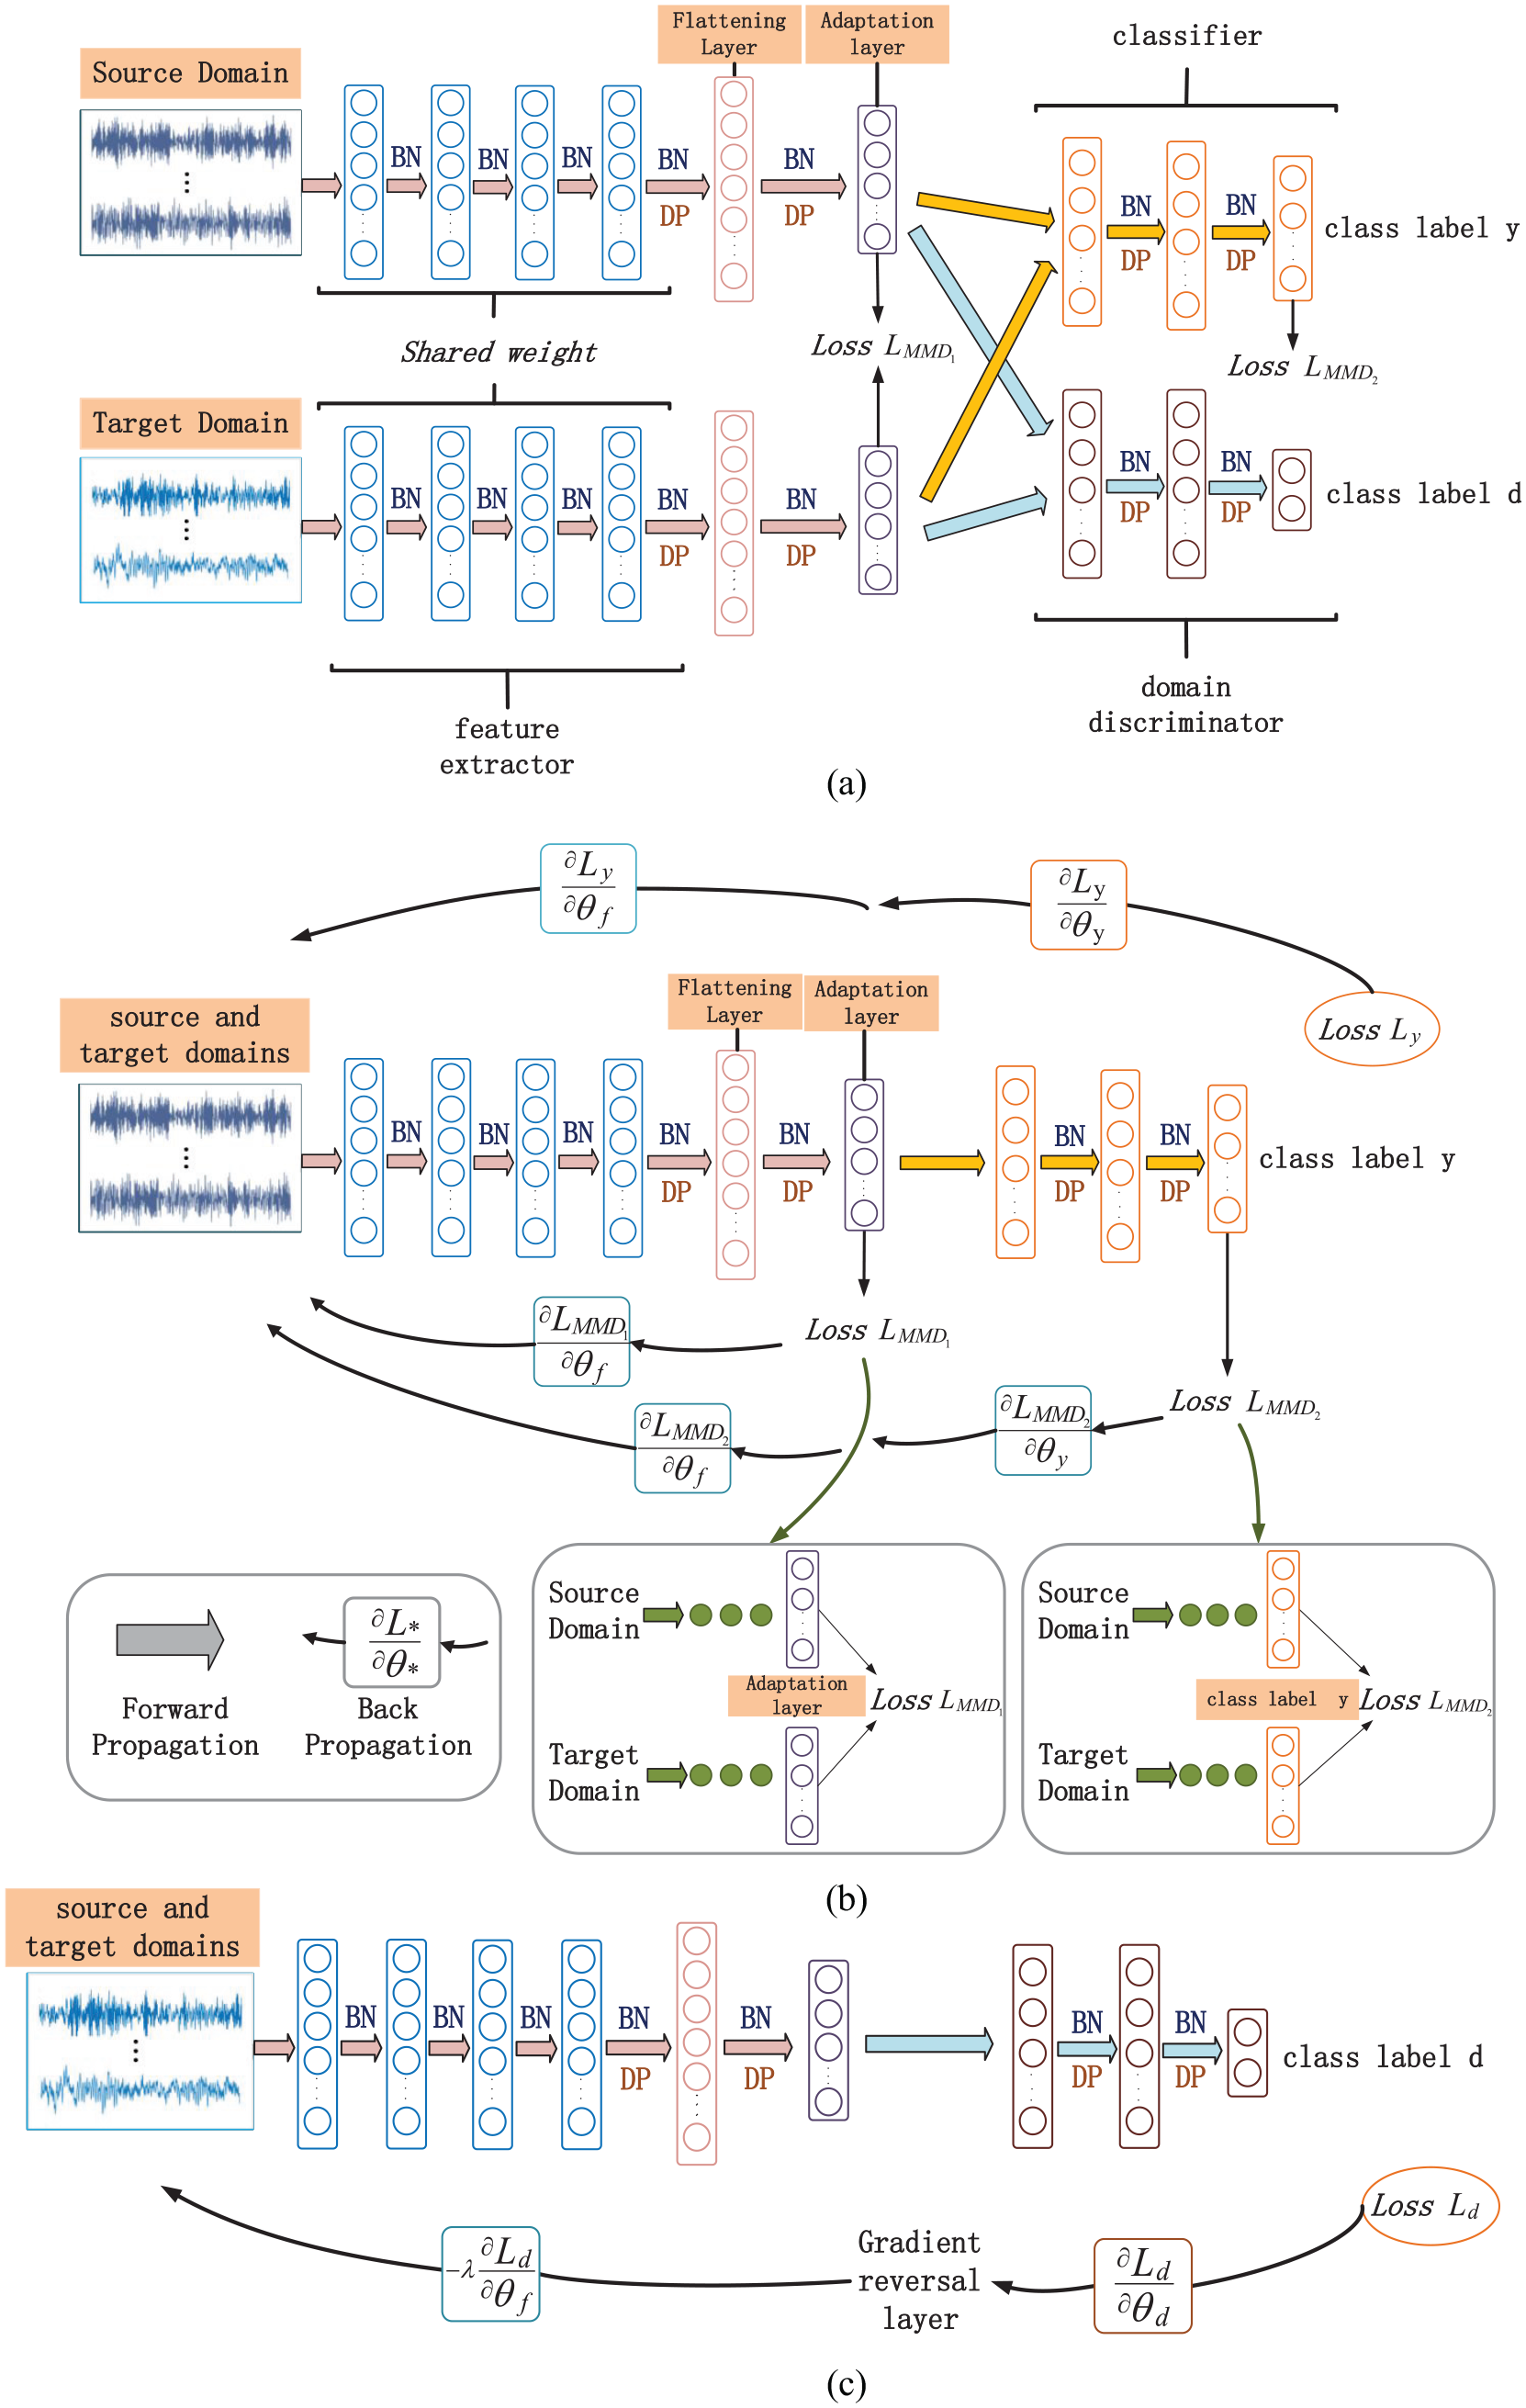
Schematic diagram of MDS-ADAN: (a) model structure of MDS-ADAN, (b) classifier training, and (c) adversarial training.
To solve the covariate shift, a BN operation is added between each convolutional layer of the feature extractor and the fully connected layer of the classifier to normalize the data, and the ReLU
24
activation function is used. The multichannel high-dimensional features are flattened to a one-dimensional signal for input before the adaptation layer, and the output dimension of the adaptation layer is 256. Gradient reversal layer (GRL)
14
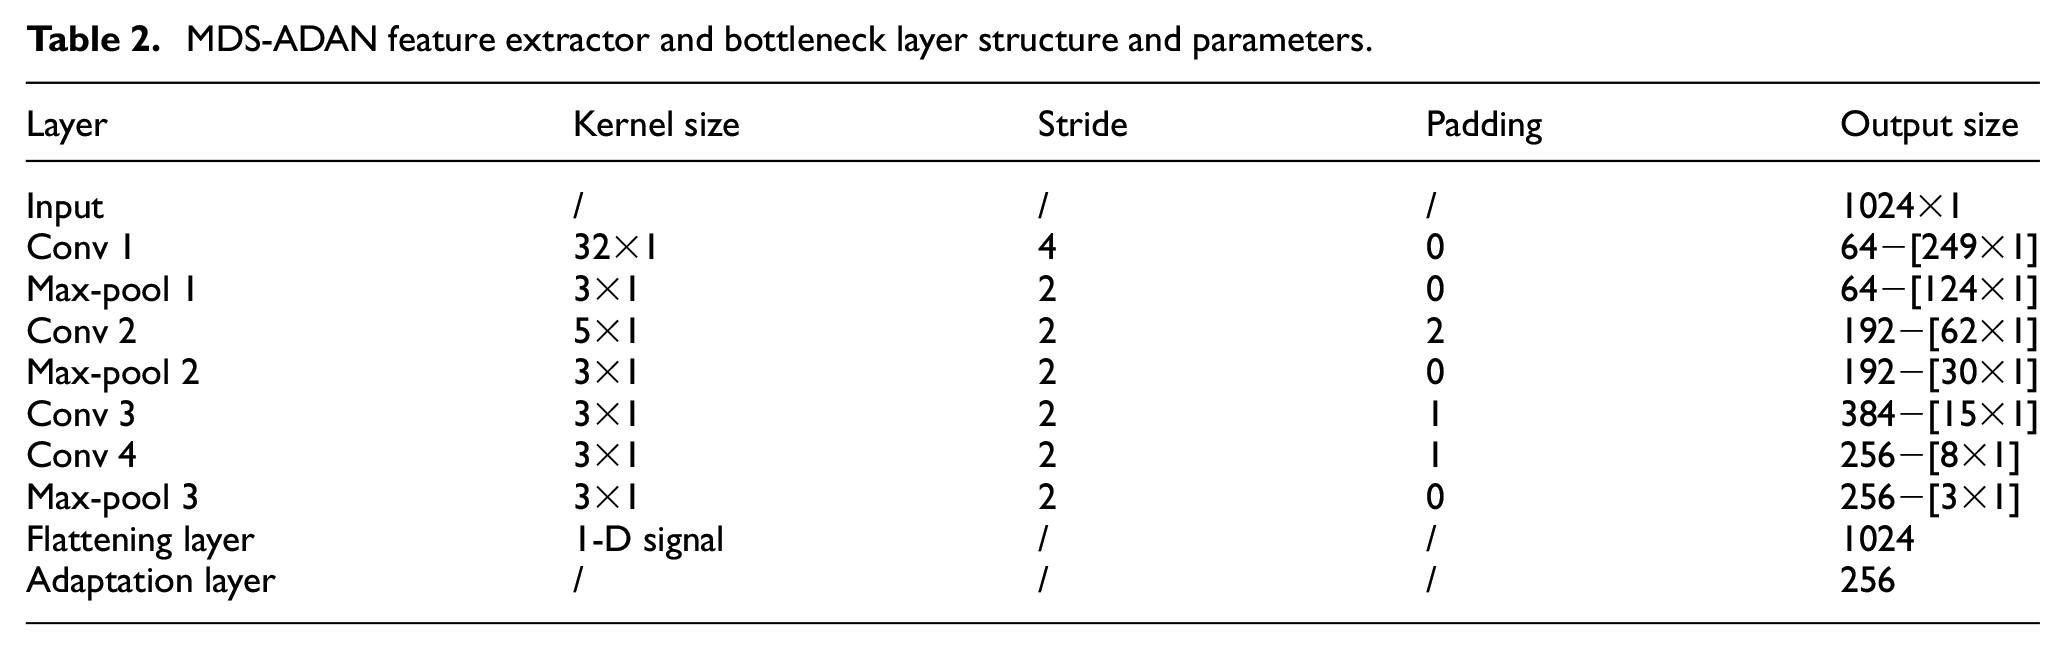
is added for domain discrimination to achieve a constant transform when propagating forward, while the Gradient reversal layer is automatically inverted when propagating backward. The MDS-ADAN feature extractor and adaptation layer parameters are shown in Table 2, 1 ×
MDS-ADAN feature extractor and bottleneck layer structure and parameters.
MDS-ADAN loss function
Distribution difference measure loss function
The learning objective is to minimize the difference in distribution between the source and target domains. The MMD is introduced at the adaptation layer and the end of the classifier to measure the distribution difference between the two domains, and the distance between features of the same category is shortened by minimizing this difference, so as to improve the model’s ability to discriminate data in the target domain. Using MMD as a distribution difference measure between domains, the loss function

Classifier loss function
According to the predicted value of the source domain sample and the source domain sample label, the classification loss
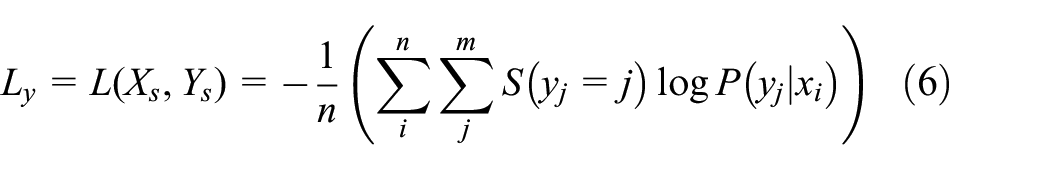
There
Domain discriminator loss function
The domain discriminator is responsible for correctly identifying the source and target domain samples with a source domain label of 0 and a target domain label of 1. The mathematical formula for the cross-entropy loss function of the domain discriminator is expressed as:

Because the domain discriminator is binary, the
MDS-ADAN training strategy
The MDS-ADAN model is to be trained with three parameters:

Thus:

For


There
The feature extractor weight parameters are jointly trained together by four-part loss function including
The training process of the MDS-ADAN model.

Experimental results and analysis
This section takes two fault diagnosis cases of rolling bearing and planetary gearbox as examples. Designed six transfer tasks, and each task performed 10 experiments in order to obtain more accurate experimental results. The MDS-ADAN model is compared with several popular diagnostic models and unsupervised adversarial domain adaptive networks based on single minimum domain spacing (SMDS-ADAN) model for comparison and evaluation of the method.
The SMDS-ADAN model is dedicated to finding the minimum MMD in the adaptation layer to reduce the feature distribution difference between the source and target domains. At the same time, domain adversarial training is performed through the domain discriminator. The MDS-ADAN model further considers reducing the loss of the inter-domain distribution difference of the output features at the end of the classifier, so as to train the weight parameters of the classifier and further reduce the inter-domain feature distribution difference.
Rolling bearing failure data set
Dataset description
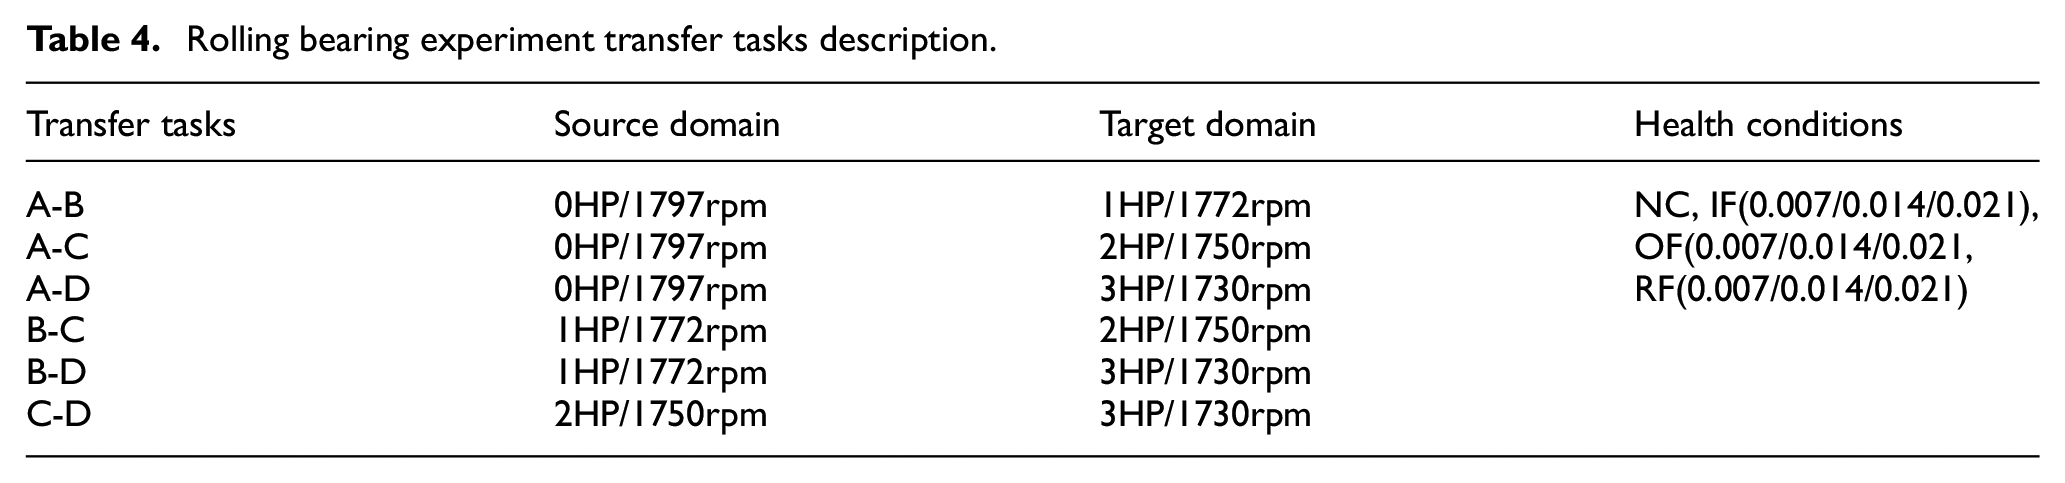
The first dataset was obtained from the Case Western Reserve University 25 public database, and the test platform is shown in Figure 2. It includes a 2 hp (1.5 kW) motor, a torque sensor/translator, a power test meter and electronic controller, and the bearings to be tested were the drive-side bearing and the fan-side bearing. The data set contains a total of four device health conditions: Normal condition (NC), Inner race fault (IF), Outer race fault (OF), and Roller fault (RF). The data sampling frequency used for the experiment is 12 kHz, and the bearings are machined with EDM for single point damage. The drive end bearing data set is selected for the experiment, and the damage diameter is divided into 0.007, 0.014, and 0.021″. The experimental data are collected from the motor speed of 1797, 1772, 1750, and 1730 rpm for four cases, respectively. Therefore, it is divided into 10 categories of equipment health conditions. The transfer task A represents: the sampled data under the four health conditions of NC, IF, OF, and RF when the load is 0 HP. Among them, IF, OF, and RF have three damage states with damage diameters of 0.007, 0.014, and 0.021″, respectively. Similarly, transfer task B indicates that the load is 1 HP, transfer task C indicates that the load is 2 HP, and transfer task D indicates the sampled data when the load is 3 HP, so there are 10 health states for each transfer task. The details are shown in Table 4.

Case Western Reserve University shaft test bench. 26
Rolling bearing experiment transfer tasks description.
Experimental results and analyze
To effectively validate the performance of the MDS-ADAN model, the experiment uses the average accuracy, accuracy confusion matrix, and T-SNE visualization of six transfer tasks to observe and compare the diagnosis results, and compare the operation results of the SMDS-ADAN model and the MDS-ADAN model. For six transfer tasks as shown in Table 4. Four unsupervised domain adaptive methods used for comparison, including DDC, D-DCORAL, 27 DAN, 28 and DANN. The learning batch size of each method is 220 and the iteration period is 200 rounds. SMDS-ADAN performs feature distribution alignment for the adaptation layer. MDS-ADAN performs feature distribution alignment for the adaptation layer and the end of the classifier. The experimental results for the above six models are shown in Table 5. The accuracy of each transfer tasks is averaged from 10 fault diagnoses, and the six transfer tasks accuracies are summarized as the last column average. From the average results in Table 5, it can be seen that the MDS-ADAN model has improved accuracy compared with other DA models, and the accuracy of the MDS-ADAN model is better compared to the SMDS-ADAN model in the same experimental setting. The average accuracy rate increased by 0.8 percentage points.
Accuracy rate of rolling bearing fault data set (%).

Since the MDS-ADAN model is a further innovation on the DDC model and the DANN model, this paper mainly conducts experimental comparisons with these two models, and selects the optimal effect of each method for analysis. The number of parameters of the MDS-ADAN model is 72.12% of the DDC model and 66.34% of the DANN model as shown in Table 6. Through the accuracy rate confusion matrix, the transfer effect of each type of health condition can be observed intuitively. Comparing the confusion matrix in Figure 3, for each category of health conditions compared to the first two models, the accuracy of the MDS-ADAN model is close to 100%, while the DDC and DANN models have a low accuracy of 2–3 categories of health conditions, which affects the overall accuracy. In this respect, the MDS-ADAN model is better.
Number of model parameters.


Confusion matrix with migration task A-D, where the horizontal axis is the prediction label and the vertical axis is the true label. Where: (a) are various accuracy confusion matrices of DDC model, (b) are various accuracy confusion matrices of DANN model, (c) are various accuracy confusion matrices of MDS-ADAN, (d) are various accuracy confusion matrices of CORAL model, (e) are various accuracy confusion matrices of DAN model, and (f) are various accuracy confusion matrices of SMDS-ADAN.
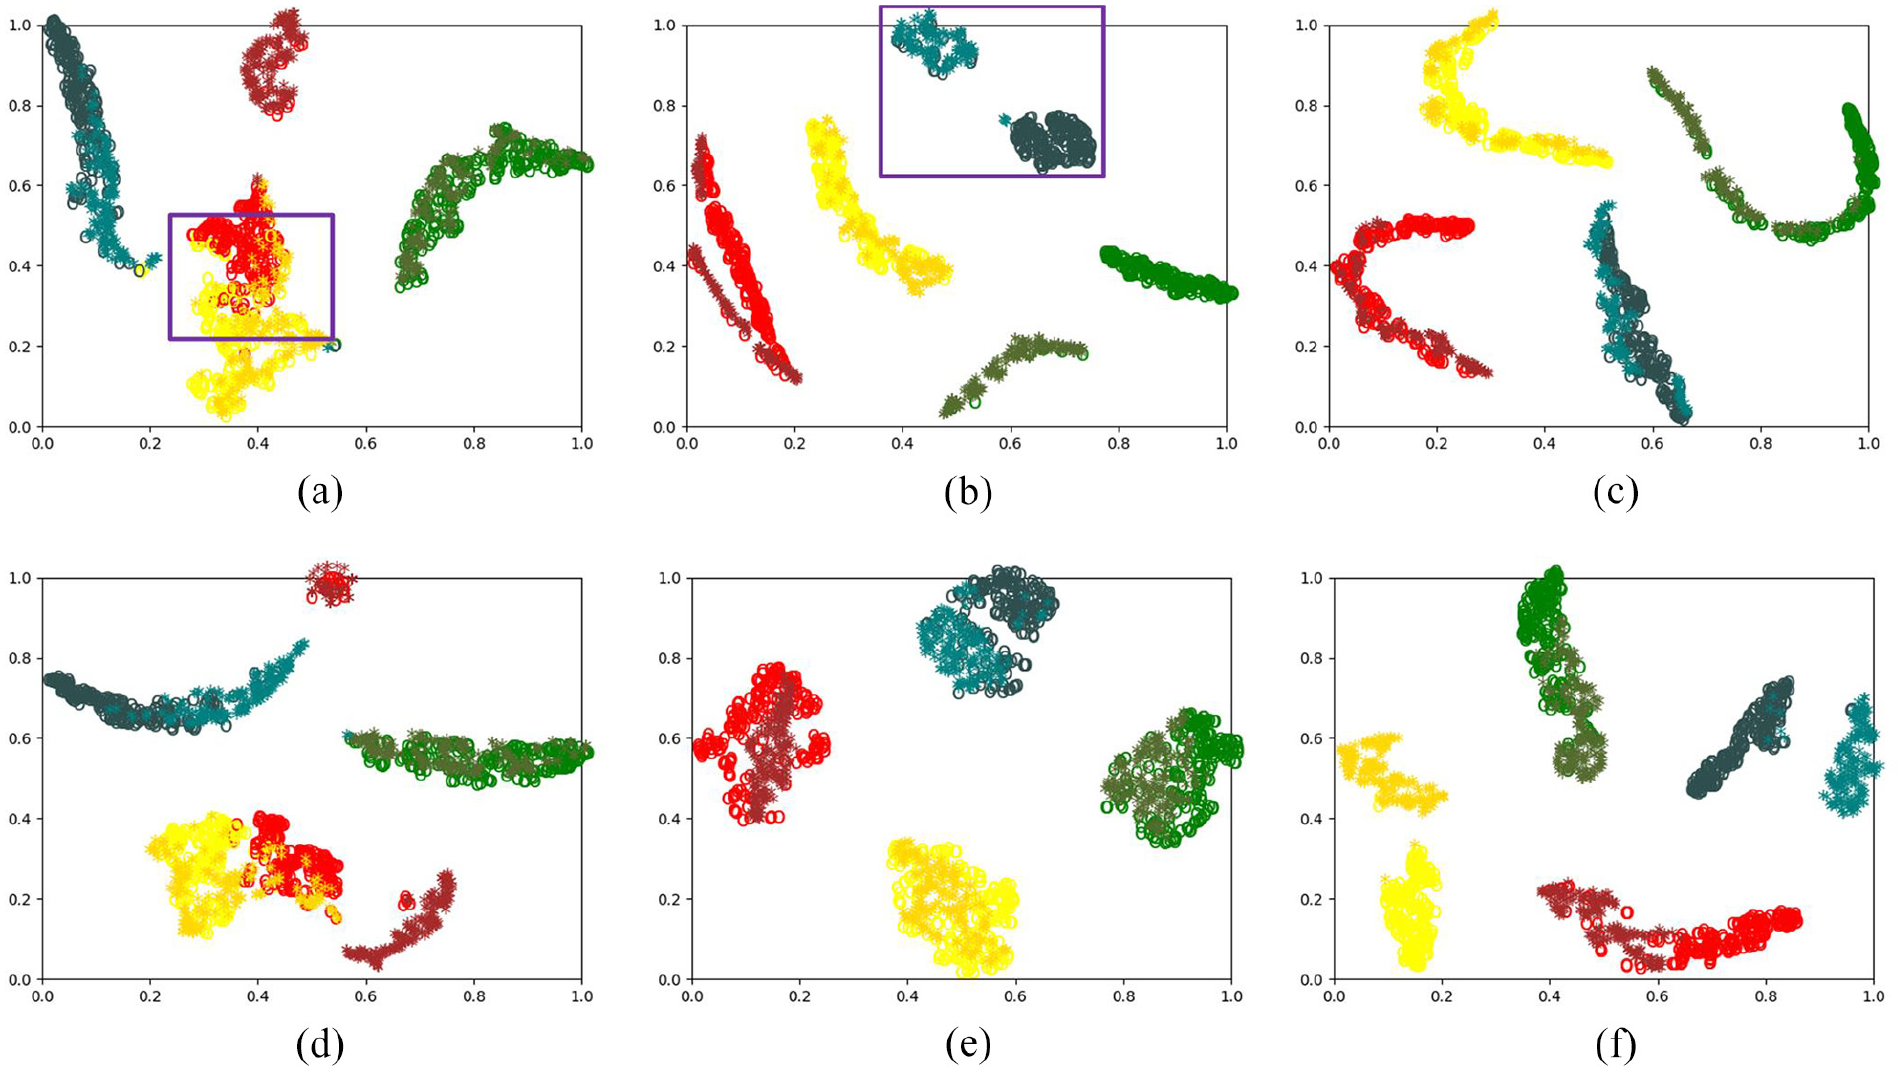
To further investigate the reasons affecting the accuracy, T-SNE visualization is used to analyze the reasons. In the T-SNE visualization result of Figure 4, this paper shows the T-SNE visualization results of DDC, DANN, and MDS-ADAN models for transfer task A-D. It can be seen that in the DDC model, after the data features of the source and target domains are mapped to the same feature space, there is the disadvantage of small distance between the features of different categories, which leads to some equipment health conditions cannot be classified correctly. Moreover, the large distance between the features of the same category is also the reason that directly affects the discriminative ability of the model. As shown in Figure 4(a), three categories of health conditions have the problem of small inter-category feature distance. The DANN model has the problem of large distance between features of the same category after mapping the features of different domains to the common feature space and the problem of small distance between features of different categories still exists. As shown in Figure 4(b), there is the problem of larger distance between features of the same category after mapping the source and target domains. The MDS-ADAN model can effectively solve the above problems of larger distance between features of the same category and smaller distance between features of different category, so that the data distribution of the source and target domains are fully fitted, as shown in Figure 4(c). The results show that the MDS-ADAN model has a good effect on both the ability to discriminate the device health conditions and the ability to fit the data distribution.

The transfer task is T-SNE visualization result of A-D: (a) is the visualization result of the DDC model, (b) is the visualization result of the DANN model, (c) is the visualization result of the MDS-ADAN model, (d) is the visualization result of the CORAL model, (e) is the visualization result of the DAN model, and (f) is the visualization result of the SMDS-ADAN model, where “o” represents 10 types of data in source domain, and “*” represents 10 types of data in target domain.
Planetary gearbox data set
Dataset description
The second data set comes from the QPZZ-II rotating machinery vibration analysis and fault diagnosis test platform system. The sampling frequency of 2.56 Hz. A total of nine channels of vibration sensors are used, and the data from one of the channels is selected for the experiment. In this paper, four health conditions in the data set are selected: Normal Condition (NC), Gear Pitting (GP), Mixed Fault Of Gear Pitting And Pinion Wear (GP + GW), and Pinion Wear (GW). The load conditions are: 0 A load, 0.2 A load, 0.1 A load, and 0.05 A load. The transfer task A represents: sampling data of NC, GP, GP + GW, and GW when the load is 0 A. Similarly, transfer task B indicates that the load is 0.2 A, transfer task C indicates that the load is 0.1 A, and transfer task D indicates the sampling data when the load is 0.05 A. The details are shown in Table 7.
Planetary gearbox experiment transfer tasks description.

Experimental results and analyze
The experiments are compared in the same way as for the rolling bearing dataset, with a batch size of 205 and an iteration period of 100 rounds. The overall accuracy is shown in Table 8, and it can be seen that the average accuracy of the six transfer tasks is still better for MDS-ADAN than the other models. In the confusion matrix and T-SNE visualization this paper shows the results for transfer tasks as C-D. From the confusion matrix Figure 5, it can be seen that MDS-ADAN can achieve correct classification for each class of device health conditions, and DANN also has a high accuracy rate, while the DDC model has the problem of bias in the discrimination of one category of health conditions.
Accuracy rate of planetary gearbox fault data set (%).


The planetary gearbox accuracy confusion matrix of the transfer task is C-D, where (a–c) are the confusion matrices of DDC, DANN, and MDS-ADAN respectively. (d–f) are the confusion matrices of CORAL, DAN, and SMDS-ADAN, respectively.
The SNE visualization is shown in Figure 6. Observing the data features after mapping by the DDC model, it is concluded that the small distance between different categories of features and the large feature distance between features of the same category are the causes of misclassification of health conditions. As shown in Figure 6(a), the distance between different category features is small. As shown in Figure 6(b), although the DANN model has a high accuracy, it is found through feature visualization that the distance between features of the same category is large. Therefore, on this basis, an improved method to reduce the feature distance between features of the same category is further considered, which is conducive to fault diagnosis in a more complex environment. The MDS-ADAN model comprehensively considers the advantages and disadvantages of the DDC model and the DANN model, and can effectively solve the problems existing in the above two models, as shown in Figure 6(c).
T-SNE visualization results of planetary gearbox data set with transfer task C-D: (a–c) are the feature visualization results of DDC, DANN and MDS-ADAN respectively and (d–f) are the feature visualization results of CORAL, DAN, and SMDS-ADAN respectively, where “o” represents four types of data in source domain and “*” represents four types of data in target domain.
To observe the ability of the trained model to fit the data distribution in the source and target domains more intuitively, the average of the distance between the centers of the clusters of the various types of health conditions between the domains is calculated. The mathematical formula is expressed as:

There
The average distances of the clustering centers are shown in Table 9 and the values are obtained by averaging five experiments. It can be observed that the MDS-ADAN model has a smaller inter-domain distance compared to the DANN model and the DDC model. Therefore, the MDS-ADAN model has better generalization ability and stability and is more suitable for realistic industrial scenarios.
Mean of inter-domain distance.

Discussion of results
In the experimental comparison, the DDC model, the DANN model, and the SMDS-ADAN model may have the following problems.
Although the DANN model based on the adversarial strategy can confuse the source domain and the target domain, it does not further consider reducing the distance between the features of the same category. In response to this problem, it is necessary to improve the DANN model.
The DDC model based on the moment matching strategy achieves the reduction of the distance between features of the same category by introducing MMD in the adaptation layer to reduce the inter-domain distribution differences, but does not take the distance between features of different categories into account.
The SMDS-ADAN model introduces MMD in the adaptation layer to reduce inter-domain distribution differences in the feature extraction stage. But the effect of aligning inter-domain distributions only once in the feature extraction stage is poor, ignoring the importance of the weight parameter in the classification stage to transfer source domain knowledge and perform distribution fitting.
Under the assumption that the health status features of the two types of devices are similar, this paper adopts a combination of adversarial strategy and MMD. This method introduces MMD in the adaptation layer to achieve the reduction of inter-domain distribution differences for the first time. At the end of the classifier, MMD is introduced to train the weight parameters of the classification stage, and the difference in the distribution between domains is calibrated for the second time. Through this method, the difference caused by the network behind the adaptation layer is improved, and the performance of fault detection is improved. The experimental results in this paper show that extracting features with principal component properties in the feature extraction stage and the classification stage is equally important for matching the edge feature distribution of the source and target domains.
Conclusion and future work
In order to solve the problem of the deviation of the feature space mapping between the training source domain and the application target domain, this paper proposes an unsupervised domain adaptive mechanical equipment fault diagnosis transfer learning model MDS-ADAN. This method reduces the distribution differences between inter-domains in the feature extraction stage, and at the same time considers the importance of the weight parameters in the classification stage to fit the marginal feature distributions. By adding the training of the weight parameters of the classifier, part of the features of the source domain are transferred to the application target domain, reducing the difference in feature distribution between domains, and performing fault detection on the rolling bearing and planetary gearbox test platform, which verifies the effectiveness of the method. Compared with four general domain adaptive models, this method has a higher accuracy rate. From the visual analysis, it can be seen that the model can better match the marginal feature distributions of the source domain and the target domain. Therefore, it is proved that the method can effectively fit the feature distribution of the source domain and the target domain, and can effectively predict the fault when the target domain lacks labels.
In the course of our experiments, it is found that the discriminant effect of the model on the source domain data directly affects the discriminant effect on the target domain data. When a certain type of equipment failure in the source domain cannot be accurately identified, the learned knowledge will be transferred to the target domain, which will directly affect the identification of the target domain, leading to erroneous fault diagnosis. Through experiments, it is found that this type of situation is related to the performance of the feature extractor. Therefore, how to construct a better feature extractor and embedding the classifier into our model is the direction of the next research.
Footnotes
Handling Editor: Chenhui Liang
Declaration of conflicting interests
The author(s) declared no potential conflicts of interest with respect to the research, authorship, and/or publication of this article.
Funding
The author(s) disclosed receipt of the following financial support for the research, authorship, and/or publication of this article: This work was supported by the Project of the National Natural Science Foundation of China(no. 51204185, 51974295), Jiangsu Postgraduate Research and Practice Innovation Program Project(2021ALA02016), and Industry-University-Research Innovation Fund of Ministry of Education (2021ALA02016).