
Abstract
Rolling bearing is one of the components with the high fault rate for rotating machinery. Big data-based deep learning is a hot topic in the field of bearing fault diagnosis. However, it is difficult to obtain the big actual data, which leads to a low accuracy of bearing fault diagnosis. WGAN-based data expansion approach is discussed in this paper. Firstly, the vibration signal is converted into the gray texture image by LBP to build the original data set. The small original data set is used to generate the new big data set by WGAN with GP. In order to verify its effectiveness, MMD is used for the expansion evaluation, and then the effect of the newly generated data on the original data expansion in different proportions is verified by CNN. The test results show that WGAN-GP data expansion approach can generate the high-quality samples, and CNN-based classification accuracy increases from 92.5% to 97.5% before and after the data expansion.
Keywords
Introduction
With the rapid development of automation, high efficiency, and intelligence of the modern mechanical equipment, the connection among various equipment is getting closer. The occurrence of component fault is one of the main causes of equipment accidents. 1 Rolling bearings help the machine to rotate smoothly, and can bear a certain load, it is a key component to support the rotating machine. High speed, heavy load, and limited lubrication make rolling bearing become one of the elements with a high fault rate in rotating system. 2 Therefore, it is of great significance to carry out the fault diagnosis of rolling bearing, which can improve the reliability in running process and eliminate the hidden dangers. In recent years, with the rapid growth of sensors, internet of things, and computing technology, the fault diagnosis technology based on big data deep learning has been widely studied.3,4 Different from the traditional fault diagnosis methods, the deep learning can adaptively extract deep features of tested data and intelligently mine the featured information hidden behind data.5,6 In the traditional fault diagnosis, aiming at a series of problems caused by the artificial feature extraction based on the expert experience, Gong et al. 7 proposed an intelligent method combining CNN (Convolutional Neural Network) and SVM (Support Vector Machine) for the fast diagnosis of motor bearing. Zhou and Yu 8 proposed 1D residual convolutional AE (Auto-Encoder) for the vibration feature extraction, and then used a small amount of labeled data for classification and fine tuning to complete fault diagnosis. For vibration images of rolling bearing affected by noise, Fan et al. 9 used CNN as an adaptive feature extraction and recognition tool to study different vibration image samples. Zhang et al. 10 proposed a multiscale holospectrum CNN based on 2D feature fusion and decision-level fusion. Zhao and Shao 11 proposed an adaptive bearing fault diagnosis method, which has a strong feature learning ability by GRU (Gated Recurrent Unit). The above can extract the hidden fault symptom and causal relationship from a large amount of data, independent of the prior knowledge, and effectively solve the subjectivity and uncertainty caused by the manual intervention.
In the big data learning process, a large number of samples are needed to obtain a suitable deep learning model. However, in the actual situation, although the amount of equipment data is enough, the available fault data are usually very rare. Meantime, the manual labeling task of data is heavy, which makes it difficult to train a deep learning model. There are two main means to solve this problem. One is TL (Transfer Learning), which accumulates the field knowledge by learning big data from a similar domain, and then it fine-tunes the model with a small amount of real data. Wang et al. 12 used TL of two data sets to identify bearing state under different loads, and the model is verified. He et al. 13 proposed an enhanced deep transfer AE for bearing fault diagnosis. Wu et al. 14 constructed a LSTM (Long Short Term Memory) by the instance-based TL, and adopted a simultaneous distribution adaptive algorithm to reduce the probability difference between the auxiliary and target data, and used Graywolf optimizer to adjust parameters. Fan et al. 15 designed a virtual image set according to characteristics of real samples, and then transferred CNN parameters to target data, a better classification effect had achieved. Although TL can learn big data through different transfer schemes, its training still needs the sufficient source domain data. Another is to expand the source domain data to obtain the enough original samples. For 1D vibration data, new big data can be obtained by adding the background noise, translation, amplitude drift, and time stretching. Similarly, 2D image-type data can be expanded by flipping, clipping, adding noise, and local blur. However, these operations obtain the big data only by the artificial processing of original samples, and does not produce the qualitative changes in the diversity of original samples, resulting in a poor effect for a fault recognition task. 16
GAN (Generative Adversarial Networks) was proposed by Goodfellow et al. in 2014 and had received the wide attention in image generation, data enhancement, and style migration.17,18 In the field of fault diagnosis, Ma et al. 19 combined the health data and fault mechanism of equipment, and the data generation without real samples were implemented by DCGAN (Deep Convolutional GAN). Guo et al. 20 improved the sample generation quality based on WGAN (Wasserstein GAN) and realized the fault identification with high accuracy. Liu et al. 21 proposed a variational auto-encoding GAN, which was verified by bearing fault diagnosis. Wu et al. 22 proposed a semi-supervised information maximizing GAN, and the data imbalance problem was solved. Zhou et al. 23 combined AE with GAN to obtain fault features. Although the above researches had made good progress, there are still many issues. Firstly, in many studies, the bearing vibration data were addressed as only 1D, and the characteristics of 1D vibration data need to be artificially strengthened. Meantime, GAN and its variants were proposed mainly in the field of the common image processing, so 1D vibration data cannot be fully utilized for GAN. Secondly, the quality of data generated by the original GAN and improved DCGAN is still low, although the new WGAN improves the loss function of GAN, it realizes the constraint mainly by forcing weight clipping.
To solve the above problems, this paper studies a WGAN-based data expansion approach by adding the GP (Gradient Penalty) for 2D vibration gray texture images. The vibration data are converted into vibration gray texture images by LBP (Local Binary Pattern), 24 and the images are expanded by the improved WGAN to realize the data enhancement. MMD (Maximum Mean Discrepancy) is proposed to evaluate the generated samples, and CNN is used to verify the data expansion effect. This paper mainly studies the influence of the expansion ratio of original samples on the bearing fault diagnosis accuracy for the new WGAN-GP model, which is valuable in the big data-based intelligent mechanical fault diagnosis field.
WGAN-based data expansion
Principle of GAN
GAN is inspired by zero-sum game theory. When GAN is applied to deep learning, it means that the network G (Generator) and network D (Discriminator) are constantly played and optimized under the confrontation training, and finally reach the Nash equilibrium, so that G can learn the distribution of data. As shown in Figure 1, G is a generative network that receives a random noise vector Z, which is a vector composed of random numbers where G uses as the starting point for sample generation. This means that the images are generated by G. D is the discriminant network, which discriminates whether the images are “real.” Meantime, D determines and outputs the probability of “real” for each input sample.

Principle of GAN.
The general formula for GAN is
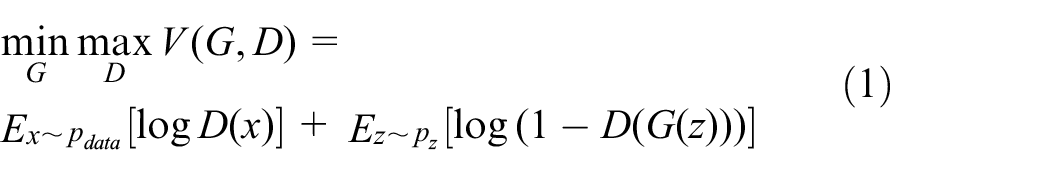
As JS (Jensen-Shannon) divergence of the loss function of original GAN is theoretically unreasonable, WGAN uses a new loss function, that is, Earth Mover’s Distance, also Wasserstein Distance, which effectively corrected the training difficulties and mode collapse.
The Wasserstein Distance is defined as

where
When using the Wasserstein Distance, the continuity condition, that is, Lipschitz continuity should be met. The WGAN realizes the constraint by forcing the weight clipping, which may lead to an unexpected behavior in the training process. The improved WGAN forces the discriminator to satisfy the continuity constraint by adding the GP. 25 The GP is
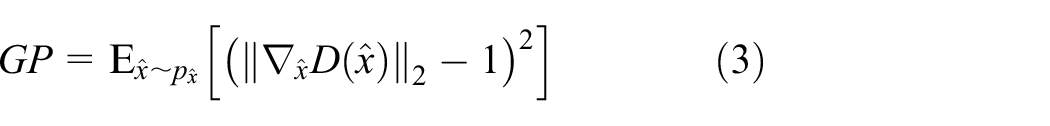
where
The discriminator loss function with GP is

where λ is the super-parameter of GP.
The WGAN-GP optimizes the original WGAN by increasing the gradient penalty instead of forcing weights cutting.
Data expansion process
This paper proposes a WGAN-based data expansion approach by adding the GP for 2D vibration gray texture images. The data expansion and fault diagnosis process is shown in Figure 2.

Flow chart of data expansion and fault diagnosis.
Firstly, the vibration data collected by sensors were transformed into the gray texture images, where the frequencies of original vibration signal were enhanced into the texture of gray images by LBP. Then, use the images as input to WGAN-GP, and the model training was carried out through the alternate training of G and D network. The generated samples were evaluated by MMD, and G model with smaller MMD was screened out. The real samples were mixed with the generated samples to build the training set, and then the feature extraction and fault diagnosis were carried out by CNN. Finally, the fault diagnosis of rolling bearing was realized under the small original samples.
Data expansion evaluation
MMD-based evaluation
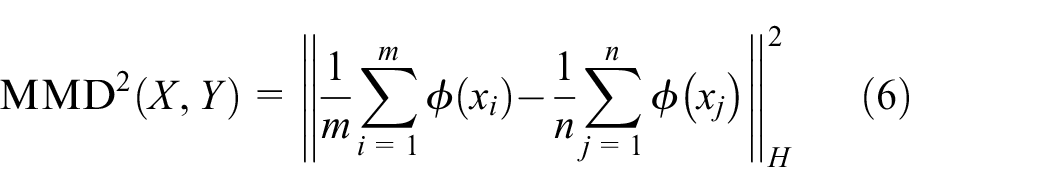
Suppose there is a function f(x), P and Q are input into f(x), if mean(f(P)) = mean(f(Q)) occurs, then P and Q can be considered the same distribution. The difference is defined as MD (Mean Discrepancy), that is,

Looking for a f(x) in the function set F to maximize MD, which is defined as MMD. The F should meet the following requirements: the function set is rich enough; in order to satisfy the restrictive constraints, MMD is expected to rapidly converge when the data set increases. These conditions can be satisfied when F is an unit sphere in the regenerated Hilbert space. At this point, there is
CNN-based evaluation
CNN is a classical neural network for the image identification. The general CNN consists of input, convolution, pooling, full connection, and output layer. The input is an image, and the model parameters are trained by the gradient descent method. The trained CNN can learn the image features and complete the image classification. The feature extractor of CNN consists of the convolutional and polling layer. In the convolutional layer, a neuron is only connected with neighboring neurons, but not with all superior neurons. If the layer i is the convolutional layer, the calculation of feature map is

where f(·) is the excitation function,
In the full connection layer, each neuron is connected with all neurons from the upper level, and then the output is calculated by the activation function. After the input is transferred alternately through convolutional and polling layer, the input target is classified through the full connection layer. CNN increases the network depth by increasing the number of convolutional layers, and the training objective is to minimize the loss function. The input are transmitted through the feedforward network, and the difference with the expectation is calculated through the loss function. The cross entropy is used as the loss function in this paper. In the training process, the back propagation is a commonly used optimization method, which allows the information from the loss function to flow backward through the convolutional layer to calculate the gradient, then the neuron parameters are updated.
Vibration image preparation
Transformation principle
As shown in Figure 3, the left is to display the gray texture information corresponding to different frequency components using analog vibration signal, the middle is the generation of gray texture image for tested vibration signal used in this paper, and the right is the schematic diagram of LBP.
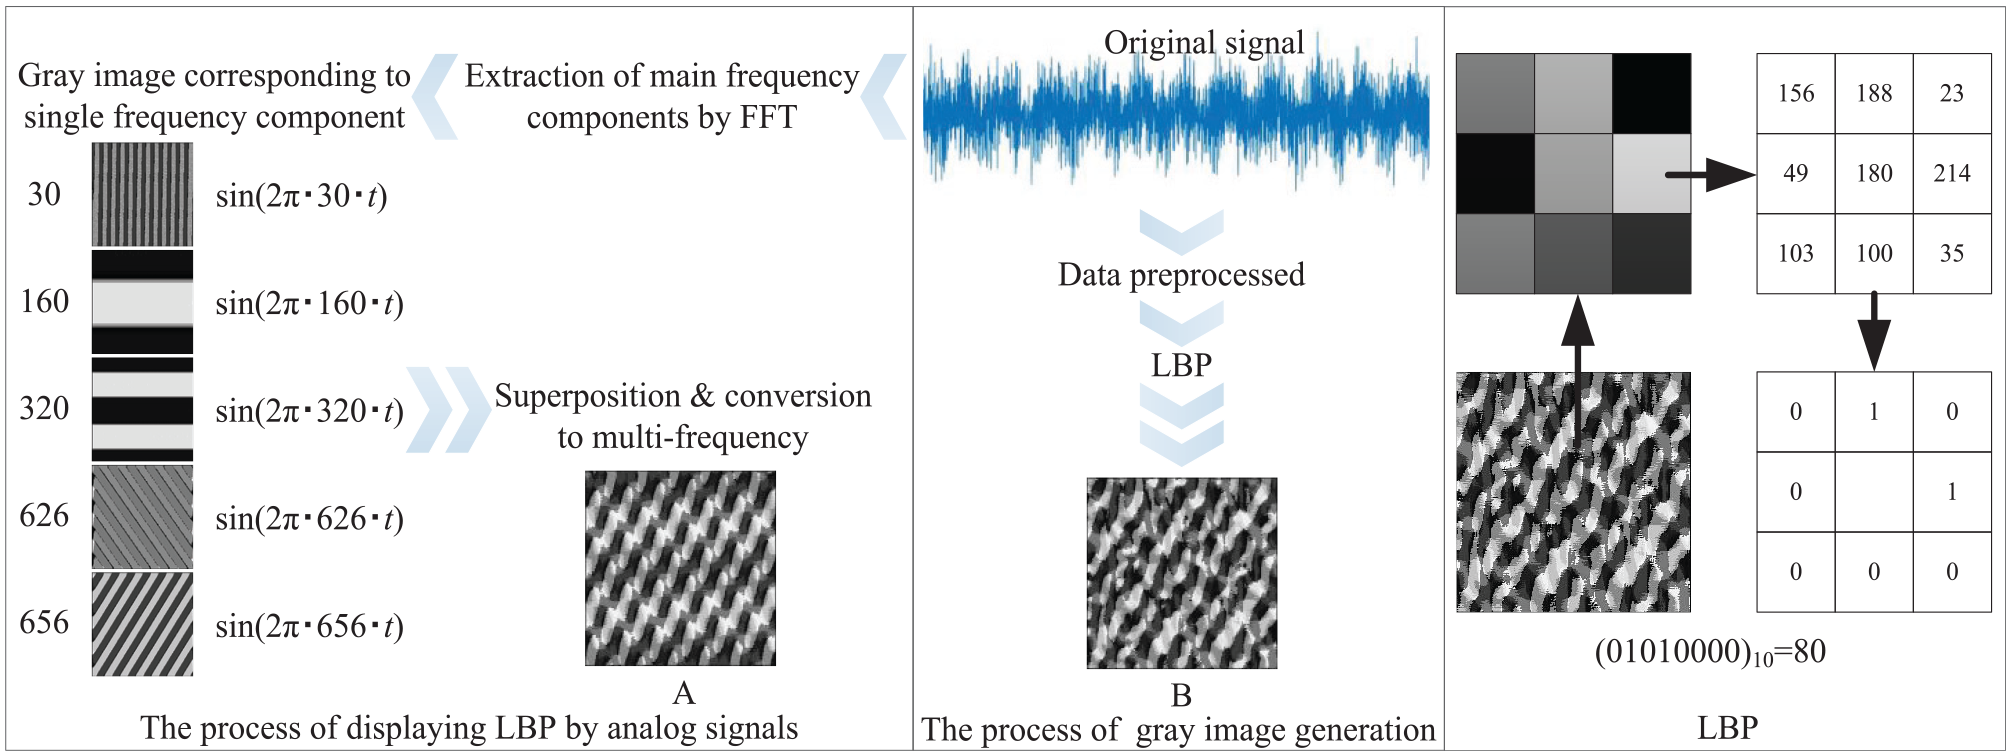
Schematic diagram of gray texture image: A is the gray texture image simulated by analog signal; B is that of the tested signal.
LBP is an operator describing the local texture features of an image, which has the advantages of rotation and gray invariance. As shown in Figure 3, in a 3 × 3 window, the window center pixel (i.e. 180) is used as the threshold, the gray values of eight adjacent pixels are compared with the threshold. If the surrounding pixel value is greater than the center pixel value, the pixel position is recorded as 1, otherwise, 0. Finally, the values of surrounding pixel points are sequentially arranged and converted into the decimal number, which is recorded as the pixel value of the middle position. This transformation is performed for each pixel point to realize the preparation of the whole gray texture image.
In this paper, the gray texture images were obtained by LBP. In the vibration gray texture image transformation process, the signal components with different frequencies were converted by LBP, there were differences in the texture size and deflection direction for different frequencies. As shown in the left of Figure 3, taking a normal bearing as an example, the frequency components of vibration signals were firstly extracted by FFT, the gray texture image corresponding to each frequency and that after the frequency superposition were obtained respectively. Comparing image B with A in Figure 3, it can be found that the gray texture images use the textural information to describe the frequencies involved in vibration signal. Thus, after the image transformation of vibration data, the gray texture is different, that is, the image features are different.
Data set establishment
In this paper, the fault diagnosis test bench of rolling bearing was used, as shown in Figure 4. 26 The faults of rolling bearing include the inner ring crack, outer ring crack, and ball pitting, as shown in Figure 5. 26 The bearing type is NSK-6205, the number of rolling elements Z = 9, the diameter of rolling elements d = 7.94 mm, the pitch diameter D = 39.36 mm, and the contact angle α = 0°. Both inner and outer ring cracks are the square groove of 2 mm ×1.5 mm ×0.5 mm, and ball pitting is made by short-term corrosion. Set the motor speed 1800 r/min, and the signal sampling rate is 10.24 kHz.

Fault diagnosis test bench of rolling bearing.

Rolling bearing fault: (a) inner ring crack, (b) outer ring crack, and (c) ball pitting.
For each fault in Figure 5, 4096 consecutive points were converted into a 64 × 64 matrix as a sample. The vibration data were normalized by linear mapping, the matrix was extended as 256 × 256 by the nearest neighbor interpolation. The converted gray texture images contained 300 samples of each fault, a total of 1200 as the training set, 50 samples of each fault, a total of 200 as the test set, as shown in Figure 6.

Four kinds of vibration gray texture image: (a) normal, (b) inner ring crack, (c) outer ring crack, and (d) ball pitting.
Experiment
Data expansion scheme
In the experiment, a small number of the original 1D vibration data were filtered, and then converted into the gray texture images. WGAN-GP was trained to realized 2D image data expansion. The recognition of unknown samples was carried out by CNN. The experiment scheme is shown in Figure 7.

Experiment scheme of rolling bearing fault diagnosis based on WGAN-GP and CNN.
In the WGAN-GP training process, the generator input was the random noise with uniform distribution, and the output was the generated sample, whose distribution is similar to the real samples. The input of discriminator was the real and generated samples. The output is the function value. Because the convolutional layer has high feature extraction ability, the discriminator and generator were composed of the convolutional and transposed convolutional layer.
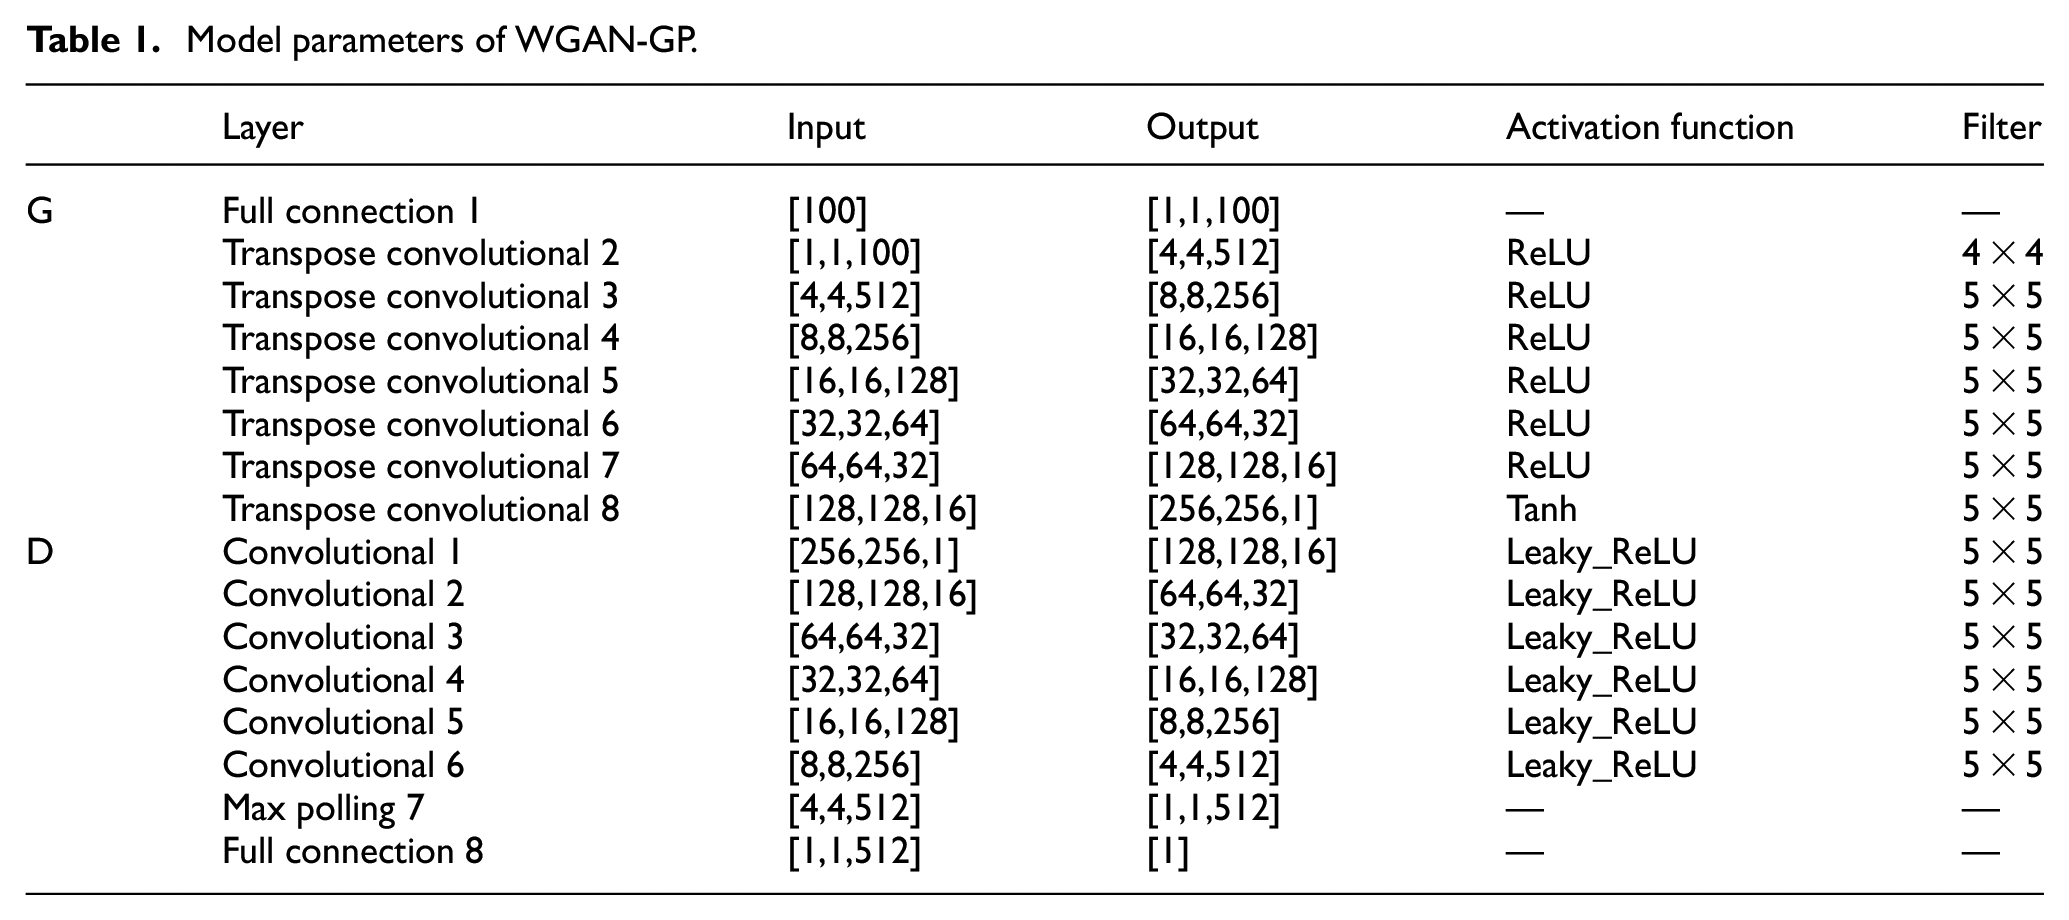
The training process is as follows: the random noise conforming to the uniform distribution was input into generator with a dimension of 100. Firstly the dimension was expanded through the full connection layer. After that, the data were recombined into 3D tensor and ReLU was used. Finally, the tensor with a size of [1,256,256] was generated by six-layer transposed convolutional layer, and the gray texture image was generated. In the last layer, the Tanh was used to ensure that the output was between 0 and 1. In the discriminator, contrary to the generator, there were six convolutional layers, all with Leaky_ReLU as the activation function, and the last layer was the fully connected layer with one node. The parameters of WGAN-GP is shown in Table 1.
Model parameters of WGAN-GP.
Verification and Study
Firstly, the generated samples were evaluated by MMD, and then the fault identification effect was verified by CNN. For different data sets, the generated and original samples were mixed in different proportions, the effect of the number of original samples and the expansion ratio was studied. As shown in Figure 8(a) to (d) are the real samples, and Figure 8(e) to (h) are the generated.

Real and generated gray texture image samples: (a) real normal sample, (b) real inner ring crack sample, (c) real outer ring crack sample, (d) real ball pitting sample, (e) generated normal sample, (f) generated inner ring crack sample, (g) generated outer ring crack sample and (h) generated ball pitting sample.
MMD-based Evaluation
In order to verify the data expansion effect of WGAN-GP, the generated gray texture images during the model training were firstly evaluated by MMD. Taking the normal case as an example, it can be seen from Figure 9 that with the training of WGAN-GP, the distance between the generated and real samples becomes smaller, and finally tends to be stable. Meantime, it can be found when the number of samples is small, MMD between the generated and real samples tends to be stable, but MMD is significantly more greater. It shows that GAN can hardly learn the distribution of target data when the number of real samples is rare.

MMD under different number of original samples.
CNN-based Evaluation
The CNN training process is shown in Figure 10.
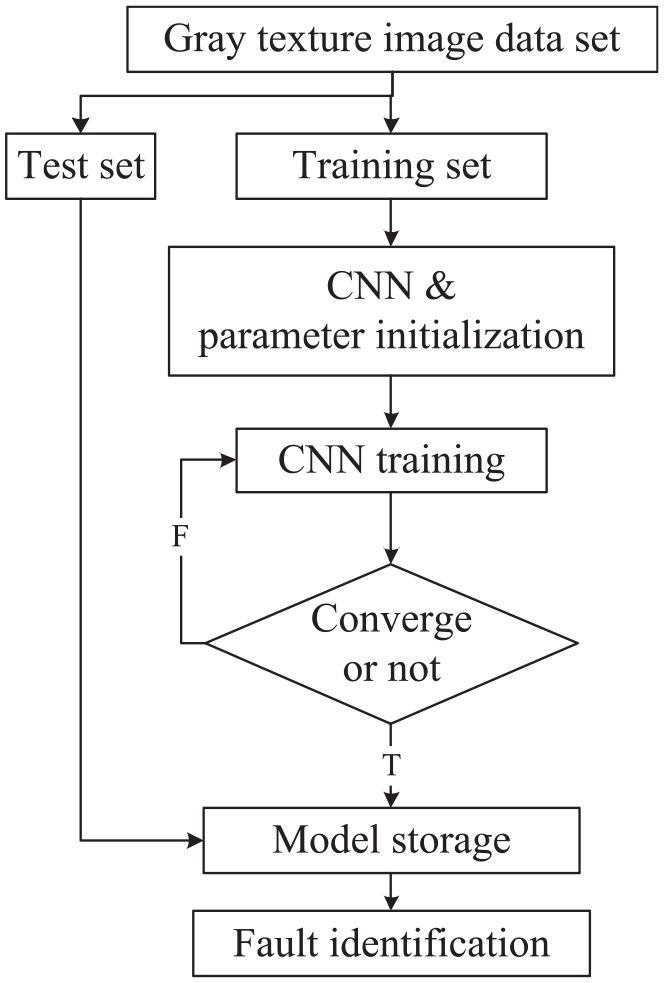
CNN training flow.
The original gray texture image data set was divided into training and test set. The test set samples did not participate in the training, and the training set samples were trained by CNN. The structure and parameters of the used CNN is shown in Table 2. In the CNN training process, the model structure, hyper-parameters, and optimizers remained unchanged, only the number of training set samples was a variable.
Model parameters of CNN.

Three groups of compared study were done in the experiment. Firstly, the classification accuracy of different numbers of original samples was discussed. Then, when the number of original samples was fixed, the different numbers of generated samples were mixed to form new data sets, and the influence of the expansion ratio on the CNN classification accuracy was studied. Finally, the first three groups of mixed proportions with the highest accuracy were selected to study the data expansion effect under different quantities. In order to simulate small samples, the original samples were divided into the data sets A–E, and the number of samples increased by 200 successively. The original samples in Table 3 are the samples participating in WGAN-GP training.
Classification accuracy under different original samples.
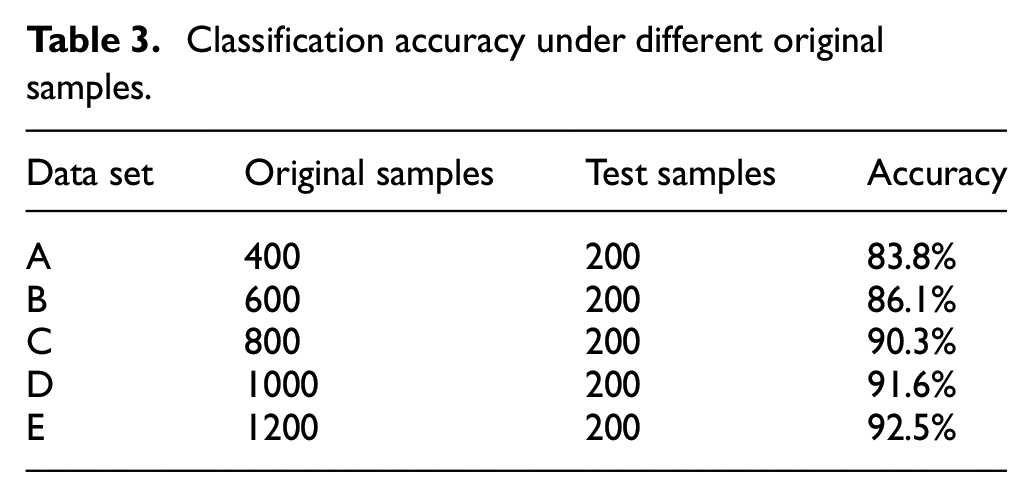
Table 3 shows the classification accuracy of CNN under different samples. As can be seen from Table 3, as the number of samples decreases, the classification accuracy becomes lower and lower, that is, the number of samples has a great influence.
In Table 4, when the number of original samples is 800, the number of generated samples is increased by half of the original samples in turn to build data sets 1–7. The results show when the original samples are fixed, the expansion ratio between the original and generated samples has an influence on the accuracy, which first increases and then decreases, the inflection point occurs at the case of 800:800:200. It can be seen when the ratio of the original and generated samples is kept at 1:1, the accuracy improvement is better than other cases, and compared to the data set without the generated samples, the accuracy is improved by 4.5%. When the proportion of the generated samples is too large, the main body of the training set changes, the training is dominated by the generated samples. The generated samples are different from the real, and the error is inevitable, which leads to a downward trend of the classification accuracy when the proportion of the generated samples is too large.
Classification accuracy under different expansion rates.

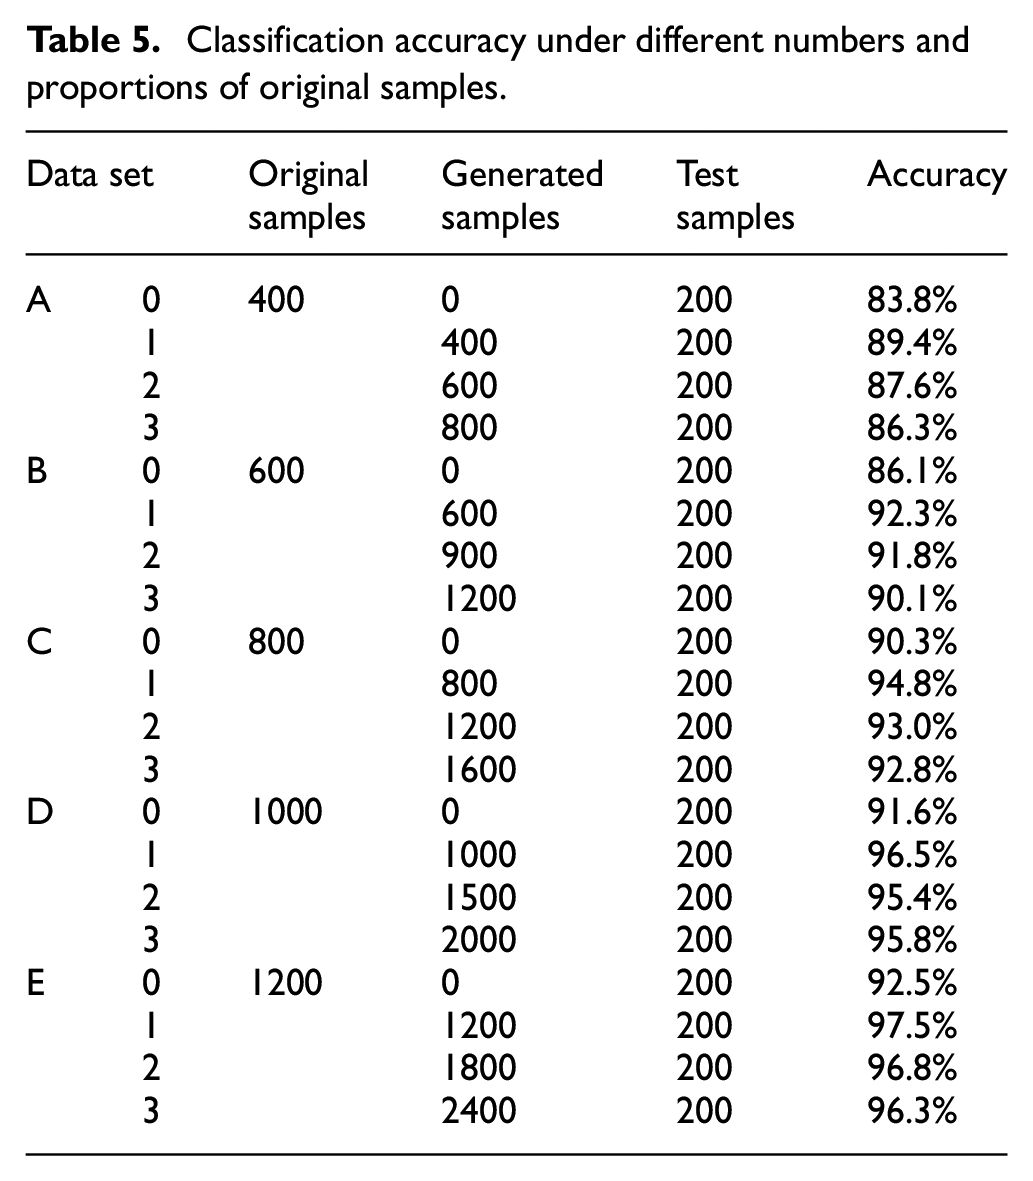
According to Table 4, three groups of scheme with the higher accuracy were secondly selected, the classification performance was studied on the data sets A to E with different original sample numbers. As shown in Table 5, the results show with the increase of the number of the original samples participating in WGAN-GP training, the accuracy of the mixed training set is getting higher. It can be seen that the classification accuracy under data set E1 reaches the highest of 97.5%, which is 5% higher than that under E0 only with the original samples.
Classification accuracy under different numbers and proportions of original samples.
For the schemes E0 and E1 in Table 5, this paper further uses the confusion matrix, accuracy, precision, recall, and F1-score on the test set as the model evaluation indexes, the detailed results are shown in Table 6 and Figure 11. It can be found that after the data expansion, the accuracy is increased by 5%. The precision of a single fault type is increased by a maximum of 8%, an average increase of 5%, the recall of a single fault type is increased by a maximum of 10%, an average increase of 4.9%, and the F1-score of a single fault type is increased by a maximum of 7.5%, an average increase of 5.1%. This indicates that the generated samples indeed enrich the data set and provide more features to improve WGAN-GP model.
Evaluation indexes on test set before and after the data expansion for E0 and E1.


Confusion matrix comparison of classification models before and after the data expansion for E0 and E1.
In addition, Table 7 further shows the model classification accuracy under three main data expansion methods with the same original samples and data expansion ratio. It can be seen that the classification accuracy of WGAN-GP is improved by 5% compared to that without data expansion, and is also higher than the other two expansion methods of DCGAN and WGAN.
Classification accuracy of different expansion methods.

Conclusions
The gray texture transformation can better highlight the different frequency components of 1D original vibration signal and then effectively improve the accuracy of rolling bearing fault diagnosis.
The WGAN-GP can generate higher quality samples by adding the gradient penalty, and the quality of the newly generated samples is directly evaluated by the MMD index.
The CNN-based fault classification accuracy of the WGAN-GP data expansion method increases from 92.5% to 97.5% after the data expansion, which proves the positive effect of this work.
Footnotes
Handling Editor: Chenhui Liang
Declaration of conflicting interests
The author(s) declared no potential conflicts of interest with respect to the research, authorship, and/or publication of this article.
Funding
The author(s) disclosed receipt of the following financial support for the research, authorship, and/or publication of this article: Thanks are due to Jiangsu Lianyy Measurement & Control Technology Co., Ltd., for providing bearing fault machining services for this work. This research is supported in part by the National Natural Science Foundation of China (51605380) and Shaanxi Basic Research Program of Natural Science (2021JM-391).
Data availability
The data used in this paper are the laboratory data of Xi’an University of Science and Technology from China (correspondence: