
Abstract
GDI (Gasoline direct injection) technology is used in downsized engines for its economy and low emissions. However, if the injection strategy is not set properly, GDI will produce more emissions than conventional gasoline engines. In this paper, the effect of injection timing on GDI engine emissions under optimal phasing conditions was analyzed by using a three-dimensional (3D) computational fluid dynamics (CFD) GDI engine numerical model. The results showed that at medium engine speed and medium load advancing the injection timing from −300 to −290 CAD ATDC resulted in a more efficient and cleaner combustion process, as evidenced by the higher power output, the increased thermal and combustion efficiencies, and the reduced CO, UHC, soot emissions. The raised NOx emissions at advanced injection timing operation corresponded to the high combustion quality. There was a trade-off relation for advancing injection timing strategy. Specifically, an advanced injection timing operation would increase the amount of liquid film formed on the piston and liner, which is not favorable to clean combustion. However, advancing injection timing also provides more time for fuel-air mixing, which is beneficial for the formation of a more homogeneous mixture. The numerical simulations suggested that the advantages of earlier injection timing outweighed the disadvantages and improved engine efficiency, at least for the conditions and the engine investigated here. Moreover, the comparison indicated that changing injection timing also altered the chemical reaction pathways for pollutant species formation. Overall, all of these findings demonstrated that more fundamental work is still needed to understand the effect of injection timing on engine performance.
Introduction
With the increase in vehicle performance requirements and increasingly stringent environmental regulations, new engine technologies have been developed,1,2 such as the application of advanced combustion strategies, 3 alternative fuels,4,5 and engine miniaturization technologies.6,7 Among them, engine miniaturization can well reduce fuel consumption and pollutant emissions,8,9 but can lead to detonation in use due to turbocharging strategies. 10 Therefore, the addition of gasoline direct injection (GDI) technology, which uses the latent heat of vaporization of fuel to reduce the in-cylinder temperature, suppressed the occurrence of detonation. 11 However, with the use of GDI, soot emissions increase due to the partially premixed, partially fuel-rich injection characteristics,12,13 thus worsening the emissions of GDI engines, and therefore the control of the injection strategy is the focus of research.
Heat release from combustion is influenced by injection timing,14,15 which also plays an important role in fuel-air preparation.16,17 When an early injection strategy is used, a homogeneous gas mixture can be obtained during the intake stroke due to high, favorable fuel droplet dispersion. 18 However, if the injection timing is too early, it increases the possibility of fuel spray impinging the cylinder wall, which results in fuel loss. 19 However, when the injection timing is too late, reducing the time for mixture generation results in an inadequate mixture and an increase in incomplete combustion products such as soot. 20 Therefore, there exists an injection timing that allows for the best engine emission performance.21,22 As a result, the existing literature has thoroughly investigated the relationship between engine performance and injection strategies.23,24 For example, Peckham et al. 25 used CFD modeling to analyze the effect of split injection strategy on the mass and number of particles of interest in GDI engine emissions. Wang et al. 26 investigated the combined effect of dilution and injection strategies on engine performance. Moreover, Zhuang et al. 27 found that a significant oil-rich zone would appear in the center of the cylinder at delayed injection timing, which made nitrogen oxides (NOx) emissions increase. Xie et al. 28 found experimentally that the presence of optimal injection timing resulted in the best emissions performance. Further, Firat 29 indicated that compared to single-injection strategy, multistage injection strategies reduce the direct injection spark ignition (DISI) engine emissions such as NOx, carbon monoxide (CO), and unburned hydrocarbon (UHC). Jiao and Reitz 30 evaluated the effect of injection timing on soot distribution, particle size, and number density, using the CFD simulation. Zhang et al. 31 analyzed how the multiple injection strategies and injection timing impact the emissions of the GDI engine. Jiang et al. 32 showed that using lower injection pressure and delayed injection time, GDI can obtain lower CO and UHC. Rodriguez and Cheng 33 experimentally concluded that delayed injection time led to an increase in UHC and CO in the late compression stroke. However, these studies mainly focused on overall performance indicators.34,35 In other words, existing studies still lack a detailed view of the in-cylinder activity caused by different injection timing. 36 The different injection timings change the local fuel-air mixing and subsequently the flame propagation process. 37 The different compositions and temperatures of the local mixtures would then alter the chemical reaction pathways, as reflected by the different concentrations of the contaminant species.38,39 Accordingly, to better understand in-cylinder activities, it is essential for reducing engine-out emission and curtailing the cost of after-treatment devices.40,41 It is also important to note that the GDI engine has trade-off relations in terms of the injection timing. Specifically, an advanced injection timing would let the spray develop in the cylinder volume with a shorter vertical length, which may increase the amount of liquid film. However, advancing injection timing would increase time for fuel-air mixing, which can guarantee a more event-distributed fuel-air mixture before combustion.
Considering the limited research on in-cylinder activities and the trade-off relation,42,43 this study will focus on the interaction of the spray, mixing, combustion, and the spatial distribution of emissions. Future work will investigate the underlying causes of the emission distribution and different reaction pathways locally, which can help find ways to optimize engine combustion events. A series of GDI studies by our group is expected to provide an important reference for the effect of injection timing on in-cylinder activity, which is beneficial for the design of injection strategies and the improvement of GDI engine performance.
Numerical model
In this study, a three-dimensional (3D) computational fluid dynamics (CFD) model of a 2.0L single-cylinder GDI engine was developed. The specific parameters are shown in Table. 1. The geometry includes the intake and exhaust ports, combustion chamber, injection nozzle, spark plug, piston, and cylinder, which is because the focus of this paper is about the in-cylinder combustion emission process of the GDI engine. Due to the axisymmetric structure, half of the engine geometry was taken out for the study in order to reduce the computational effort, as shown in Figure 1. According to Zanforlin and Boretti, 44 Fiore et al., 45 such a modeling approach is acceptable. The fuel injector (six holes) was installed adjacent to the spark plug and injected the fuel after the exhaust valve closing and during the intake stroke. The intake and compression strokes provided the period for air-fuel mixing. When the air-fuel mixture was close to homogeneity, the spark plug mounted on the center of the head ignited the premixed mixture. The early flame was developed after the spark inception process. The fully developed flame propagated toward the unburned mixture and completed the combustion after ∼40 CAD.
Engine specifications.


Engine model geometry and structure.
The CFD model covered turbulence, spray, atomization, ignition, combustion, and chemical reaction mechanisms. Considering the high cost of large eddy simulation and DNS,
46
Reynolds Averaged Navier-Stokes (RANS) is an effective model.
47
The RNG K-
The experimental conditions were conducted at medium engine speed (2000 rpm ± 5 rpm) and medium engine load (21.1 g fuel per cycle that contributed to ∼7.1 bar indicated mean effective pressure (IMEP) with less than 2% coefficient of variation of IMEP (COVIMEP)). The ambient conditions were room temperate and atmospheric pressure. To achieve the medium load, the engine was throttled with an intake pressure of 0.8 bar. Figure 2(a) shows the mode validation. It can be seen that the model predicted pressure agreed well with the experimental data with less than 5% error for all crank angles. Figure 2(b) shows the comparison between the model predicted heat release rate and the experimental data. It can be seen that, despite the small difference, the energy release profile captured the main characteristics of the experimental results, especially the combustion phasing. The small differences between the average experimental data and the simulation results in Figure 2 were probably due to the simplified in-cylinder geometry, the reduced chemical mechanism used, the uniform-distributed boundary and swirl, the homogeneous premixed assumption, and sub-model uncertainties.57,58 However, the CFD model was still considered to be able to predict the activity in the cylinder.
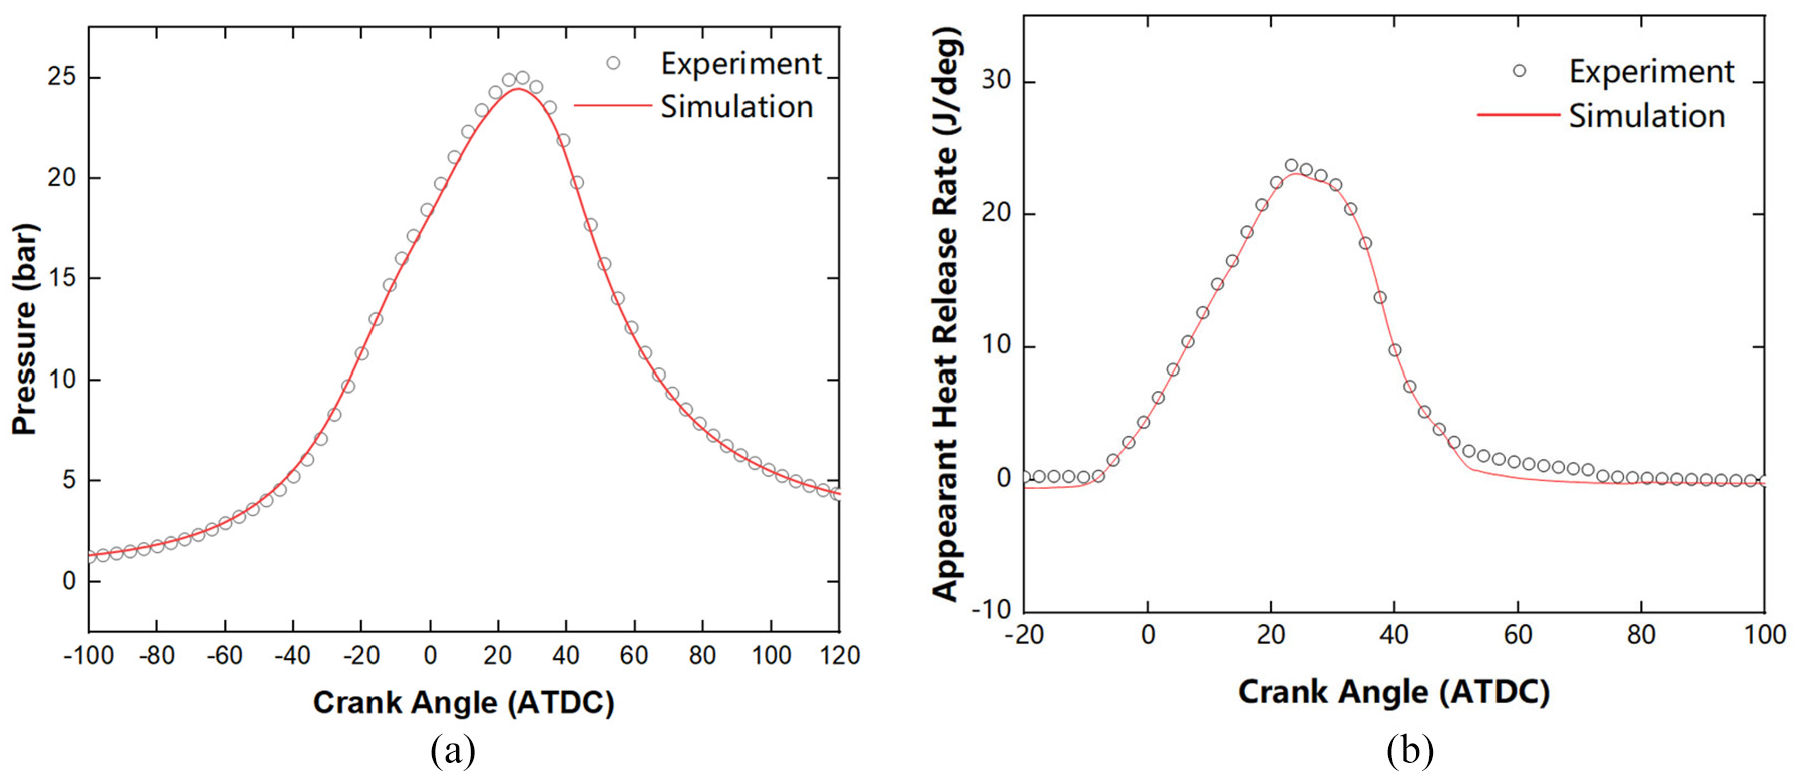
Comparison of experimental results and model predictions (a) cylinder pressure and (b) heat release rate.
The 3D CFD model’s predictive ability59,60 was applied to investigate the injection timing effects. Table 2 shows the detailed simulation operating conditions.
Simulated operating conditions at various injection timings.

Results and discussion
The spark timing sweep investigated in this study included the maximum brake torque timing. As shown in Figure 3, the hump profile of IMEP was obtained regardless of injection timings. It is clear that for the engine speeds and loads (i.e. intake pressures) investigated in this study, −15 CAD ATDC spark timing (ST) is the MBT condition regardless of injection timing. Advancing ST from this optimum condition will advance and increase cylinder pressure prior to top dead center (TDC), which would oppose the upward movement of the piston. Then, more work will be done during the compression stroke against the piston movement compared with optimum ST, which will reduce the amount of dynamic force delivered to the crankshaft. Although retarding ST will allow the cylinder pressure peak to occur later in the expansion stroke, this will reduce the pressure peak and thus reduce the amount of work done to the piston. Most importantly, however, the injection timing effects on in-cylinder activity will be compared at MBT timing. In other words, the GDI engine performance will be compared at 2000 rpm, −15 CAD ATDC ST, and 21.1 mg/cycle amount of fuel at stoichiometry, but at different injection timings from −300 to −270 CAD ATDC compression with 10° increment.
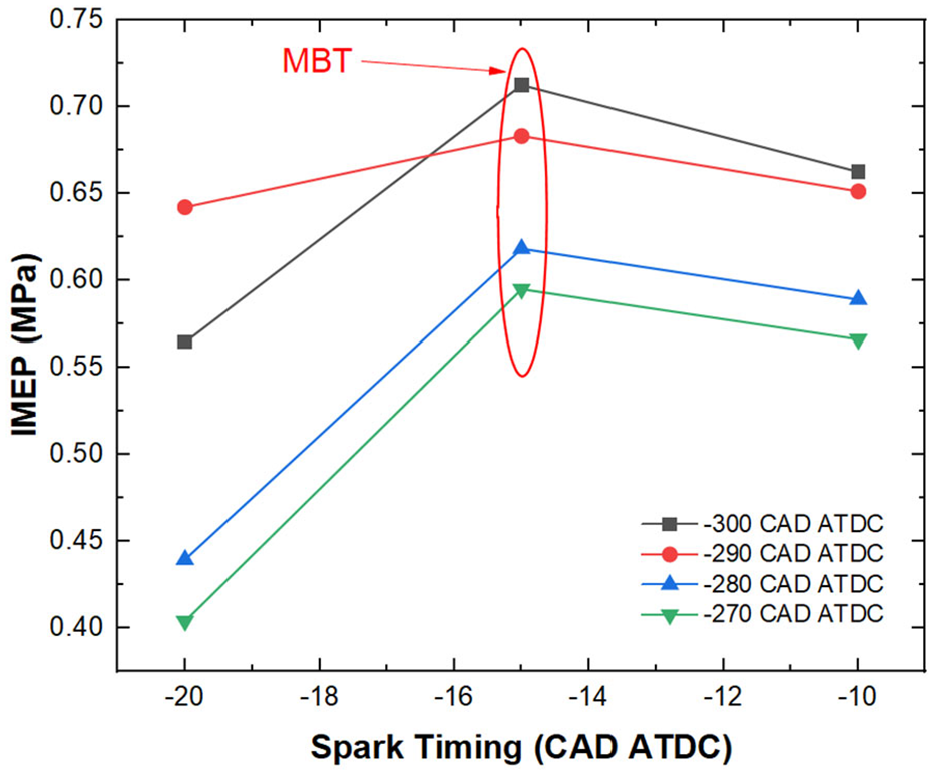
Effects of spark timing on IMEP at different injection timing.
Figure 4 shows the effects of spark timing on emissions at MBT timing. For the CO, UHC, soot emissions, −300 CAD ATDC injection timing is the best operation condition for their performance. Moreover, the NOx emission at the −300 CAD ATDC injection timing was higher than others, proving the better combustion efficiency. As expected, advancing the injection timing contributed to cleaner emissions for the engine speed and load investigated in this study.

Effects of injection timing on engine emissions at MBT: (a) CO and NOx emissions and (b) soot and UHC emissions.
Figures 3 and 4 together present the GDI engine power output (or efficiency) and emissions. It is of interest to investigate the root reasons that cause the performance difference. Firstly, the history of in-cylinder situations, including the pressure, heat release rate, and emission traces, will be studied. The results are plotted in Figure 5. It can be seen that there was a huge gap between −280 CAD ATDC injection timing and −290 CAD ATDC injection timing. However, the difference between −290 CAD ATDC injection timing and −300 CAD ATDC injection timing (or between −280 CAD ATDC injection timing and −270 CAD ATDC injection timing) was smaller. As a result, these four injection timing cases can be divided into two groups: the advanced IT (injection timing) conditions and retarded IT conditions.

History of in-cylinder conditions at different injection timings: (a) in-cylinder pressure, (b) heat release rate, (c) NOx emissions, (d) CO emissions, (e) UHC emissions, and (f) soot emissions.
Figure 5(a) shows cylinder pressure traces at MBT at different injection timings. It can be concluded that advanced IT increased the cylinder pressure, despite the peak pressure location being slightly retarded. The raised cylinder pressure was attributed to the higher power output (i.e. higher IMEP). Figure 5(b) shows the effect of IT on heat release rate. It can be seen that advanced IT accelerated the kernel inception process and the fully developed turbulent flame propagation process, as evidenced by the faster increasing heat release rate. The location of maximum heat release rate was almost identical regardless of injection timing. However, advanced IT increased the peak heat release rate. The retarded IT increased the magnitude of late combustion, which was not favorable to efficient combustion, as evidenced by the higher heat release rate from 40 to 70 CA ATDC. The inefficient burn of delayed IT cases was also reflected from the combustion phasing. It can be seen that retarded IT extended the combustion duration. In detail, advanced IT cases finished the combustion process at 60 CA ATDC, while the delayed IT conditions contributed to the end of combustion at 70 CA ATDC. The cylinder pressure and heat release rate indicated that advanced IT conditions provided more optimal conditions for chemical reactions: higher pressure and higher temperature. Figure 5(c) shows the effect of injection timing on NOx formation. Oxygen radicals can further develop the NOx generation reaction, and therefore at −290 and −300 CAD ATDC injection timing, so more NOx emissions are generated at −290 and −300 CAD ATDC injection timing due to a higher temperature and higher oxygen radical concentration. Figure 5(d) shows the effect of injection timing on CO formation. It is clear that CO emissions are increasing in the −270 and −280 CAD ATDC injection timing groups, while there is a peak in the −290 and −300 CAD ATDC injection timing groups, with a clear downward trend in CO emissions after 40 CAD ATDC. In contrast, the retarded IT cases experienced a continuously increasing trend of CO species after 40 CA ATDC, and the increasing trend almost terminated at 70 CAD ATDC, which corresponded to the end of obvious heat release timing. Probably due to the freezing of chemical reactions, the retarded IT conditions did not have further late oxidation to CO emission. The most important information was that the change in IT altered the reaction pathways of important species, such as the CO emissions discussed here.
Figure 5(e) represents the effects of injection timing on UHC formation. At −290 and −300 CAD ATDC, the UHC decreases rapidly with combustion with less residue, while at −270 and −280 CAD ATDC, the UHC dropped more slowly and existed some residual. The UHC reflects the extent of combustion and it can be seen that a later injection advance angle results in more complete combustion. Figure 5(f) shows the effects of injection timing on soot formation. It can be seen that as the injection timing advanced, more soot emissions are produced due to the formation of liquid film. The hydroxyl (OH) radicals are usually used to oxidize soot emissions. The difference in engine emission performance between the two injection timing groups provides a clearer picture of the soot generation process and the amount of soot produced. Specifically, for the retarded IT conditions, more OH radicals were generated but more soot was formed. As a result, the engine-out soot concentration for the retarded IT condition was almost seven times higher than that of the advanced IT condition.
Figure 5 discussed the in-cylinder thermal conditions and the history traces of pollutant species. All the information suggested that advancing IT would contribute to a more efficient and cleaner combustion process. Such conclusions can be imagined based on the engine combustion knowledge. A benefit of 3D CFD simulation is to provide in-cylinder activities.61,62 As a result, it is of interest to investigate how the injection timings affected the fuel-air mixing, the formation of liquid film, the flame propagation process. In addition, numerical results can provide characteristics of the distribution of pollutant species, which can provide a basis for in-cylinder emission control and help provide direction for optimizing in-cylinder combustion.63,64
The equivalence ratio is presented at −15 CAD ATDC for the four injection timings in Figure 6.Fuel-rich areas appeared on the inlet port side and the upper part of the combustion chamber. This uneven distribution led to inefficient combustion mentioned later. And at the earlier injection timing, the fuel mixture at spark time was more uniform as expected. As mentioned before, these four IT conditions can be divided into the advanced IT case and the retarded IT case. As a result, −300 CAT ATDC IT and −270 CAD ATDC IT will be primarily used to represent the advanced and delayed IT when indicating the IT effects on the spatial distributions of important parameters inside the chamber.

Distribution of equivalence ratio at spark timing at different injection timing.
Figure 7 presents the development of the spray at the EOI (end of injection). The spray balls were colored by the velocity, while the formed liquid film on the piston and liner were colored by the equivalence ratio. Due to the excessively advanced IT, the spray at −270 CA ATDC IT was fully developed and highly fragmented, with many small fuel droplets and long penetration distance. In contrast, the injection fuel at −300 CA ATDC IT was concentrated in the ring area of the piston, where significant impingement occurs and the spray form is dominated by larger droplets.

Distribution of injection fuel at the end of injection at different injection timing.
Besides the injection process, the mixture formation process also influenced the equivalence ratio in the cylinder as shown in Figure 8. During the movement of the piston to the TDC, the mixture gathered at the top of the piston expanded under the airflow due to the rise in air pressure, causing the reduced local concentration. Thanks to the longer mixing time, when −300 CAD ATDC IT, the mixture in the cylinder was more homogeneous and less concentrated.

Effect of injection timing on mixture formation at several CAD.
The uneven distribution of the mixture would affect the kernel inception and flame propagation processes, which corresponded to the heat release rate. Figure 9 shows the effects of injection timing on the flame propagation. The flame front which was defined as the surface where G = 0 was utilized in Figure 9, colored by turbulent flame speed which was the indicator combustion intensification. At 5 and 15 CAD ATDC, the shapes of flame front at different IT were similar, indicating the similar kernel inception and early flame development process. With the advanced injection timing, the fully developed turbulent flame speed increased, indicating that the more suitable combustion environment existed caused by the more even mixture mentioned in Figure 6. When the combustion almost finished at advanced IT cases, the combustion process with retarded IT continued, and propagated very slowly or even stopped, and then the mixture was excessively gathered in some regions, resulting in the differences in combustion efficiency (i.e., 84% at −270 CA ATDC IT and 98% at −300 CAD ATDC IT). It can be seen that the flame front shapes of advanced IT cases and retarded IT cases were similar, suggesting that the fuel-rich regions were almost identical and that the only difference was the level of homogeneity.
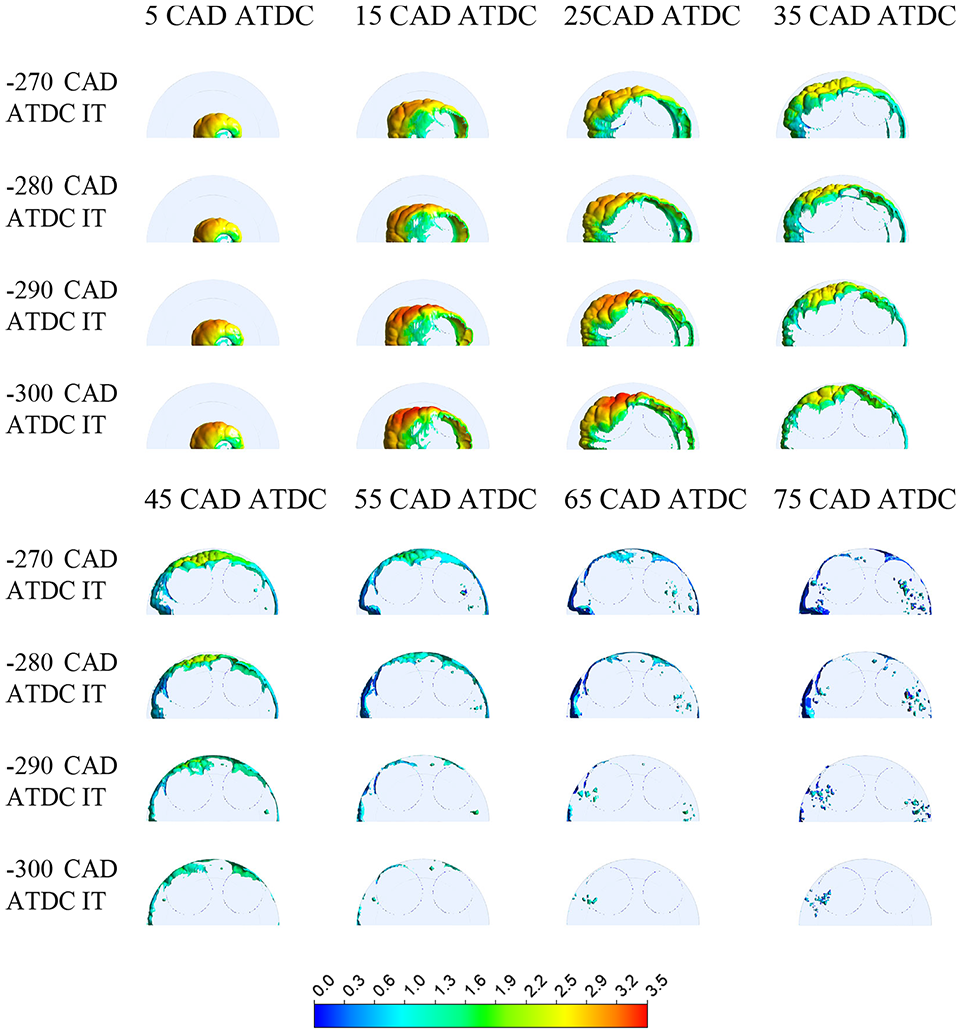
Effects of injection timing on the flame propagation.
As mentioned before, IT affected the reaction pathways. It is of interest to investigate the distribution characteristics of the emissions. It is also important to mention that the NOx, CO, and UHC were predicted by the chemical mechanism (59 species and 437 reactions). While the soot emissions were simulated by the two-step semi-empirical soot model. The precursor of soot (i.e., C2H2) was formed also based on the imported chemical mechanism. When discussing the emission distributions, the important reactions related to pollutant species formation will also be presented.
The NOx comes from N2 in the air, where the NO generation is sensitive to temperature, thus NO generates in the high temperature combustion regions and NO2 generates in the oxygen-rich regions. Generally, the conditions of NOx generation in the cylinder are highly dependent on the high temperature and oxygen-rich conditions and a abundant reaction time. Among the NOx, NO is the highest, so NO is used instead of NOx in the subsequent analysis. The extended Zeldovich mechanism is incorporated into the chemical mechanism to perform the NO calculations, the equations are shown in equations (1)–(3), respectively.


From Figure 5(b), it can be seen that at 60 CAD ATDC, the combustion nearly finished at different injection timings, and the emissions at that time are compared. Besides, the −270 and −300 CAD ATDC IT are selected for the analysis of the full process of emissions production. Figure 10 represents the NOx emissions at 60 CAD ATDC at IT. It can be seen that the −300 CAD ATDC IT corresponded to more NOx gathered on the exhaust valve side and in the center of the cylinder. With the delay of the injection timing, the NOx emissions decreased, but were more concentrated and gathered at the exhaust port side in the cylinder.

NOx emissions at 60 CAD ATDC at different injection timing.
Figure 11 shows the development of NOx at two typical injection timings. Figure 12 shows the development of oxygen radicals at the corresponding operation conditions. It can be seen that in the regions where oxygen radicals were more concentrated, representing higher oxidation, NOx emissions generated. At 60 CAD ATDC, the oxygen radicals at −300 CAD ATDC injection timing are already less due to full combustion, while −270 CAD ATDC injection timing still has some residuals.

Effects of injection timing on NOx emissions at several CAD ATDC.

Effects of injection timing on O radicals emissions at several CAD ATDC.
The CO emissions generation occurs mostly under low temperature and oxygen deficiency conditions because the intermediate production of fuel combustion cannot be further oxidized with oxygen to form CO2. Therefore, the investigation of CO concentration was used to analyze the fuel-air mixture concentration at different injection timings and the degree of complete combustion. CO emissions are the incomplete combustion production that happens in fuel-rich regions. Under the excessive oxidation environment, the CO can turn to CO2 as equation (4) shows:

Figure 13 represents the CO emissions at 60 CAD ATDC at different injection timings. Figure 14 shows the development of CO at two typical injection timings. It can be seen that the late injection timing made the CO emissions increase greatly and be concentrated near the wall of the cylinder intake port side, where the fuel-gas mixture at ignition was higher, as shown in Figure 6, which indicated that part of the overly concentrated mixture caused more CO emissions. Figure 14 shows CO emissions were more at −270 CAD ATDC injection timing and became more concentrated as the combustion progressed, while CO emissions are less at −300 CAD ATDC injection timing and became more dispersed as the combustion progressed. Combining Figure 12, Figure 5(c) and (d), it can be seen that oxygen radicals have a suppressive effect on CO generation. At the beginning of combustion (at 0–10 CAD ATDC), due to the high temperature of the spark plug ignition center, the concentration of oxygen radicals was high, where combustion was concentrated, and therefore the amount of CO emissions was concentrated in the center of the spark plug. When the combustion was fully developed (at 30–60 CAD ATDC), to both of advanced and retarded IT, the CO was concentrated where oxygen radicals were fewer because the combustion was not sufficient. Combining the mixture formation process as shown in Figure 8, at −300 CAD ATDC injection timing, the relatively strong turbulent motion in the cylinder allowed more oxygen to fully oxidize with CO, resulting in a low concentration of CO emissions.

CO emissions when 60 CAD ATDC at different injection timing.

Effects of injection timing on CO emissions at several CAD ATDC.
High soot emissions are still a challenge for the GDI engines because of the local fuel-rich region and the diffusion combustion. Due to the insufficient evaporation and mixing, inhomogeneous premixed combustion exists. Besides, injection strategy influences the fuel-air mixture formation process, and then soot emissions will generate with the fuel impingement and over-rich fuel region caused by the too late injection timing. Therefore, it is necessary to investigate the effect of different injection times on soot emissions.
The acetylene intermediate theory is a hypothesis to explain the precipitation of soot in the gas phase. It assumes that diesel droplets are completely evaporated and vaporized before combustion, while the fuel in the gas phase undergoes cracking to produce unsaturated hydrocarbons, such as ethylene and acetylene. Ethylene undergoes dehydrogenation to produce acetylene, which generates soot by continuing the dehydrogenation process. Equations (5) and (6) can explain this process.


Figure 15 shows the soot emissions at 60 CAD ATDC at different injection timings. Figure 16 represents the effects of injection timing on soot emissions at several CAD ATDC. After 30 CAD ATDC, soot was generated where the oxygen radicals were scarce. It can be seen that for the early injection timing, the soot emissions gathered around the intake and exhaust ports, while for the late injection timing, the soot emissions were concentrated on the intake side of the cylinder.

Soot emissions at 60 CAD ATDC at different injection timing.

Effects of injection timing on Soot emissions at several CAD ATDC.
Most of the UHC emissions in the exhaust gas are generated by wall quenching effects caused by the interstitial volume in the combustion chamber or by excessive concentration of the local mixture, slit effects, wall area carbon, and deposits in the combustion chamber.
Besides, UHC emissions generation is influenced by the injection strategy, affecting the homogeneity of the fuel-air mixture. Later injection timing does not make better use of airflow motion and the fuel-air mixing time is reduced, resulting in some of the under-mixed fuel gathering at the top of the piston on the upstream side of the compression stroke.
Figure 17 shows the effects of injection timing on UHC emissions. The UHC included C1–C8 species. Here, CH4, C2H2, C3H6, and C4H8 were selected to represent the UHC emissions. At late injection timing, more UHC emissions were generated because of the less time for air-fuel mixture formation. The distribution of UHC emissions was similar to CO emissions and soot emissions, especially for the CH4 and C2H2. Combing the flame front in Figure 9, UHC emissions concentrated where the combustion stopped for the retarded IT cases. UHC, CO, and soot emissions altogether reflected the extent of the incomplete combustion. Generally, injecting fuel in the middle of the intake stroke to take advantage of strong turbulent movement in the cylinder. Thus, allowing oxygen to mix well with fuel, which was critical to reducing UHC emissions.

UHC emissions at 60 CAD ATDC at different injection timing.
Figures 10–17 together show the emission distribution characteristics. It can be seen that the less time available for fuel-air mixing played the important roles information of the uneven distribution of the mixture, which resulted in the less efficient burn and the increased level of incomplete combustion. In fact, advanced IT cases had a shorter vertical distance between the head and the piston, which should form more film mass, which is not favorable for clean combustion. However, the results indicated the advantages of advancing IT defeated such a drawback. In detail, advanced IT conditions provided more time for fuel-air mixing and the less liquid film was left at spark timing. A more even air-fuel distribution guaranteed a better combustion process which helped to boost the engine efficiency. The 3D simulation results guaranteed the trade-off relation to be well understood. Overall, all these results indicated that more fundamental studies of in-cylinder activities, such as the one investigated here, are necessary to boost GDI engine efficiency.
Summary and conclusions
This work has done some research about the effect of injection timing on the in-cylinder activity. Besides, the emissions generation and spatial distribution were also discussed. Generally, delayed injection timing caused less time for fuel-air mixing, leading to an uneven mixture, and therefore the combustion developed not fully. Thus, CO, soot, and UHC emissions increased and NOx emissions decreased as the lower oxygen radicals and temperature. The main findings are summarized as follows:
Compared with different spark timings, −15 CAD ATDC was the MBT for this operation conditions, investigated in this study.
With the delayed injection timing, the fuel mixed more unevenly because of the weaker in-cylinder tumbling flow and less mixture formation time. At the IT of −300 CAD ATDC, the in-cylinder mixture was the most uniform among all the injection timings.
With the retarded injection timing, the NOx decreased by 60% in the range of −300 to −270 CAD ATDC injection timing. The uneven mixture led to incomplete combustion, which decreased the in-cylinder temperature, causing the oxygen reaction is not complete, and thus suppressing the NOx emissions generation.
As injection timing was delayed, the CO emissions increased four times in the range of −300 to −270 CAD ATDC injection timing. Combined with weaker turbulent flow motions and mixture uniformity, CO emissions increased.
With the delayed injection timing, the soot emissions increased 39 times in the range of −300 to −270 CAD ATDC injection timing. Where the oxygen radicals were scarce, the C was no longer oxidized.
With the retarded injection timing, the UHC emissions increased 122 times in the range of −270 to −300 CAD ATDC injection timing. The distribution of UHC emissions was similar to CO and soot emissions because they all can indicated the level of incomplete combustion.
This research evaluated the GDI performance and emissions at different spark timings, the result indicated that MBT is −15 CAD ATDC. In the following part, the effects of injection timings on emissions characteristics and spatial distribution were discussed. Unlike existing studies, details of the in-cylinder combustion and flow properties at varied injection timings were provided.
Footnotes
Appendix
Handling Editor: Chenhui Liang
Declaration of conflicting interests
The author(s) declared no potential conflicts of interest with respect to the research, authorship, and/or publication of this article.
Funding
The author(s) disclosed receipt of the following financial support for the research, authorship, and/or publication of this article: The work was jointly funded by the Natural Science Foundation of Zhejiang Province (LQ20E060003), the Project Teacher Research Fund Project (J-202116), the Projects of Hangzhou Agricultural and Social Development Research Program (20201203B128, 20212013B04), and the 2021 “Teacher Professional Development Program” for domestic visiting scholars in universities (FX2021105).