
Abstract
Wheel and rail wear seriously affects the safety and reliability of train operations. In this study single-carriage and double-carriage models considering the connecting unit of a high-speed train are developed to investigate the normal forces, lateral forces, and lateral displacements of wheelsets. Based on the results from these models, the Archard wear model is employed to predict the wheel wear. In addition, based on the daily measured data, a nonlinear autoregulatory (NAR) model and a wavelet neural network (WNN) model are developed to predict the wheel wear over a longer time period. The simulation results show that, compared with the single-carriage model, the normal forces, lateral forces, and lateral displacements of the wheelsets close to the connecting unit in the double-carriage model increase to a certain extent dependent on the speed. The wheel wear predictions show that the wheel wear on the wheelsets near the connecting unit is slightly larger than on the wheelsets far from the connecting unit. Based on the mean square error, the NAR model has somewhat better performance in the wheel wear prediction than the WNN model. The research results represent an important contribution to the maintenance and safe operation of high-speed trains.
Introduction
As one of the most important factors affecting the reliability of train operation, wheel and rail wear directly influences the wheel–rail contact state and the dynamic performance of train operation. Severe wheel or rail wear may cause train derailment. However, predicting wheel wear remains a huge challenge at present.
The earliest wear model was proposed by Archard 1 from the wear tests of rubber materials in 1953. Based on the Archard wear model, Jendel 2 computed the magnitude of sliding distances by multiplying the slip velocity with time for each wheel element in contact with the rail in order to calculate the wheel profile wear more accurately. Kalker3,4 proposed an algorithm called FASTSIM for the simplified theory of wheel-rail rolling contact and the algorithm was used for the fast calculation of wheel wear with sufficient accuracy. Wheel–rail interactions and wheel wear are affected by many factors, such as wheel–rail contact conditions, rail properties, and train operation environment. Hardwick et al. 5 conducted double-disk tests in dry, water- and grease-lubricated conditions, and hence determined the wear processes taking place under various contact conditions. Aceituno et al. 6 studied the influence of rail flexibility on wheel wear prediction based on an energy method and examined the effect of the rail deformation on the wear results. Bezin et al. 7 believed that the track model should contain discrete non-linearities, and then studied the effect of rail roll degree of freedom (DOF) on the wheel-rail contact condition; the rigid body track model in the software tool VI-Rail was modified to fully take into account the rail roll DOF in combination with the non-linear on-line contact algorithm. Apezetxea et al. 8 reduced computational cost by substituting dynamic simulations with quasi-static ones and representing the whole track route in a reduced number of characteristic features.
In recent years, numerous finite element models have been developed to conduct wheel-rail contact analysis. Guan et al. 9 developed a 3D equilibrium model of a wheelset that considered the geometrical contact and non-linear creep force between the wheel and rail and a derailment criterion was proposed based on the curve-fitted equivalent friction coefficients. Ignesti et al.10,11 developed a model that was made up of two mutually interactive but separate units: a vehicle model for the dynamic analysis and a wear model for wear estimation; the combined model was used to predict the wheel and rail wear profiles. Bevan et al. 12 presented a model to predict the deterioration rates of the wheel tread based on rolling-contact fatigue damage. Huang et al. 13 established an analytical model for accurately determining the contact position and a slice-based model to calculate the contact stress on a contact point, making the calculation more accurate. Alarcón et al. 14 studied the influence of the friction coefficient varying from 0.2 to 0.7 on the power dissipation model in the wheel-rail contact. Ma et al. 15 proposed a novel modeling strategy: 3D explicit finite element analysis was associated with 2D geometrical contact analysis and an adaptive mesh refinement technique, which was able to achieve a good balance between accuracy and calculation efficiency. Luczak et al. 16 established a new wear model that could imitate complex wheel motion based on the finite element method. However, the application of this model was limited by its long computation time. Peng et al. 17 investigated the influence of wheelset flexibility on polygonal wear of wheels based on a flexible wheelset model. Tao et al. 18 developed a new online model for wheel wear prediction that takes into account the track flexibility and studied the effect of the wheel profile updating strategy on the wheel wear.
At present, an increasing number of artificial intelligence (AI) technologies have been used in the field of rail and rapid transit. 19 However, the AI prediction of wheel wear is relatively unexplored compared with other applications of the AI approach. Shebani and Iwnicki 20 used a nonlinear autoregressive model with exogenous input neural network to predict the wheel and rail wear. Test data from a two-disk rig were used to train the network and the accuracy was assessed according to the mean absolute percentage error.
In most previous studies, the wheel wear predictions were based on a single-carriage model, 21 which may generate errors due to the significant difference between the single-carriage model and the real structure of a high-speed train. In order to be more consistent with the actual situation, a double-carriage model has been developed in the present study by introducing a connecting unit between two carriages. The model is used to study the influences of the constant train running speed, 22 train operation route, and wheel position on the normal forces, lateral forces, and lateral displacements at the wheel-rail interface based on the rigid body dynamics analysis in the SIMPACK modeling software.11,23,24 In addition, the wheel wear is predicted based on the Archard model. 25 Considering that prediction of wheel wear by using AI is limited in previous studies, the non-linear auto-regulatory (NAR) neural network and the wavelet neural network (WNN) are employed in this study to predict the high-speed train wheel wear, and the predictions are validated by comparison with the wheel wear data measured by the railway administration. Such validated predictions could be very useful for the maintenance and safe operation of high-speed trains.
Train model development based on SIMPACK
The dynamic models of the CRH380BL high-speed train are established by using SIMPACK, a well-known multi-body simulation software package developed by INTEC Gmbh. The simplified train model utilizes the basic elements of the SIMPACK software such as body, constraint, joint, and force. A model of a single train carriage is first developed with two bogies and four sets of wheel pairs. The wheel tread of the CRH380BL high-speed train is the S1002CN profile, an improved version of the European standard S1002 tread, and the matching track has the CHN60 profile. A single-carriage multi-body dynamics model of the CRH380BL high-speed train is shown in Figure 1(a).
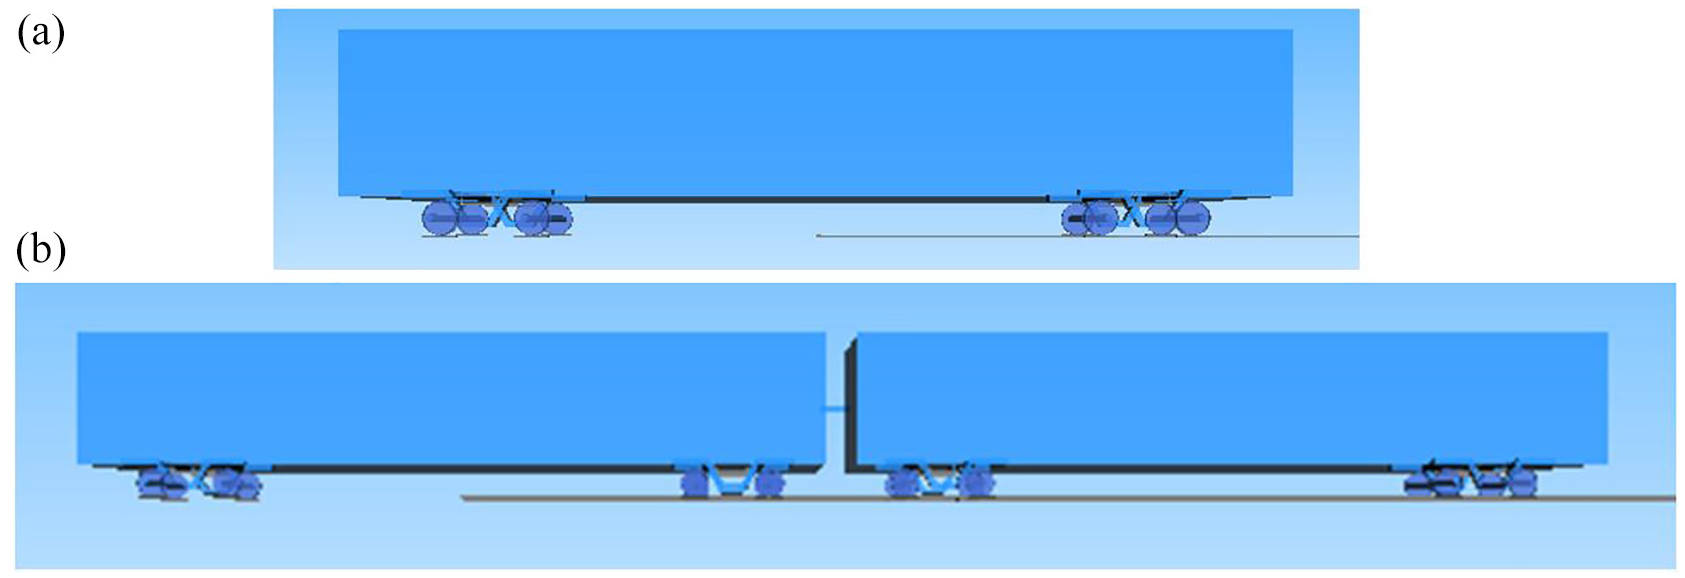
Train models: (a) single-carriage model and (b) double-carriage model.
Considering the influence of the interaction between two carriages on the wheel contact and wheel wear, a multi-carriage train dynamics model is required for more accurate dynamic simulation and wear analysis. In this study, a double-carriage train model is developed instead of a complete train model, in order to speed up the multi-body dynamics simulation. A connecting unit is added between the two single-carriage models, which is simplified as a connecting rod with both stiffness and damping. The double-carriage train model is shown in Figure 1(b).
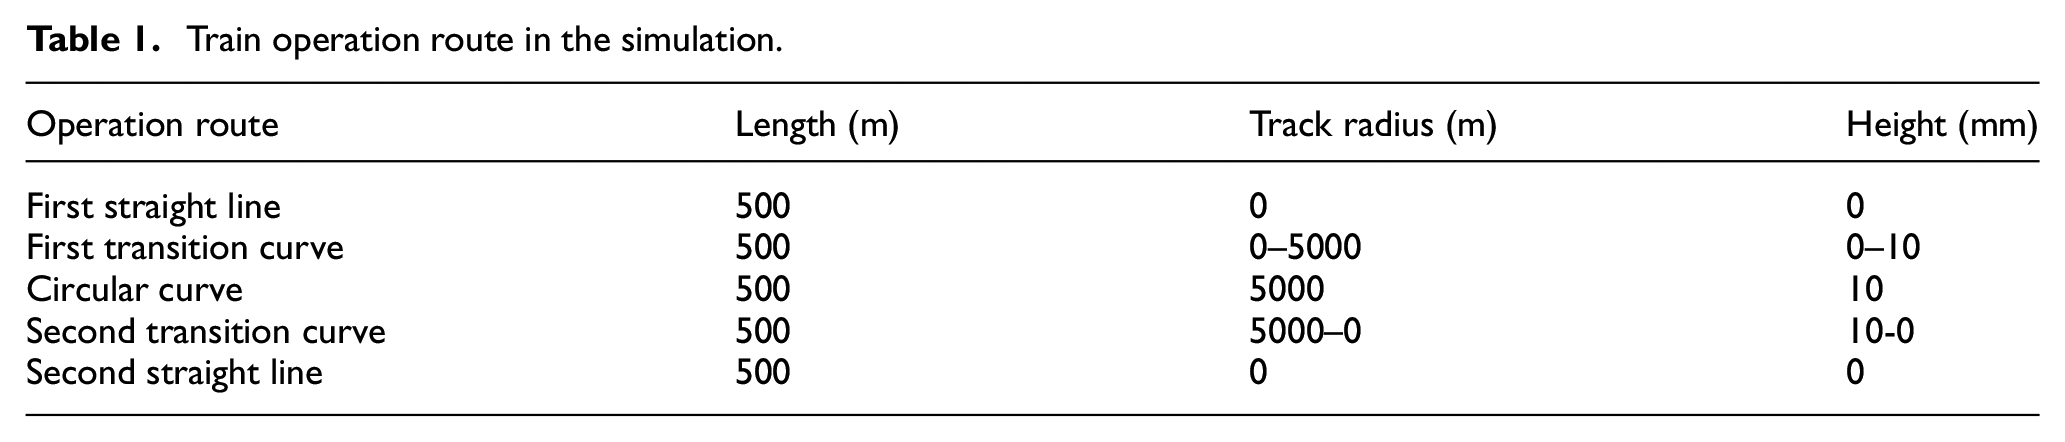
To study the operation of the train model on different lines, a track route is designed that consists of two straight lines, two transition curves, and one circular curve. The train moves from a straight line to a transition curve followed by a circular curve, and then through a transition curve return to a straight line. The detailed parameters of the simulated track route are shown in Table 1.
Train operation route in the simulation.
To more clearly discuss the relationship between wheel wear and wheel positions, the wheels in the single-carriage model and double-carriage model are numbered, as shown in Figure 2. For example, wheel 1 in Figure 2(a) represents the left wheel of the front wheelset (wheelset I) in the front bogie (bogie 1) and wheel 6 is the right wheel of the front wheelset in the rear bogie (bogie 2). Wheel 1 in Figure 2(b) represents the left wheel of the front wheelset (wheelset I) in bogie 1 of the first carriage (carriage 1), and wheel 12 represents the right wheel of the rear wheelset (wheelset VI) in bogie 3 of the second carriage (carriage 2).
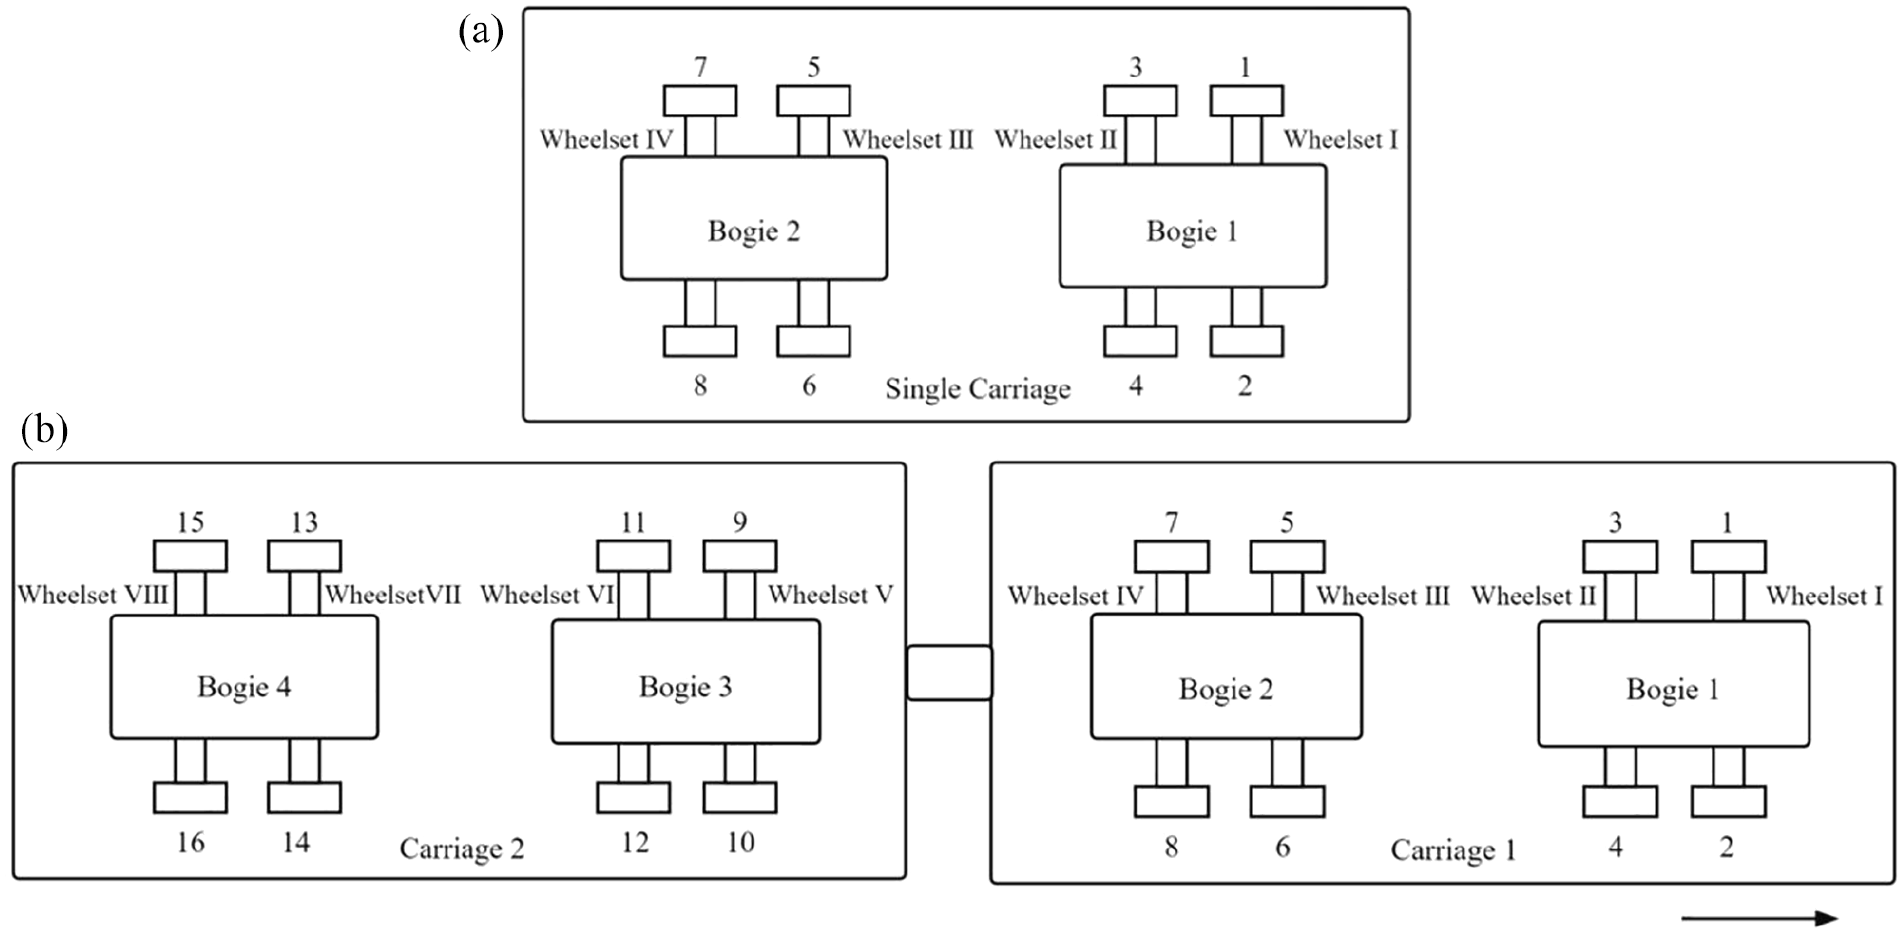
Illustration of the arrangement of wheels: (a) single-carriage model and (b) double-carriage model.
Results from SIMPACK dynamics analyses
Single-carriage train model – normal contact forces
Figure 3 shows the simulated normal contact forces on the wheels of the front bogie at 200 and 300 km/h, respectively. At 200 km/h operation speed, it can be seen that the normal contact forces on wheel 2 and wheel 3 remain unchanged in the straight lines and circular curves, and when the train enters the transition curve, the forces drop slightly at first and then gradually rise; the normal contact forces on wheel 1 and wheel 4 again remain unchanged in the straight lines and circular curves, but when the train enters the transition curve, the forces slightly rise at first and then gradually drop.

Normal forces of wheel-rail interface in the single-carriage model at 200 km/h (a and b) and at 300 km/h (c and d).
When the train operation speed is 300 km/h, the normal contact forces of all wheels remain unchanged in the straight line section; as the train enters the transition curve, the normal contact forces on the left wheels (wheels 1 and 3) gradually increase and the forces on the right wheels (wheels 2 and 4) gradually decrease; in the circular curve, the normal contact forces remain nearly unchanged; in the second transition curve, the normal contact forces on the left wheels (wheels 1 and 3) gradually decrease and the forces on the right wheels (wheels 2 and 4) gradually increase. The predicted maximum normal forces acting on all wheels of the single-carriage model at both simulated operation speeds are shown in Table 2.
Maximum normal force of single-carriage and double carriage model on circular curve at 200 and 300 km/h.

Single-carriage train model – lateral forces and displacements
When the train is turning, the center of the wheelset shifts laterally relative to the center of the track. The lateral movement of the wheelset changes the wheel-rail contact area, which has a significant effect on the wheel-rail contact characteristics. A large amount of lateral movement may cause the wheel flange to contact the rail and hence cause side wear to the rail and wheel, which has a significant effect on the stability and maximum speed of the train. The simulated maximum lateral force and lateral displacement of the single-carriage model are shown in Table 3.
Maximum lateral force and lateral displacement of wheelset in the single-carriage and double-carriage models.

It can be seen from Table 3 that at both speeds the lateral forces on the wheelsets of bogie 2 (wheelset III and IV) are similar to those on the wheelsets of bogie 1 (wheelset I and II) respectively. When the train runs at a speed of 200 km/h on the circular track, the lateral forces on different wheelsets of the same bogie act in opposite directions: the lateral force of the front wheelset acts toward the outside of the circular track, whereas the lateral force of the rear wheelset acts toward the inside of the circular track. The maximum lateral force of the front wheelsets (wheelsets I and III) is 4020 N and the maximum lateral force of the rear wheelsets (wheelsets II and IV) is 4330 N. In terms of lateral force direction, when the vehicle speed is 300 km/h, the gravity component acting toward the inner side of the curve is not able to balance the centrifugal force due to the higher speed, so all wheelsets are subject to the lateral force acting toward the inner side of the circular curve. The maximum lateral force of the front wheelsets (wheelsets I and III) is 4035 N and the maximum lateral force of the rear wheelsets (wheelsets II and IV) is 12,020 N.
When the train speed increases from 200 to 300 km/h, the maximum lateral displacement of wheelsets I and III (the front wheelsets of the single carriage model) decreases, whereas the maximum lateral displacement of wheelsets II and IV (the rear wheelsets of the single carriage model) increases.
Double-carriage train model – normal contact forces
A high-speed train consists of multiple carriages. A coupler and a buffer device are arranged between the two carriages to ensure the stability of the train. A considerable difference exists between the above single-carriage train model and the actual situation. To more closely approximate the actual situation, this study establishes a double-carriage train model. This model includes a connecting device between the carriages, which makes the model more consistent with the actual situation. In this analysis, the coupler and buffer are simplified as a connecting unit with constant stiffness and damping. Actually, the stiffness and damping parameters of the buffer are changed during the train operation. However, in order to simplify the calculation, after trial-and-error studies in the SIMPACK simulation, the stiffness and damping parameters were chosen to be k = 150 kN/m and c = 70 kNs/m.
The SIMPACK simulation of the double-carriage train demonstrates that the normal forces of the front bogie 1 of carriage 1 and the rear bogie 4 of carriage 2 are not much different from the corresponding positions on the single-carriage model, thus they are not presented in this section. The normal forces of bogie 2 in carriage 1 and bogie 3 in carriage 2 at speeds of 200 km/h and 300 km/h are respectively shown in Figures 4 and 5. The maximum normal forces acting on all wheels in the single-carriage and double carriage models on the circular curve at 200 km/h and 300 km/h are shown in Table 2.

Normal contact forces of wheel-rail in the double-carriage model at 200 km/h.
Normal contact forces of wheel-rail in the double-carriage model at 300 km/h.
Figure 4 shows that at a speed of 200 km/h, the normal contact forces of wheels 5, 6, 7, and 8 in bogie 2 is consistent with that of wheels 9, 10, 11, and 12 in the corresponding position of bogie 3. Therefore, this section mainly compares the normal forces of wheels of bogie 2 in the single carriage with those of bogie 2 in the double-carriage model. In the single-carriage model, the minimum normal contact force of wheel 5 is 48,729 N, but the normal contact force in the corresponding position (wheel 5) of the double-carriage model is 48,849 N, which means that the normal force increases by 198 N in the double-carriage model. In a similar manner, the normal contact forces of the other wheels (6, 7, and 8) in the double-carriage are increased in comparison with those in the single-carriage model.
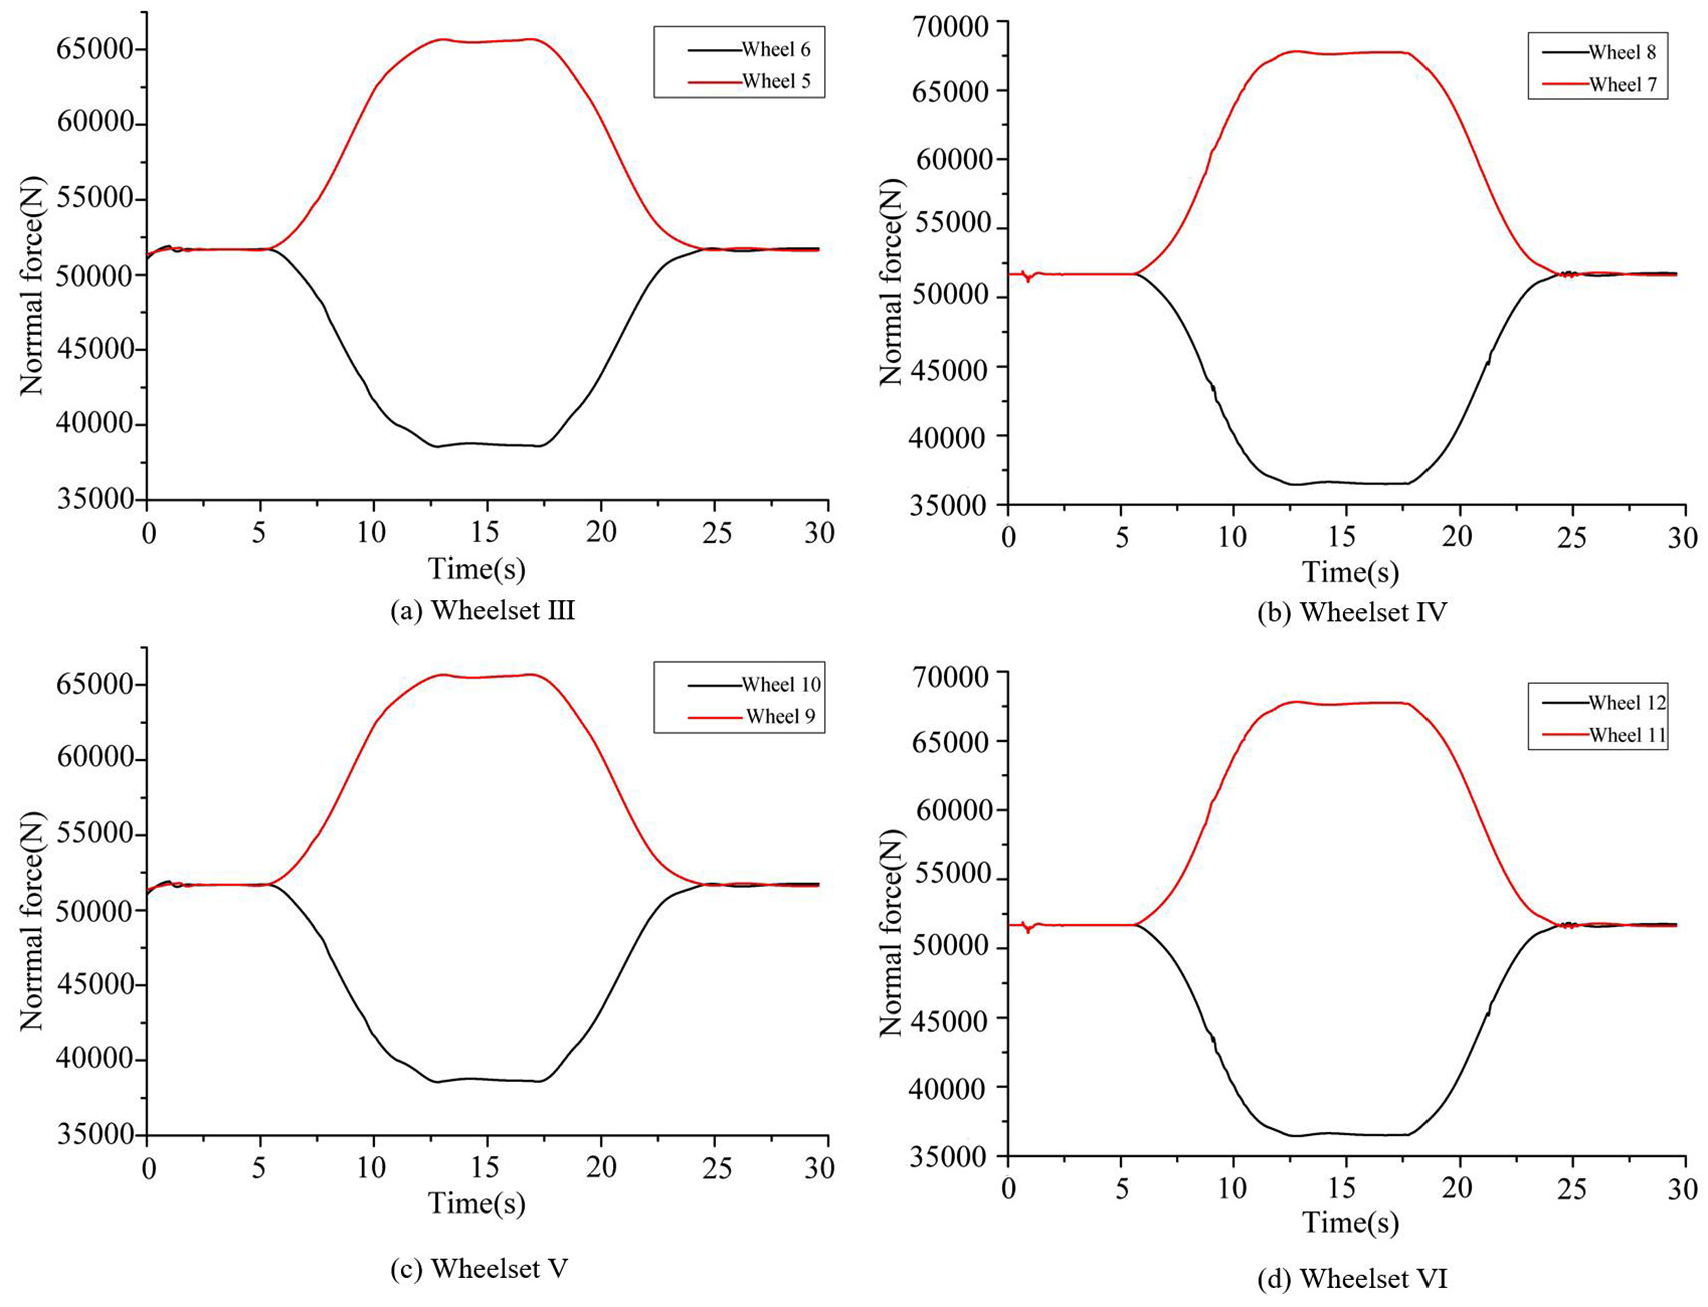
As shown in Figure 5, when the train speed is 300 km/h, the normal contact forces of the wheels in bogie 2 are consistent with those of wheels in the corresponding position in bogie 3. The maximum normal contact force of wheel 5 in the single-carriage model is 65,014 N; while the normal contact force in the corresponding position (wheel 9) of carriage 2 in the double-carriage model is 65,521 N. Thus, the normal force of wheel 9 in the double-carriage model increases by 507 N compared with that in the single-carriage model. In the same way, the normal contact forces of the other wheels (6, 7, and 8) in the double-carriage model are increased in comparison with those in the single-carriage.
In the single carriage model, wheelsets I and III or wheelsets II and IV have similar normal forces. This indicates that the position of the bogie has insignificant effect on the normal force of the wheel-rail contact. However, a significant difference is observed between the normal forces on the wheels of bogies 2 and 3 in the double-carriage model and those on the wheels of bogies 1 and 2 in the single-carriage model. The maximum normal force of wheel 11 in the double-carriage model is slightly larger than that (wheel 3) of the single-carriage model, whereas the minimum normal force (wheel 4) of the double-carriage model is slightly lower than that (wheel 4) of the single-carriage model. It is also observed that the connecting unit has more effect on the wheels that are closer to the connecting unit than those of the ones which are further away.
Double-carriage train model - lateral forces and displacements
The maximum lateral forces and lateral displacements of wheelsets in the double-carriage model are shown in Table 3. The results reveal that the lateral forces and lateral displacements of wheelset I, II VII, and VIII are not much different from those at the corresponding positions in the single-carriage model (wheelset I, II, III, and IV). When the train operation speed is 200 km/h, for example, the maximum lateral force of the wheelset 3 is 4320 N, and its lateral displacement is 4.0 mm in the double-carriage model; while in the corresponding position (wheelset I in the single-carriage model), the lateral force is 4020 N and its lateral displacement is 3.5 mm. When the train operation speed is 300 km/h, the maximum lateral force of the wheelset 5 is 4418 N and its lateral-displacement is 2.4 mm in the double-carriage model, which is larger than that in the corresponding position (wheelset I) in the single-carriage model. The results show that, in the double-carriage model, the connecting unit has less effect on lateral forces and lateral displacements in the wheels that are farther away from the connecting unit.
In the same manner, the lateral forces and lateral displacements of the wheelsets in the double-carriage model (wheelsets III, IV, V, and VI) are larger than those of the corresponding wheelsets of the single-carriage model (wheelsets I, II, III, and IV). However, the trend of the changes in the wheelset lateral forces in the double-carriage model is the same as of the trend in the single-carriage train model when passing through the designed track. The lateral forces and lateral displacements of the wheelsets I, II, VII, and VIII are almost the same as those of the single-carriage model at the same position.
The motor carriage pulls on the trailer carriage through the connecting device, which leads to different lateral forces and displacements. As a result, the lateral forces and lateral displacements of the second bogie of the front carriage (wheelsets III and IV) and the first bogie of the rear carriage (wheelsets V and VI) in the double-carriage model are larger than those at the corresponding position in the single-carriage model at both 200 and 300 km/h operating speeds.
Wheel wear predictions based on the Archard wear model
The Archard model has become one of the most widely used models22–26 for the prediction of railway wheel wear. It can be expressed as follows:

Where,
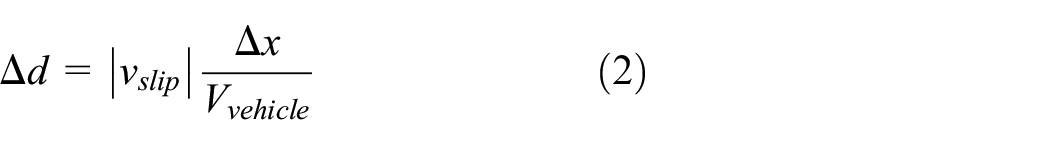
Where,
In the present wheel wear calculation,

Therefore, based on the SIMPACK simulation results and the Archard wear model, the wear depth of each wheel after a period of operation can be predicted. To discuss the relationship between wheel wear and wheel position more clearly, the numbering of wheels in the single-carriage and the double-carriage model has already been presented in Figure 2.
Wheel-wear predictions of the single-carriage model
As shown in Figure 6(a), when the train operation speed is 200 km/h, wheels 2 and 6 have the largest wear in the single carriage model. The wear of wheels 1, 2, 3, and 4 is the same as that in the corresponding positions of wheels 5, 6, 7, and 8, respectively.

Wheel wear in the single-carriage and double-carriage models at speed of 200 km/h: (a) single-carriage model, (b) carriage 1 in the double-carriage. and (c) carriage 2 in the double-carriage.
Wheel-wear predictions of the double-carriage model
It is observed in Figure 6(b) and (c), when the train operation speed is 200 km/h for the double-carriage model, the wear of wheels 2, 3, 6, and 7 in carriage 1 is larger than that of the wheels 1, 4, 5, and 8. Similar to the previous studies on the normal contact forces between the rail and wheels, the wear of intermediate numbered wheels is larger than that of others. The wear of wheels 5, 6, 7, and 8 is slightly larger than that in the corresponding positions of wheels 1, 2, 3, and 4. The wear of wheels 9, 10, 11, and 12 is slightly larger than that in the corresponding positions of wheels 13, 14, 15, and 16. The wheel wear of bogie 1 in carriage 1 (wheels 1, 2, 3, and 4) is nearly the same as that of bogie 4 in carriage 2 (wheels 13, 14, 15, and 16). The results show that different wear occurs on wheels at different distances from the connecting unit. The wheels near the connecting unit have larger wheel wear.
It is observed from the double-carriage train model, that wheels close to the connecting unit have a larger change in normal forces than other wheels, thereby causing a more uneven force on the wheels on both sides and aggravating the wheel wear. The wheel wear of bogie 2 (the rear carriage) in the double-carriage model (wheels 5, 6, 7, and 8) is slightly larger than that in the corresponding positions (wheels 5, 6, 7, and 8) in the single-carriage model. The wheel wear of bogie 3 (the front carriage) in the double-carriage model (wheels 9, 10, 11, and 12) is slightly larger than that in the corresponding positions (wheels 1, 2, 3, and 4) in the single-carriage model.
Based on the above discussion, it may be reasonable to assume that the predicted wheel wear from a full-carriage model would be significantly larger than that from the single-carriage model due to the effect of the multiple connecting units.
Wheel-wear prediction based on NAR and WNN models
NAR model
The NAR model is a non-linear autoregressive model that uses its output as a regression variable, that is, using the linear combination of random variables at an earlier time, to describe random variables at a later time. It is a commonly expressed as a time series as follows:

Where, y(t) is the predicted result of wheel wear; f is a nonlinear function; y(t − 1), y(t − 2), …, y(t − n) are the previous output values. The output of the next time increment depends on the output of the last n time increments of
In this study, the measured wheel wear data are taken as the training dataset to train the NAR model. The maximum-minimum method is used to normalize the data. The dataset is divided into a training set, a validation set and a test set, which account for 70%, 15%, and 15% of the data, respectively. Both the input and output layers are selected as one layer; while the hidden and delay layers are selected as 10 and 4 layers, respectively. The Sigmoid function is selected as the excitation function of hidden layer neurons. Figure 7 shows the error autocorrelation of the NAR model, except for the initial state, the other error autocorrelation is within the 95% confidence interval, indicating the stability of the sequence.

Error autocorrelation diagram of NAR model.
WNN model
The WNN model, a wavelet neural network model, uses a combination of neural network and wavelet analysis theory. The basic idea is to add wavelet transform to the neural network model, and then construct the wavelet neural network through the translation and expansion of the Sigmoid function.
In the application of the WNN, the neuron excitation function of the hidden layer is set as the following Morlet wavelet:
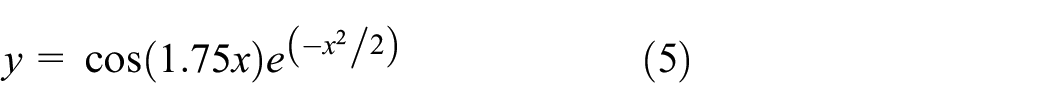
Where, y is the output of the hidden layer, x is the input of the hidden layer. The measured wheel wear data are taken as the training dataset to train the WNN. The WNN established in this study is a three-layer structure. Both the input and output layers are selected as one layer; while the hidden layers are selected as six layers. The learning rate is set at 0.01 and the number of iterations is 100. Figure 8 shows the error autocorrelation of the WNN model. Except for the initial state, the error autocorrelation is within the 95% confidence interval, indicating the stationarity of the sequence.

Error autocorrelation diagram of WNN model.
Results of NAR and WNN predictions
The results show the difference between the wear depths predicted by the NAR and WNN models, and the measured data after 60 days operation of the train. The maximum error between NAR and the measured data is 0.14 mm, the average error is 0.059 mm, and the mean square error is 0.005. The maximum error between the WNN predicted and the measured data is 0.21 mm, the average error is 0.087 mm, and the mean square error is 0.011. Figure 9 shows the predicted wheel wear over 90 days using the two models. The predicted wheel wear by means of the WNN and NAR models from 60 to 90 days are quite similar and the final predicted wear by the NAR model is only slightly larger than that predicted by the WNN model.

Measured and predicted wheel wear depth.
Conclusions
In order to simulate and predict the wheel wear more accurately and quickly, a double-carriage model with connecting unit is established in this study to simulate wheel wear. In addition, it is demonstrated that the NAR and WNN neural network can predict wheel wear during the train operation in good agreement with measured experimental data. Such models therefore, provide better guidance for wheel maintenance and high-speed train operation. The following more detailed conclusions can be drawn from this study:
In the single-carriage model, wheelsets I and III and wheelsets II and IV have similar normal forces, lateral forces, and lateral displacements which show that the relative position of the bogies has insignificant effect on the wheel-rail contact conditions. However, the normal forces, lateral forces, and lateral displacements of the wheels at different positions under the same bogie are significantly different, which shows that the wheelset position within a bogie has significant effect on the normal forces of the wheel-rail contact.
In the double-carriage model, wheels that are close to the connecting unit have a larger variation of normal forces than other wheels, indicating that the connecting unit has more effect on the closer wheels than on the farther ones. Therefore, the wheels that are close to the connecting unit experience higher wheel wear than the wheels that are farther away from the connecting unit.
In comparison with measured wheel wear over the first 60-day of train operation, the error of predicted wheel wear by means of the NAR model is smaller than that of the prediction of the WNN model. Thus, the NAR model is considered reasonably good and better than the WNN model for the prediction of wheel wear on a high-speed train, which has significance for the maintenance of train wheels and the safe operation of high-speed trains.
Footnotes
Handling Editor: Chenhui Liang
Declaration of conflicting interests
The author(s) declared no potential conflicts of interest with respect to the research, authorship, and/or publication of this article.
Funding
The author(s) disclosed receipt of the following financial support for the research, authorship, and/or publication of this article: This study was financially supported by NSFC (51275126), Science and Technology Commission of Shanghai Municipal (18060502400), and Natural Science Foundation of Shanghai (21ZR1445000).