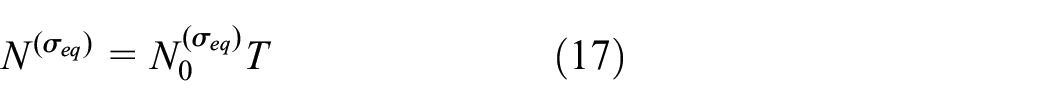
Accelerated random vibration test is now the important dynamic performance and safety evaluation technique for transport packaging system during transportation. The current widely used time scale of accelerated random vibration test in engineering test and some standards is “Inverse power law,” which is based on Basquin (power function) fatigue damage model and curve, but is not completely suitable for transport packaging system. In author’s previous research, the general theory of accelerated random vibration test based on acceleration PSD and curve was developed which is applied for any fatigue damage model besides Basquin type. The study in this paper is the further and extensive research of previous research. The definite expression between response von Mises equivalent stress () of the products and tri-axial acceleration Root-Mean-Square (RMS) was developed, based on which curve was transformed to curve to describe the product damage. Time scale of accelerated random vibration was obtained. The proposed method was verified by finite element analysis. In addition, the effects of excitation spectrum shape and system damping on the response vibration of products were discussed. This study is valuable in engineering for safety assessment and random vibration analysis of transport packaging system.
During distribution journey, transport packaging system usually suffers from hazards of random vibration caused by bad road condition, nonstationary vehicle speed.1 The phenomena of insufficient packaging and overpackaging always happen due to lack of scientific packaging design, which will lead to damage of products and resource waste. Therefore, it is necessary to evaluate the safety of transport packaging system during transportation. Accelerated random vibration test2–4 is now widely used in dynamic performance analysis and safety assessment for transport packaging system in random vibration environment with the advantages of time compression and high efficiency. Test time is reduced by increasing excitation acceleration intensity. The real transportation process transport packaging system undergoing is simulated in laboratory through accelerated random vibration test by developing equivalent relationship based on damage of product. The dynamic performance, damage and lifetime of transport packaging system in real transportation can be predicted through laboratory simulated test.
Accelerated random vibration test involves many research fields. In real transportation, transport packaging system is subject to vibration excitation delivered by vehicles. Therefore, the sampling and analysis of the real vehicle random vibration single is the foundation of accelerated random vibration test. Research show that vibration intensity is related to vehicle speed, vehicle type, road conditions, suspension system, and location.5–7 Analyses reveal that real vehicle vibration show obvious non-Gaussian characteristics.8,9 However, most investigations on accelerated random vibration test are based on random vibration with Gaussian distribution because of the complexity of non-Gaussian distribution. Real vehicle vibration can be put into vibration table in laboratory after simulation due to the non-Gaussian characteristic. Murphy,10 Singh et al.,11 Baren,12 Rouillard and Sek,13 and Zhou and Wang14 put forward simulation methods respectively, the simulation accuracy is improved continuously. Fatigue damage and life evaluation are important for developing the equivalent relationship between real transportation and simulated test in laboratory. Transport packaging system can show more than one fatigue damage types because it is composed of many components with various materials.
Damage equivalence is the foundation to develop time scale. In classical fatigue theory, fatigue damage of material is usually described by stress-life approach.15Equation (1) describes the relation of stress and the cycle number when fatigue failure occurs. is representative for fatigue damage model. Power function and exponential function are the two common types in engineering. Time scale between laboratory simulated vibration and real vibration is developed by damage equivalence principle, namely damage of the product in laboratory simulated test is equal to the one in real transportation.
Where, C is a constant related to the materials.
“Inverse power law” is derived from Coffin-Manson model of fatigue life,16 as shown in equation (2). Time scale () is inversely proportional to the scale of acceleration RMS via the exponent b obtained from the material curve.
In equation (2), and are the test time in laboratory simulated test and real transportation, respectively; and are excitation acceleration RMS in laboratory simulated test and real transportation; b is a material constant.
Inverse power law based on Basquin type fatigue model is now the suggested time scale in engineering and some standards.17,18 Allegri and Zhang19 obtained time scale for accelerated random vibration test by rigorous mathematical derivation. In case of Basquin type fatigue damage model, Allegri’s result was in the same form of inverse power law. Shires investigated on inverse power law and pointed out exponent b was sensitive to time compression scale.20 Based on inverse power law, Jiang et al.21 developed scaling law of accelerated random vibration test under super-Gaussian random vibration excitation by introducing a modified factor.
Above researches on accelerated random vibration test are based on the assumption that fatigue damage model of products conforms to Basquin type, which is suitable for most metallic materials. However, it has limitations when applied in transport packaging system, which is a complex system composed of many components and materials. Above assumption is not always suitable for transportation packaging system. Previous researches have shown that the fatigue damage of some polymer materials and the printing image scuffing do not conform to Basquin type.22,23 On the other hand, local stress field of one concerned point of transport packaging system will be involved to analyze the damage of products both in real and laboratory simulated vibration in inverse power law. But stress field of the concerned point is difficult to measure for transport packaging under random vibration. Based on above considerations, the author proposed a novel theory of accelerated random vibration for transport packaging system by using acceleration to describe the damage of products,24,25 this method has potential value in engineering. curves of corrugated paperboard box and printing scuffing were established by experiments.26,27 As extension of previous research, the definite expression between response von Mises equivalent stress of products and tri-axial excitation acceleration was derived, and the developed accelerated random vibration test theory based on acceleration and curve was verified by finite element analysis in this paper. In addition, the effects of excitation spectrum shape and system damping on the response vibration of products were discussed.
This manuscript was organized as follows: In section “Principle of accelerated random vibration test” the principle and theory preparation of accelerated random vibration test was introduced. In section “von Mises equivalent stress of transport packaging at the concerned point,” the relation of von Mises equivalence transport packaging at one concerned point and tri-axial acceleration RMS excitation was developed. In section “Time scales of accelerated random vibration test,” curve was transformed to curve to describe fatigue damage based on section “von Mises equivalent stress of transport packaging at the concerned point,” time scale respectively based on curve and curve was developed. Section “Equivalence verification of curve and curve and response analysis of product,” the equivalence of curve and curve was verified through finite element analysis. Furthermore, effects of excitation spectrum shape and damping on the response of products and curve were discussed. Section “Conclusions,” the conclusions and recommendations were given.
Principle of accelerated random vibration test
Accelerated random vibration test in laboratory is carried out based on the principle of damage equivalence. During laboratory simulated vibration, the structure and constraint of transport packaging system must keep the same with that in real transportation. Moreover, the damage mechanism of product and packaging material must be consistent between the laboratory simulated random vibration (s) and the real one (r). The principle is shown in Figure 1.
The principle of accelerated random vibration test.
Usually, the acceleration PSDs exerted to transport packaging system in laboratory simulated test are simply scaled with respect to the real ones by equation (3), which is defined as “the simply scaled accelerated vibration.” The constant (>1) is called as “the scale factor.”
where is frequency.
The acceleration RMS describes the overall energy level of random vibration signal.
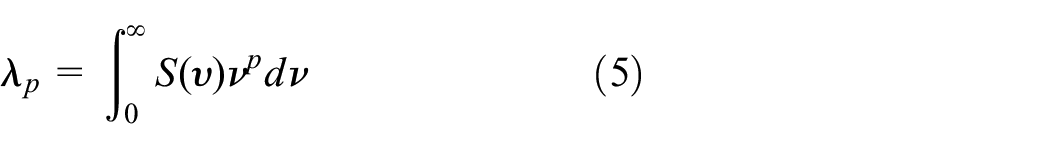
The pth spectral moment is defined as
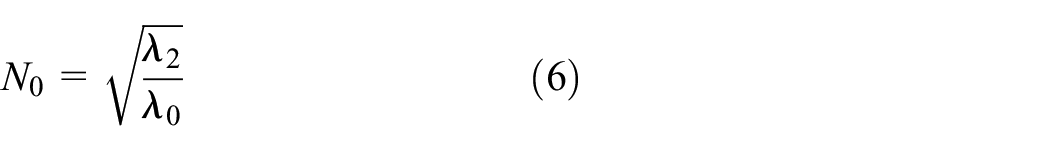
The average number of zero-crossings with positive slope per unit time (zero-up-crossing frequency), , is
The average number of peaks with positive slope per unit time (peak frequency), , is
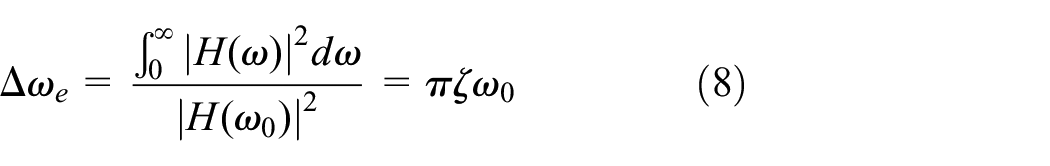
Noise bandwidth is defined as the bandwidth of an ideal filter which passes the same noise power as does the real filter, as shown in equation (8).
is frequency response function of single degree of freedom system, is natural frequency. is damping ratio.
Frequency bandwidth of response vibration process is usually measured by noise bandwidth, namely most of the response vibration energy is focused on the zone of noise bandwidth, as shown in Figure 2.
Schematic of noise bandwidth.
In “the simply scaled accelerated vibration,” the pth spectral moments in equation (5) are scaled by , and in equation (4) by . The zero-up-crossing frequency in equation (6) and the peak frequency in equation (7) remain the same.
Von Mises equivalent stress of transport packaging at the concerned point
This section was to analyze von Mises equivalent stress of transport packaging at the concerned point. Two assumptions were made before analysis:
Linear elastic assumption. The materials and structures of transport packaging are in linear elastic state;
Transport packaging suffers from stationary triaxial Gaussian random vibration excitation.
Let , , and be the triaxial excitation acceleration exerted to transport packaging system, which are independent with each other. The corresponding acceleration PSD is respectively , , and . The excitation acceleration PSD matrix can be written as
As the analysis in authors’ previous paper by applying finite element method,24 the response stress PSD matrix within an element in the transport packaging system can be obtained as
where is the extraction matrix of the displacement of elemental node with either zero or unit entries, the transform matrix of the base excitation with either zero or unity entries, the transform matrix from the displacement of the elemental node to the stress within the element. is the matrix associated to the frequency response functions and vibration modes, and its complex conjugate. The matrix with the superscript is the transpose.
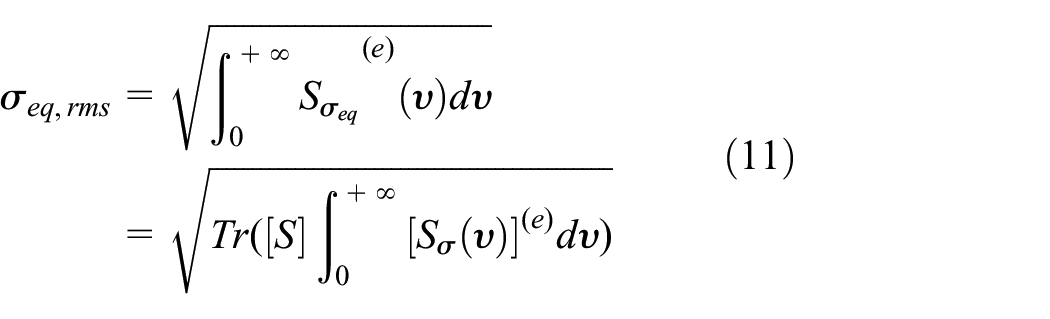
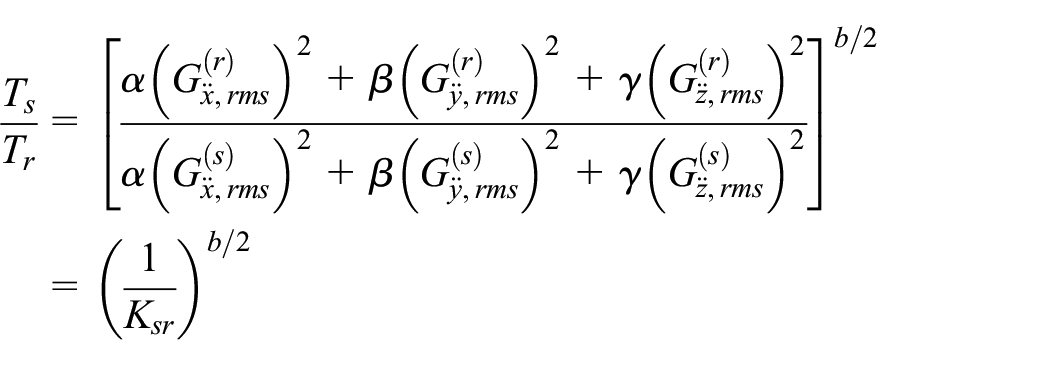
The RMS of von Mises equivalent stress at a point concerned is19
where Tr is the trace operator and the coefficient matrix of von Mises equivalent stress.
In order to obtain the directly relation between the stress response and excitation acceleration, substitute equation (10) into equation (11). However, the following matrix integral involves
The actual vibration excitation frequency is finite, only the finite interval integral is considered. Integrated for each term in the above matrix by applying the general mean value theorem for integrals, equation (11) can be simplified as
where the parameters , , and show the effect of the frequency response function and excitation spectrum shape on von Mises equivalent stress. Once the transport packaging system, the concerned point within product, and excitation profile are determined, the parameters , , and are constant. Of course, the constants are different depending on the concerned point. These parameters can be respectively obtained in the case of uniaxial excitation. For example, in the case of z-axial excitation, equation (13) can be simplified as
In “the simply scaled accelerated vibration,” is also scaled by .
Time scales of accelerated random vibration test
Relation between σ - N curve and Grms - T curve
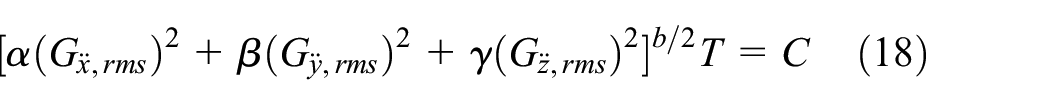
The fatigue damage of most metals conforms to Basquin type. However, transport packaging system is composed of various materials and Basquin type is not suitable. Hence, two common fatigue models in engineering were discussed here, namely Basquin type and exponential function type curves, as shown in equations (15) and (16) respectively.
where b is a material constant, the number of zero-crossings with positive slope of von Mises equivalent stress, and is a constant.
where is the zero-up-crossing frequency, and the excitation vibration time.
Time scales based on σ - N curve and Grms - T curve
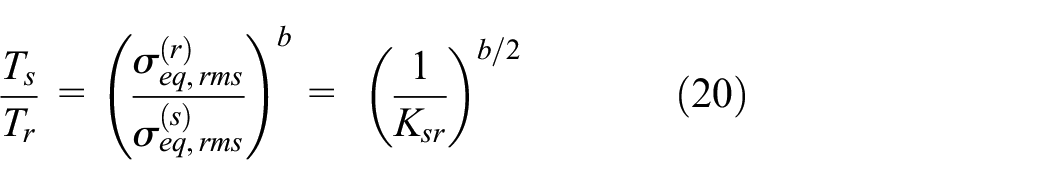
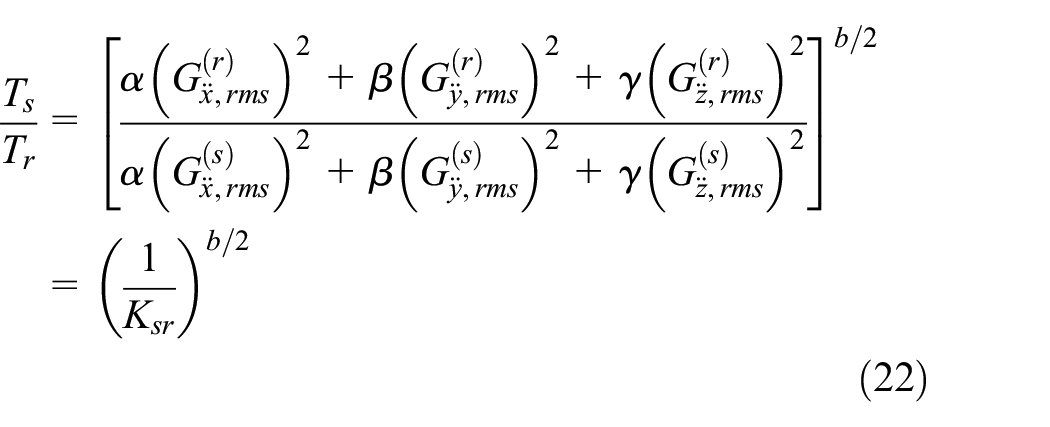
By considering the damage equivalence at a concerned point between the real random vibration (r) and the laboratory simulated one (s), the time scales of the accelerated test between the laboratory simulated random vibration and the real random vibration can be obtained respectively based on curves (15) and (16), as shown in equations (20) and (21).
where and are respectively the laboratory simulated time and real time.
Similarly, respectively based on curves (18) and (19), the time scales of the accelerated test can be obtained as
Equivalence verification of Grms - T curve and σ - N curve and response analysis of product
For transport packaging system, curve is more convenient to obtain than curve under random vibration. Time scale based on curve is more practical in engineering. In this section, equivalence of time scale based on curve and curve was verified by finite element analysis.
Finite element analysis method
In transport packaging system, many components or structures connected to the main part of products can be taken as cantilever constructions. In this paper, a fixed supported notched cantilever beam was selected as finite element model to simulate this cantilever structure, as shown in Figure 3. The left end surface was the fixed supported position. The random vibration analysis was conducted through software of ANSYS Mechanical APDL 18.0. The notched beam was made of aluminum with size of . The material of loaded mass was alloy steel with size of . Element type was solid 185. Table 1 shows these material parameters.
The model of finite element analysis: (a) FEM model and (b) Exerted excitation.
Material parameters.
Density (g/cm3)
Elasticity modulus(GPa)
Poissonratio
Aluminum
2.7
70
0.3
Alloy steel
7.9
206
0.3
At first, mode analysis was conducted and the first 10 resonant frequencies of notched cantilever beam are extracted, as shown in Table 2.
The first 10 resonant frequencies of notched cantilever beam.
Mode
1
2
3
4
5
6
7
8
9
10
resonant frequency/Hz
110.91
337.07
1094.3
1385.0
3085.2
3511.6
5226.5
6619.4
7052.9
9325.8
Then, tri-axis random vibration was conducted by ANSYS software. Tri-axis vibration in lateral, longitudinal, and vertical directions (x, y, and z) were exerted to the left end surface of cantilever beam, as shown in Figure 3(b). Tri-axis excitation was loaded by acceleration PSD. Band-limited white noise with five levels were used as excitation acceleration PSD. During real transportation, the vibration in vertical direction is the most severe.28 In this paper, acceleration PSDs in direction x and y are as 1/10 acceleration PSD in direction z. Acceleration PSD of level 1–5 in direction z is respectively set as 0.0005, 0.001, 0.002, 0.003, 0.004. Excitation acceleration PSD between different levels satisfies the principle of “the simply scaled accelerated vibration,” namely . Different excitation frequency bandwidth and system damping were set to the notched cantilever beam to explore the effect of excitation spectrum shape and damping on the response of product. All of the excitation frequency bandwidths contained the first resonant frequency 110.91 Hz. = 1–300 Hz was the first frequency bandwidth. Twice noise bandwidth and twice half-power bandwidth were respectively the second and the third excitation frequency band. Noise bandwidth and half-power bandwidth were set as the fourth and the fifth excitation frequency band. System damping ratio of notched cantilever beam was taken as 0.01, 0.05, 0.10, 0.15, 0.20. Noise bandwidth and half-power bandwidth become wider with damping increase, as shown in Table 3. The scheme of random vibration analysis is shown in Table 4.
Frequency band of excitation white noise.
Damping ratio
(Hz)
(Hz)
(Hz)
(Hz)
(Hz)
0.01
1–300
107–114
108–113
109–113
109–112
0.05
1–300
93–128
99–122
102–120
105–116
0.10
1–300
76–146
88–133
93–129
99–122
0.15
1–300
58–163
77–144
84–137
94–127
0.20
1–300
41–180
66–155
76–146
88–133
Random vibration analysis scheme.
Damping ratio
Excitation frequencyband (Hz)
Excitation acceleration
0.01/0.05/0.1/0.15/0.2
Level 1–level 5
Level 1–level 5
Level 1–level 5
Level 1–level 5
Level 1–level 5
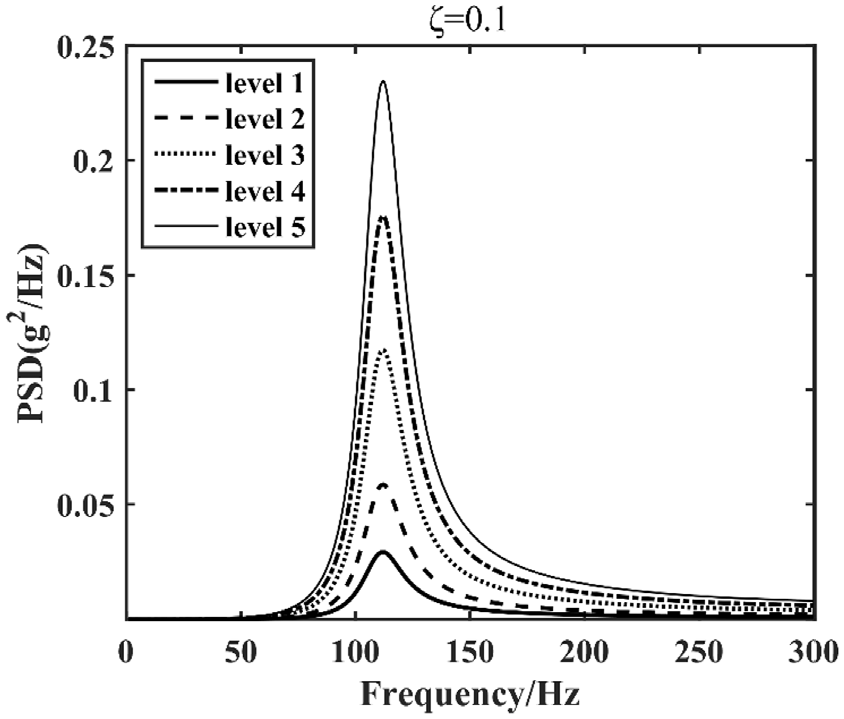
Take the single degree of freedom system for instance, Figure 4(a) shows the frequency distribution of to in transmissibility curve. Response acceleration PSD of one concerned point of notched beam is obtained through random vibration analysis, as shown in Figure 4(b). Obviously, the response vibration is mainly contributed by excitation acceleration near resonant frequency. In the five excitation frequency bands, the excitation vibrations with contribute the most to the whole response vibrations.
The distribution of in transmissibility curve of single degree of freedom system and response acceleration PSD of the notched beam: (a) transmissibility curve and (b) response acceleration PSD.
Damage usually produces from the weak points of product and then extends to the rest zone rapidly. Weak points are critical for products’ fatigue damage analysis. The maximum von Mises equivalent stress was located on the notches seen from Figure 5. Therefore, front notch (P1) and back notch (P2) were set as two concerned points, as shown in Figure 6.
(a) von Mises equivalent stress nephogram of notched cantilever beam under random vibration. (b) Partial enlarged drawing.
Concerned points and .
Uni-axis random vibration with the same excitation level was exerted to the notched cantilever beam to calculated parameters , and .
Relation of σ - N curve and Grms - T curve
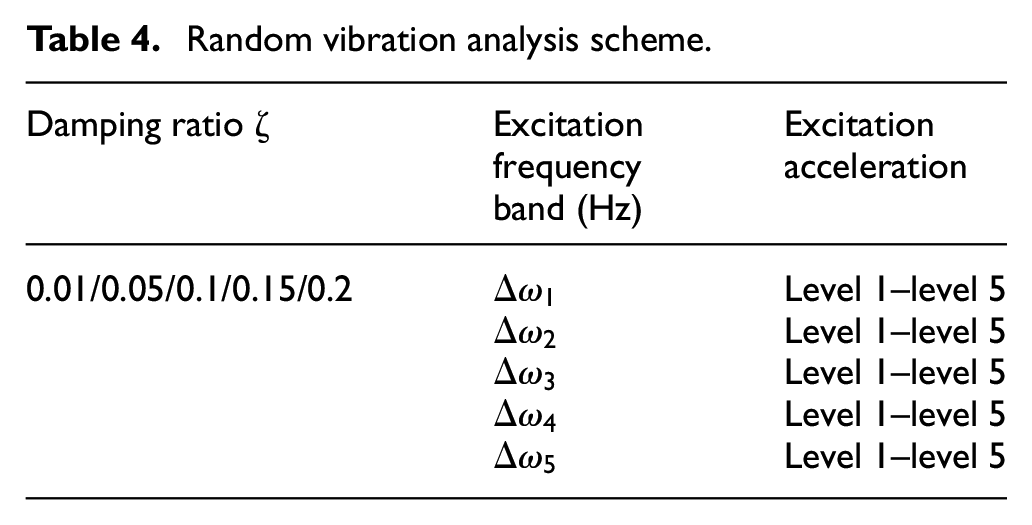
von Mises equivalent stress of the two concerned points was obtained through random vibration analysis. From results of uni-axis random vibration analysis, the relation of von Mises equivalent stress of concerned points and excitation acceleration RMS was developed, as shown in Figure 7. Curves of , , and showed an excellent linear relation (equation (14)). Parameters , , and were derived from fitting equations and the results under frequency band were given in Table 5. The fitting degree was 1.
, , and under band-limited white noise (1–300 Hz, ).
P1
0.01
0.20
17.20
0.05
0.17
3.42
0.1
0.15
1.71
0.015
0.13
1.14
0.2
0.11
0.85
P2
0.01
0.04
0.15
17.07
0.05
0.13
3.40
0.1
0.11
1.70
0.015
1.13
0.2
0.84
Time sale based on σ - N curve and Grms - T curve
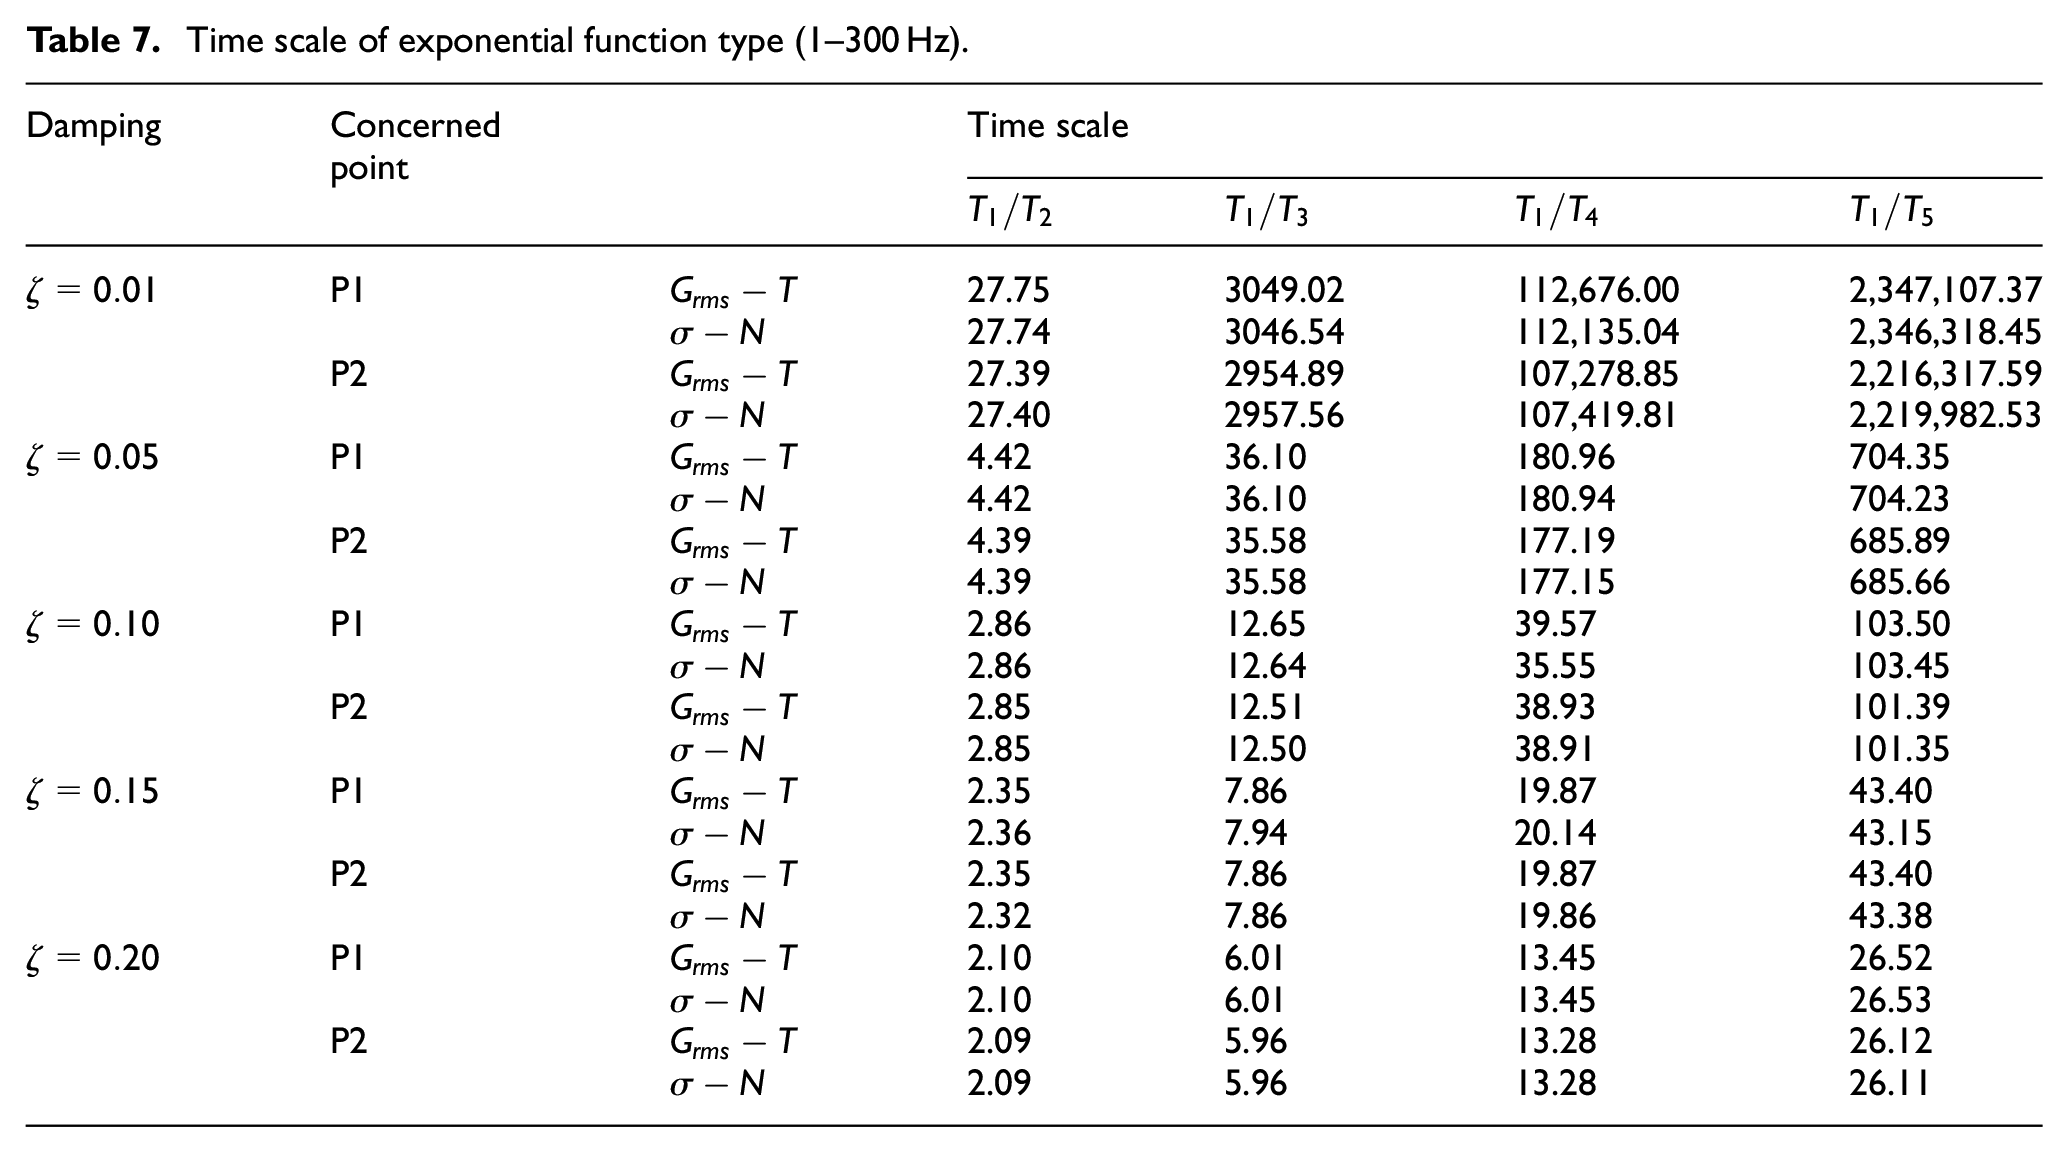
Real transportation was simulated by random vibration of level 1, random processes of level 2–level 5 were deemed as laboratory simulation accelerated random process. Time scale of accelerated random vibration test was calculated from two ways. On one hand, time scale was calculated by equations (20) and (21) based on curve. On the other hand, time scale was calculated through equations (22) and (23) based on curve. Let “b = 5,” time scale was calculated under different system damping and excitation frequency bandwidth. Tables 6 and 7 gives the time scale results under 1–300 Hz excitation frequency bandwidth. Results showed that time scales calculated based on curve were identical with the one based on curve both under Basquin type, almost the same with little error under exponential function type. Therefore, it can be concluded that curve is equivalent with curve for accelerated random vibration test of transport packaging system. Acceleration is convenient to measure and it is easily realized to develop curves of products or components by experiments. In terms of transport packaging system, only curves of the key components need to be developed.
Time scale of Basquin type (1–300 Hz).
Damping
Concerned point
Time scale
P1
5.66
32.00
88.18
181.02
5.66
32.00
88.18
181.02
P2
5.66
32.00
88.18
181.02
5.66
32.00
88.18
181.02
P1
5.66
32.00
88.18
181.02
5.66
32.00
88.18
181.02
P2
5.66
32.00
88.18
181.02
5.66
32.00
88.18
181.02
0
P1
5.66
32.00
88.18
181.02
5.66
32.00
88.18
181.02
P2
5.66
32.00
88.18
181.02
5.66
32.00
88.18
181.02
P1
5.66
32.00
88.18
181.02
5.66
32.00
88.18
181.02
P2
5.66
32.00
88.18
181.02
5.66
32.00
88.18
181.02
0
P1
5.66
32.00
88.18
181.02
5.66
32.00
88.18
181.02
P2
5.66
32.00
88.18
181.02
5.66
32.00
88.18
181.02
Time scale of exponential function type (1–300 Hz).
Damping
Concernedpoint
Time scale
P1
27.75
3049.02
112,676.00
2,347,107.37
27.74
3046.54
112,135.04
2,346,318.45
P2
27.39
2954.89
107,278.85
2,216,317.59
27.40
2957.56
107,419.81
2,219,982.53
P1
4.42
36.10
180.96
704.35
4.42
36.10
180.94
704.23
P2
4.39
35.58
177.19
685.89
4.39
35.58
177.15
685.66
0
P1
2.86
12.65
39.57
103.50
2.86
12.64
35.55
103.45
P2
2.85
12.51
38.93
101.39
2.85
12.50
38.91
101.35
P1
2.35
7.86
19.87
43.40
2.36
7.94
20.14
43.15
P2
2.35
7.86
19.87
43.40
2.32
7.86
19.86
43.38
P1
2.10
6.01
13.45
26.52
2.10
6.01
13.45
26.53
P2
2.09
5.96
13.28
26.12
2.09
5.96
13.28
26.11
Response analysis with excitation spectrum shape
curve is crucial for accelerated random vibration test of transport packaging system. Here is excitation acceleration RMS and it changes as excitation acceleration PSD changes. Different excitation acceleration PSD spectrum shape will lead to different curve. For the sake of standardization, the unified excitation frequency bandwidth needs to be defined to develop curve. For this purpose, the effect of excitation frequency bandwidth on the response vibration of transport packaging must be discussed firstly. In logistics, resonance phenomenon usually happens when natural frequency of transport package is buried in road excitation random vibration. Resonance brings serious destruction in transport packaging system. It is well known that most of vibration energy focused near resonant frequency. Furthermore, transport packaging is usually taken as a small damping system and the damping is always ignored in general problems. The effect of excitation frequency bandwidth (namely spectrum shape) and damping on response of transport packaging has not been studied yet. Above questions will be discussed here.
Response acceleration PSD of notched beam’s two concerned points are obtained through finite element analysis. Figure 8 shows response acceleration PSD of P1 in direction x, y, and z under triaxial random vibration (1–300 Hz, ). In 1–300 Hz, only the first resonant vibration mode occurs in direction z. Therefore, the effect of excitation spectrum shape on the response of concerned points will be analyzed in direction z.
Response PSDs of P1 under 1–300 Hz excitation (.
Response acceleration RMS of P1 and P2 under excitation frequency band was calculated by equation (4). Define contribution rate of response acceleration under frequency band to the total response acceleration as
is the response acceleration RMS of P1 and P2 under , is the response acceleration RMS of P1 and P2 under .
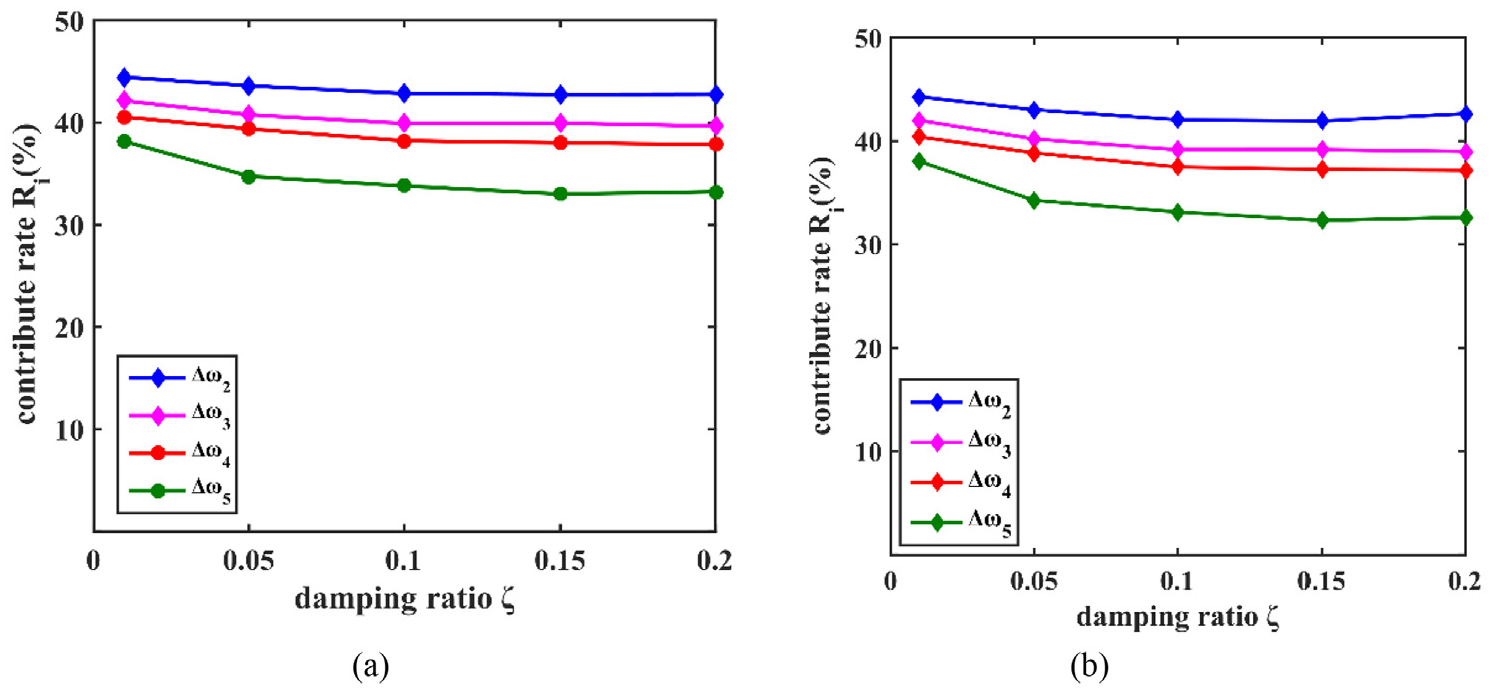
Previous research has shown response acceleration PSD is in linear relation under “the simply scaled accelerated vibration” in linear elastic state,15 namely the shape of response PSD under different excitation levels keeps the same, as shown in Figure 9. Therefore, random vibration of level 1 was only taken here to analyze. Figure 10 showed the contribution rates under level 1 excitation. Results showed that excitation random vibration with contributed the most to the response of the concerned points and it was almost up to 90%. But the percentage of to the total frequency band 1–300 Hz () was less than 46.49% as seen from Figure 11, and it was even close to zero when . Acceleration RMS means the average energy of the random vibration process. Above results show that most of response vibration energy is concentrated on frequency band . The damage of transport packaging is mainly induced by vibrations in , the effect of random vibration out of this frequency band on damage of product is slight.
Response PSDs of in direction z under 1–300 Hz excitation (.
Contribute rate : (a) and (b) .
in different .
Response analysis with damping
Response of product is also related to system damping. Twice noise frequency bandwidth become wide when system damping increased. The percentage of to the whole frequency band increased from 2.34% to 46.49% with system damping increasing from 0.01 to 0.2. It is noticed the frequency contribution rate decreased lightly as system damping increased from Figure 10. For P1, was decreased from 88.86% to 85.53%, and for P2, was decreased from 88.55% to 85.28%. The change was insignificant and can be ignored. The effect of system damping on response contribution was unobvious.
In real transportation, the excitation frequency band exerted to transport packaging is wide in different transportation routes. The results indicate that one can just focus on the excitation random vibration within in random vibration analysis of transport packaging system no matter how wide the excitation frequency band is. Unified curve can be developed with . Therefore, twice noise frequency bandwidth are suggested to be the standard frequency band to develop curve of transport packaging, this makes it possible to realize the standardized comparison between different products or packages.
Conclusions
Accelerated random vibration test is widely used in safety performance evaluation of transport packaging system. In this paper, the concept and principle of accelerated random vibration test was introduced. The relation between von Mises equivalent stress of product and excitation acceleration was obtained and verified by finite element analysis. The accelerated random vibration test method based on acceleration and curve was validated. Finally, the effects of excitation spectrum shape and system damping on response of product were discussed. Some conclusions can be drawn as follows.
(1) Response von Mises equivalent stress of product is in a linear relation with excitation acceleration RMS . For Basquin fatigue damage type, time scale of accelerated test based on curve is as follows
For equational function type, time scale is as follows
(2) In accelerated random vibration test of transport packaging system, curve of products is equivalent with curve. Time scale calculated based on curve is equal to the one based on curve. curve can be applied in accelerated random vibration test of transport packaging system. This study has great value in engineering for accelerated random vibration test of transport packaging system.
(3) Excitation random vibrations with contribute almost 90% to the response vibration of product. The random vibration performance of transport packaging system can be analyzed with twice noise frequency bandwidth effectively, which can provide reference for simulated vibration test design in laboratory. In case of small damping system, the effect of system damping on response of product is very slight and can be neglected. Twice noise frequency band is suggested to be the standard frequency bandwidth to develop curve of products and packaging containers, which can realize the standardization in accelerated random vibration test.
Footnotes
Handling Editor: Chenhui Liang
Declaration of conflicting interests
The author(s) declared no potential conflicts of interest with respect to the research, authorship, and/or publication of this article.
Funding
The author(s) disclosed receipt of the following financial support for the research, authorship, and/or publication of this article: This work was supported by National Natural Science Foundation of Tianjin (Grant number: 21YDTPJC00480), Basic Scientific Research Program of Tianjin University of Science and Technology (Grant number: 2019KJ210), National Natural Science Foundation of China (Grant number: 50775100).
ORCID iD
Li-Jun Wang
References
1.
ZhouHWangZ-W.Measurement and analysis of vibration levels for express logistics transportation in South China. Packag Technol Sci2018; 31: 665–678.
2.
CarusoHDasguptaA.A fundamental overview of accelerated testing analytical models. J IEST1998; 41: 16–20.
3.
WuJZhangRRWuQ, et al. Environmental vibration assessment and its applications in accelerated tests for medical devices. J Sound Vib2003; 267: 371–383.
4.
KippWI. Vibration testing equivalence: how many hours of testing equals how many miles of transport. In: ISTA conference 2000 (updated), Australia, 2008, pp.1–7.
5.
RissiGOSinghSPBurgessG, et al. Measurement and analysis of truck transport environment in Brazil. Packag Technol Sci2008; 21: 231–246.
6.
ZhouRYanLLiB, et al. Measurement of truck transport vibration levels in China as a function of road conditions, truck speed and load level. Packag Technol Sci2015; 28: 949–957.
7.
SoleimaniBAhmadiE.Measurement and analysis of truck vibration levels as a function of packages locations in truck bed and suspension. Comput Electron Agric2014; 109: 141–147.
8.
SinghSPSahaKSinghJ, et al. Measurement and analysis of vibration and temperature levels in global intermodal container shipments on truck, rail and ship. Packag Technol Sci2012; 25: 149–160.
9.
PaternosterAVanlanduitSSpringaelJ, et al. Vibration and shock analysis of specific events during truck and train transport of food products. Food Packag Shelf Life2018; 15: 95–104.
10.
MurphyRW.Endurance testing of heavy duty vehicles. SAE technical paper 820001, 1982.
11.
SinghJSinghSPJonesonE.Measurement and analysis of US truck vibration for leaf spring and air ride suspensions, and development of tests to simulate these conditions. Packag Technol Sci2006; 19: 309–323.
12.
BarenPV.The missing knob on your random vibration controller. J Sound Vib2005; 39: 10–16.
13.
RouillardVSekMA.Synthesizing non-stationary, non-Gaussian random vibrations. Packag Technol Sci2010; 23: 423–439.
14.
ZhouHWangZ-W.Comparison study on simulation effect of improved simulation methods for packaging random vibration test. Packag Technol Sci2019; 32: 119–131.
15.
MansonSS.Fatigue: a complex subject—some simple approximations. Exp Mech1965; 5: 193–226.
16.
CoffinLFJr.A study of the effects of cyclic thermal stresses on a ductile metal. Trans Am Soc Mech Eng1954; 76: 931–950.
17.
MIL-STD-810G:2014. Environmental engineering considerations and laboratory tests, Method 514.7, Annex A.
18.
DEF STAN 00-35:2006. Environmental handbook for defence materiel, Part no 5: Induced mechanical environments, Issue 4.
19.
AllegriGZhangX.On the inverse power laws for accelerated random fatigue testing. Int J Fatigue2008; 30: 967–977.
20.
ShiresD.On the time compression (test acceleration) of broadband random vibration tests. Packag Technol Sci2011; 24: 75–87.
21.
JiangYYunGJZhaoL, et al. Experimental design and validation of an accelerated random vibration fatigue testing methodology. Shock Vib2015; 2015: 1–13.
22.
ChandranKSR. Mechanical fatigue of polymers: a new approach to characterize the SN behavior on the basis of macroscopic crack growth mechanism. Polymer2016; 91: 222–238.
23.
GriffithsKShiresDWhiteW, et al. Correlation study using scuffing damage to investigate improved simulation techniques for packaging vibration testing. Packag Technol Sci2013; 26: 373–383.
24.
WangZ-WWangL-J.On accelerated random vibration testing of product based on component acceleration RMS–life curve. J Vib Control2018; 24: 3384–3399.
25.
WangZ-WWangL-J.Accelerated random vibration testing of transport packaging system based on acceleration PSD. Packag Technol Sci2017; 30: 621–643.
26.
WangL-JWangZ-WRouillardV.Investigation on vibration scuffing life curves. Packag Technol Sci2018; 31: 523–531.
27.
WangL-JLaiY-ZWangZ-W.Fatigue failure and curve of corrugated paperboard box. J Vib Control2020; 26: 1028–1041.
28.
LongMTRouillardVLambMJ, et al. Characterising heave, pitch, and roll motion of road vehicles with principal component and frequency analysis. Packag Technol Sci2018; 31: 3–13.