
Abstract
The prevention of excessive and unnecessary exercise of power against service receivers in institutional contexts requires research methods able to identify and analyze these multiple and often complex forms of exercise of power. This article illustrates one such method: floor plan drawings as visual methods for generating and analyzing data. Based on an ethnographic study of a Norwegian group home for people with intellectual disabilities, the article demonstrates how sketching floor plans in the field can enrich data generation with narratives of healthcare personnel’s social practices, including practices of control. By color-coding floor plan drawings, subtle and intricate forms of exercise of power, as well as material structures related to power relations, be identified. It can illustrate the extent of healthcare personnel’s exercise of power and contribute to insight into a particular vulnerable group at risk of being marginalized in research.
Keywords
Introduction
A common goal across national policies and healthcare services is to prevent excessive and unnecessary exercise of power against service receivers. To achieve this, we need to know more about how and why power is exercised within healthcare, which in turn requires research methods able to provide this knowledge. Visual methods offer diverse and creative alternatives to hegemonic research methods (Prosser & Loxley, 2008) and have the potential to include vulnerable groups at risk of being marginalized in research. This article illustrates the use of floor plan drawings as visual methods to study healthcare personnel’s exercise of power. More specifically, I reconstruct the ways in which I used floor plan drawings to learn more about and better understand staff’s exercise of power at a group home for people with intellectual disability. In retrospect, I reflect on what was an exploratory, fragmented and chaotic, but also insightful and illuminating process. Among other things, it generated narratives of past and present social practices, identified the more subtle and intricate ways in which staff exercised power, and contributed to an overview of the extent of staff’s exercise of power in the everyday life of the residents, as well as to insight into how the residents may have experienced and responded to this.
It was as part of my doctoral project (Henriksen, 2022), that I constructed and used floor plan drawings of a group home to study staff’s exercise of power against residents. The drawings illustrated the group home’s layout from above: the arrangement of rooms, doors, and built-in furniture, as well as some freestanding furniture. The residents represented a particularly vulnerable group of participants in research as they had limited verbal and writing skills and did not use any augmentative or alternative communication, such as sign-supported speech or communication technology. Traditional data generation methods were therefore not suitable, nor were certain visual methods, due to reduced fine motor skills and impaired cognitive function. The residents were diagnosed with intellectual disability, which are a medical category denoting disorders characterised by intellectual functioning and adaptive behavior below average (WHO, 2024). In both the doctoral study and this article, power is defined as individuals’ opportunities to realize their own will in interaction with others (Weber, 2000), whereas exercise of power is understood as individuals’ actions when utilizing these opportunities. For example, health care personnel can use physical force to prevent service receivers from harming themselves or others. In Norway, this is legally justified under the Healthcare Act (2011), which regulates the use of coercion against people with intellectual disability. Health care personnel also has the opportunity to exercise power more informally, such as asking questions in ways that cause service receivers to agree without fully understanding the situation. This can be viewed as exploitation of service receivers’ cognitive vulnerabilities (Owren & Linde, 2019).
Knowledge about healthcare personnel’s exercise of power against service receivers in institutions is primarily generated using preregistered statistics or quantitative surveys. These studies, whether they concern people with intellectual disabilities (Fitton & Jones, 2020), psychiatric patients (Gleerup et al., 2019), or elderly healthcare receivers (Hakverdioğlu Yont et al., 2023), are often limited to traditional forms of exercise of power, such as physical restraint, mechanical restraint (belts etc.), and seclusion. These are typically regulated by law or national guidelines and therefore preregistered. Furthermore, since healthcare personnel typically answer these surveys on behalf of service receivers, their perspective risks being over-represented in this research.
Qualitative interview studies represent a greater variety of perspectives, including the perspectives of the persons themselves (Heyvaert et al., 2015). Still, some perspectives are significantly underrepresented. For example, interviews require linguistic skills, something not everyone has or practices well enough to be interviewed (Prosser & Loxley, 2008). People may also be unable to communicate about the things taken for granted, such as the more subtle, day-to-day exercise of power. For example, healthcare personnel can be unaware of the many ways power can be exercised unintentionally (Henriksen, 2022) or exercise power routinely (Thomann et al., 2023). Space is another example. When asked in interviews, people can be incapable of providing descriptions and information about spaces (Löw & Marguin, 2022). To include people with limited communication skills, observation is a potential method. However, researchers may encounter difficulties in identifying more subtle and intricate forms of exercise of power, as well as in recognizing the influence that physical surroundings can have on healthcare personnel’s practice (Henriksen, 2022).
Combined with verbal or textual data, visual methods can increase the scope of traditional approaches and address complex issues. A visual method is any method using a visual approach to generate or analyze data, as well as present findings (Shannon-Baker & Edwards, 2018). Among other things, they can enable communication with participants who cannot speak or write (Shannon-Baker & Edwards, 2018), and by that, include groups who otherwise are challenging to include (Pain, 2012) and risk being marginalized in research. Visual methods can also assist verbal participants in expressing and exploring tacit knowledge, taboo topics (Pain, 2012), and experiences too difficult to verbalize (Shannon-Baker & Edwards, 2018), such as the exercise of power against service receivers.
There is a wide variety of visual material, such as art, maps, and photos of the field. Respectively, these constitute visuals as (1) data, (2) tools to gather, and (3) record data (van den Scott, 2018). As data, visuals can pre-exist, be collected or generated by participants, researchers or others (Shannon-Baker & Edwards, 2018). Accordingly, there exist a wide variety of visual methods. Photography and film-making have emerged as the more popular and widely adopted tools, while drawing-based methods remain less commonly used (Heath et al., 2018). This article illustrates how floor plan drawings can go beyond being and generating mere visual data, by being integrated into the fieldwork as forms of observational sketching and spatial mapping.
The aim is to present what was, in many ways, a messy process during the fieldwork in a more consistent, structured and accessible form, so that other researchers may benefit from the methodological advantages of using floor plan drawings. Furthermore, the aim is to contribute to the discussion regarding the study of healthcare personnel’s exercise of power and the discussion regarding visual methods in healthcare research. Despite the diversity of approaches, knowledge about the positive and negative outcomes of visual methods is scarce. More research on the quality of data is needed to improve choice and utilization of visual methods (Pain, 2012). There are also concerns regarding validity (Shannon-Baker & Edwards, 2018) and ethical challenges (Cox et al., 2014).
After providing a background on the use of floor plan drawings as visual research methods, I describe why and how the floor plan drawings of the group home were constructed and utilized. The discussion focuses on the methodological strengths, limitations and potential development of using floor plan drawings to generate and analyze data.
Floor Plan Drawings as a Visual Research Method
Traditionally, floor plan drawings have been used to design and visualize spaces in the study of architecture. For a long time, they have also been used in the social sciences to illustrate research contexts and analyze social life. One classical example is Foucault’s (1977) use of Bentham’s Panopticon to illustrate modern disciplinary power: how the possibility of constant surveillance has a self-disciplinary effect on citizens. Another example is Bourdieu’s (2016) ethnographic study of Kabyle (Berber) houses, where he shows how the houses’ spatial organization reflects social structures. Floor plan drawings are still used in ethnographic studies, including those focusing on healthcare personnel, their practices and interactions with healthcare receivers.
In her ethnographic study of care for older people in residential homes, Johnson (2018) color-coded floor plan drawings to indicate and analyze different uses of spaces. For instance, the residents’ bedrooms and communal toilets were colored red, while communal areas, such as the dining room, were green, and areas reserved for staff, such as the office, were blue. Among other things, the colored floor plan drawings showed the containment of bodily waste products to red spaces, which Johnson (2018, p. 145) interprets as indicative of “strong institutional beliefs about one form of matter that constituted dirt: namely, bodily waste”. Kuboshima and McIntosh (2023) used floor plan drawings to analyze the lived experience of service receivers in senior housing complexes. The analysis consisted of the lead researcher annotating the floor plan drawings based on the interviews with service receivers. As such, the participants’ experience was linked directly to the physical surroundings (Kuboshima & McIntosh, 2023). Dunn (2021, p. 81), in her study of three nursing homes, combined floor plan drawings and photos to constitute “three-dimensional” visual data. Among other things, she found that the physical environments of the nursing homes were still influenced by a medical model of care (Dunn, 2021). In a similar manner, Phillips et al. (2014, p. 565) supplemented the floor plan drawings of general practitioner offices with pictures of key work areas (identified by the nurses), causing the floor plans to function like “a set for a theatrical performance”.
Floor plan drawings are also used within the field of psychology in the form of different kinds of maps. As early as 1978, Snyder et al. used behavior mapping to study nursing home residents who wandered – that is, moved about the institution seemingly without purpose or due to disorientation. This entailed recording the movements and paths of both wandering and non-wandering residents on floor plan drawings, as well as their social behavior. One of the more surprising findings was that wandering was not the all-consuming activity one might have expected (Snyder et al., 1978). In a study of a day care center for people with dementia, location-centred behavioral mapping was used to explore patterns of activities, and furthermore, identify core place rules (Diaz Moore, 2000). Others have used behavior mapping to study healthcare workers’ hand hygiene behavior (Cai et al., 2021) and visitors’ waiting behavior in hospital wards (Morhayim, 2019), as well as combined it with video-based observation to study healthcare systems (Joseph et al., 2022).
Another form of mapping used within psychology is emotion mapping. McGrath et al. (2020) used emotion mapping to explore the affective and emotional experiences of assistants living and working together with people with learning difficulties in an intentional community. During the interviews, participants (assistants) marked emotions by placing colored stickers representing predefined emotions on the floor plan drawing of the shared home (McGrath et al., 2020). Emotion maps have also been used to explore stress among siblings of children with developmental disabilities (Sendowski, 2019).
In addition to behavior mapping and emotion mapping, there appear to be combined versions of these two. For example, Keddy (2009) used activity location mapping and impression management behavior location mapping when studying nursing work at a surgical unit. Both maps were miniature copies of blueprints of hospital floor plans, used by participants (nurses) to mark nursing activities and behavior with colored stickers during interviews (Keddy, 2009). In another study the approach shares several characteristics with behavior mapping as floor plan drawings are used to record hospital nurses’ movements, including the number of stops and interactions they had with others (Yi & Seo, 2012).
Polivka et al. (2015) used floor plan drawings in their study of environmental health and safety hazards encountered by healthcare providers working in clients’ homes. During the focus groups, participants were given floor plan drawings of different rooms (bedroom, kitchen, etc.) and cutouts of furniture and objects (bed, sink etc.) ordinarily found in the rooms. Each participant was then asked to furnish their room with the appropriate cutouts, and draw in different kinds of safety concerns, before passing the floor plan drawing to the participant next to them. And so, the process continued until every participant had added their safety concerns to every room drawing. In addition to identifying the most commonly reported hazards, room-specific hazards were identified (Polivka et al., 2015).
This literature review is not exhaustive. Instead, the aim has been to show the diversity of ways in which floor plan drawings can be used to study healthcare personnel’s care practices, as both participant-generated and researcher-generated visual data, and to analyze qualitative as well as quantitative data. The presentation also demonstrates a diversity of research topics. However, I have not discovered any example of floor plan drawings being used to study healthcare personnel’s exercise of power. As such, this article appears to represent the first use of floor plan drawings to generate and analyze data on healthcare personnel’s exercise of power against service receivers.
Method Use: Studying Power Through Floor Plan Drawings
My doctoral project was an ethnographic study of staff’s exercise of power against two residents with intellectual disability in a small Norwegian group home (Henriksen, 2022). Here, I describe the study and elaborate on why and how the floor plan drawings of the group home were constructed and utilized as a tool during data generation and as a method of analysis.
Although this reconstruction makes the process appear consistent and structured into clear-cut stages, the actual process was far from linear. During both the fieldwork and the subsequent analytical work, the different stages or steps felt more like methodical and analytical leaps, as in the sense of throwing oneself into something new and strange with the hope of meaningful outcomes. The reconstruction appear linear and neat because it only includes the successful leaps, leaving out the ones that failed. In practice, one can also expect the sketching of floor plan drawings to generate analytical reflections and ideas. As such, floor plan drawings as a tool for data generation are more complementary to their analytical use than the reconstruction suggests.
About the Study
Four people lived and received daily care at the group home, but only two participated in the study – “Peter” and “Christian”. Peter and Christian were elderly men with intellectual disabilities and limited verbal skills. Peter was nonverbal, while Christian could articulate a few words, like “mum”, “yes”, and “pizza”. They participated because staff had implemented coercive measures in their apartments. In this regard, coercive measures are lawfully implemented measures that restrict individuals’ self-determination (Healthcare Act, 2011), often used to prevent challenging behavior. The daily care consisted of help with personal hygiene, housekeeping, cooking and leisure activities, and was provided by a staff group with diverse educational backgrounds and work experience. In all, 13 staff members participated in the study, five women and eight men. Data were generated in 2018, primarily through participant observation. In 2019, I revisited the group home, and in total, 286 hours of participant observation were conducted.
The floor plan drawings of the group home were not part of the study’s original design but originated from the need for an overview of the group home, and a fear of missing important physical features. The drawings were constructed early in the first period of observation, and since I regularly visited the group home and could double-check features, they are fairly accurate. They are not, however, to scale. I did not use a professional program but drew them by hand in my notebook and later digitalized them using Microsoft Paint. For my purpose, this worked very well. Four floor plan drawings were made: (1) Peter’s and (2) Christian’s apartment, (3) the common room and staff’s office, and (4) the main entrance, locker room, and corridor. Each drawing was supplemented with a list of content. The data and findings generated by the floor plan drawings supplemented the observational data and the findings from the more traditional analysis of the fieldnotes, which was constructivist coding strategy (cf. Charmaz, 2014).
The study’s theoretical framework combined symbolic interactionism and socio-materiality. The first premise of symbolic interactionism states that the meaning we ascribe to the object of our attention– whether this is a person, a chair (Blumer, 1986) or the whole situation (Goffman, 1974) – is decisive for how we act. To this, the Norwegian sociologist Dag Østerberg (1986) adds that physical, unanimated objects altered by us – which he calls materials – are marked by meaning due to our intentional and meaningful actions toward them. Because this meaning influences our interactions, materials can be seen as co-actors (Østerberg, 1986). Materials can also form material structures, referring to the intentions of past and present practices (Østerberg, 1986), and make up fields of materialized meanings, where social actors can be well or poorly situated. An actor who is well situated, succeeds with his intended practice, because his skills and abilities correspond to the socio-material field. A poorly situated actor will experience failure due to a mismatch between individual skills and the socio-material field (Østerberg, 1990). Framed by the definition of power as individuals’ opportunities to realize their own will in interaction with others (Weber, 2000), socio-material fields can influence social actors’ power by enabling or limiting their opportunities, and consequently, their practices.
Observational Sketching With Floor Plan Drawings: Generating Narratives and Identifying Practices of Control
I created the floor plan drawings by walking from one room to another in the group home, sketching them in the same notebook where I recorded all my fieldnotes. To the staff and the residents, this may have seemed a little peculiar, but it also helped ease the tension between us—the observer and the observed. The notebook became less threatening, even familiar, and as I was walking around, staff members would often engage in small talk, reminiscing about how things and rooms used to be. This way of generating data resembles the practice of observational sketching (Heath et al., 2018, p. 713), a method in which researchers draw their research fields or research objects in order to generate visual data. Sketching the floor plan of the group home can be considered a form of observational sketching that, in addition to generating visual data, supplemented the field notes with insight into the social practices that unfolded within the group home.
The construction of the floor plan drawings constituted a systematic scrutiny of the group home’s physical surroundings and generated data in the form of detailed and accurate descriptions of the physical surroundings of the group home. However, it also led me to notice material details previously taken for granted. For example, the front door to Peter’s apartment opened inwards, while Christian’s front door opened outwards. When asked about this, the staff explained how Christian’s door had been altered, from swinging inwards to swinging outwards, so they could exit the apartment faster when Christian was displaying challenging behavior (e.g. struck at them). This was a long time ago and Christian was no longer displaying this kind of behavior.
I also became aware of more short-term changes, like kitchen chairs changing places from one day to the next. Not all kitchen chairs in the group home were placed around kitchen tables. Some were placed alongside the walls of the corridor, the locker room, and common room, seemingly at random. However, during the evenings and nights staff would often move these chairs, from one wall to another, or from one room to another. At first, I was annoyed because I wanted the floor plan drawings to be accurate, which was impossible when the chairs kept changing places. Then I realized that this was an important material clue to social practices (cf. Østerberg, 1986) varying according to the time of the day. Another material clue was that several of the chairs, also the ones in the residents’ apartments, did not match the kitchen tables. When asked about this, the staff talked about old kitchen tables that had been discarded, but where the chairs had been kept, revealing that they were still useful.
The chairs turned out to be an important part of the staff’s exercise of power. The staff’s explicit goal in their care work was to keep the residents calm, which often entailed having the residents to sit still. In these situations, the kitchen chairs functioned as “stations of control” because it was easier for staff to control the residents when they were sitting down. For example, staff could stand in front of a sitting resident, making it difficult for him to stand up. Sitting down also made the residents move slower, giving the staff time to catch up and stop them. During the night, chairs placed in front of doors functioned as alarms by scratching along the floor, notifying the staff about doors being opened. This only worked on doors swinging outwards, like Christians’ front door, making him the only one subjected to this exercise of power.
To sum up, the construction of the floor plan drawings generated data in the form of (1) detailed and correct descriptions of the physical surroundings, and (2) narratives about past and present materials, and the social practices these materials hindered or enabled, including practices of control. With this, the floor plan drawings went beyond their purpose of being mere data to become tools that structured and enriched the data generation during observations.
Spatial Mapping of Staff’s Exercise of Power
Seeing the physical surroundings from a bird’s eye perspective sparked reflections and inspired a more analytical use of the floor plan drawings: I color-coded the floor plan drawings in order to map the various ways in which the staff exercised power. This method shares characteristics with mapping methods. However, it is not a method for generating data but for analyzing observational data. Looking back, the analysis consisted of several analytical leaps, here reconstructed into four steps: (1) Construct the floor plan drawings (2) Define the analytical question and the color-coding scheme (3) Color-code the floor plan drawings (4) Identify patterns and material structures
In Step 1, I used the same floor plan drawings that were produced during the observational sketching These were of (1) Peter’s and (2) Christian’s apartment, (3) the common room and staff’s office, and (4) the main entrance, locker room and corridor. Step 2 involved defining an analytical question to guide the color-coding of the floor plan drawings, along with determining what each color would represent. The analytical question was derived from one of the study’s research questions, “How does staff exercise power against the residents?”, and formulated as “Who controls what, when and how?”. The analytical question also ensured that the color-coding was not based on the staff’s understanding of power, nor on my own, but on the study’s definition of exercise of power — that is, the staff’s use of opportunities to realize their own will in interactions with residents (cf. Weber, 2000).
The color codes were based on a traffic signal schema – green, yellow and red – a familiar and intuitive set of colors. Green indicated rooms and items that the residents controlled and used freely. Yellow indicated conditional use, meaning that the staff controlled these rooms and items by stipulating conditions that the residents had to fulfil before using them. In addition, yellow indicated that staff would exercise power to force the residents into using rooms or items when certain conditions were not met. All conditions were determined by staff. Red indicated rooms and items completely controlled by the staff, and often reserved for, and used only by the staff. The items that remain black in the drawings are considered to match the color of the room (this is because items in the same color as the room would otherwise be invisible, due to the lack of outlines).
Staff’s Chairs and Bodies: Identifying Subtle and Intricate Forms of Exercise of Power
Step 3 was to color-code the floor plan drawings based on data generated through observations. This entailed a systematic review of every room and item, determining the most appropriate color for each. This was far from a straightforward process. Instead, it involved a lot of back and forth between the floor plan drawings and the fieldnotes, as well as constant reconsiderations and revisions. In return, the process generated significant findings on the more subtle and intricate forms of staff’s exercise of power.
One item that particularly generated reflections on power was Peter’s armchair. In Figure 1, which is the colored floor plan drawing of Peter’s apartment, Peter’s armchair is no. 14. Peter used his chair a lot and was also the only one to use it. Staff never used it. As such, the chair should have been colored green. However, when Peter sat in his armchair, staff would often wander around in the apartment: slowly walking from the living room to the entrance hall, from the entrance hall to the kitchen, and back again to the living room. They seemingly wandered without any purpose, like they were bored, and they did not appear to be exercising any form of power. But they had an overview of the apartment, including where Peter was and what he did. If Peter edged his way forward on the seat of the armchair, as if he were about to get up, the staff could sometimes look at him, which was often enough for Peter to lean back and remain seated. If not, if Peter continued to rise from his chair, the staff could take a step toward Peter, or even more subtly: shift their weight from one foot to the other. If this was insufficient too, staff could use different forms of physical force, from gentle pushing to more forcefully grabbing Peter’s shoulders, and leading him back to the armchair. The Colored Floor Plan Drawing of Peter’s Apartment With a List of Contents (Table 1) The List of Contents of Peter’s Apartment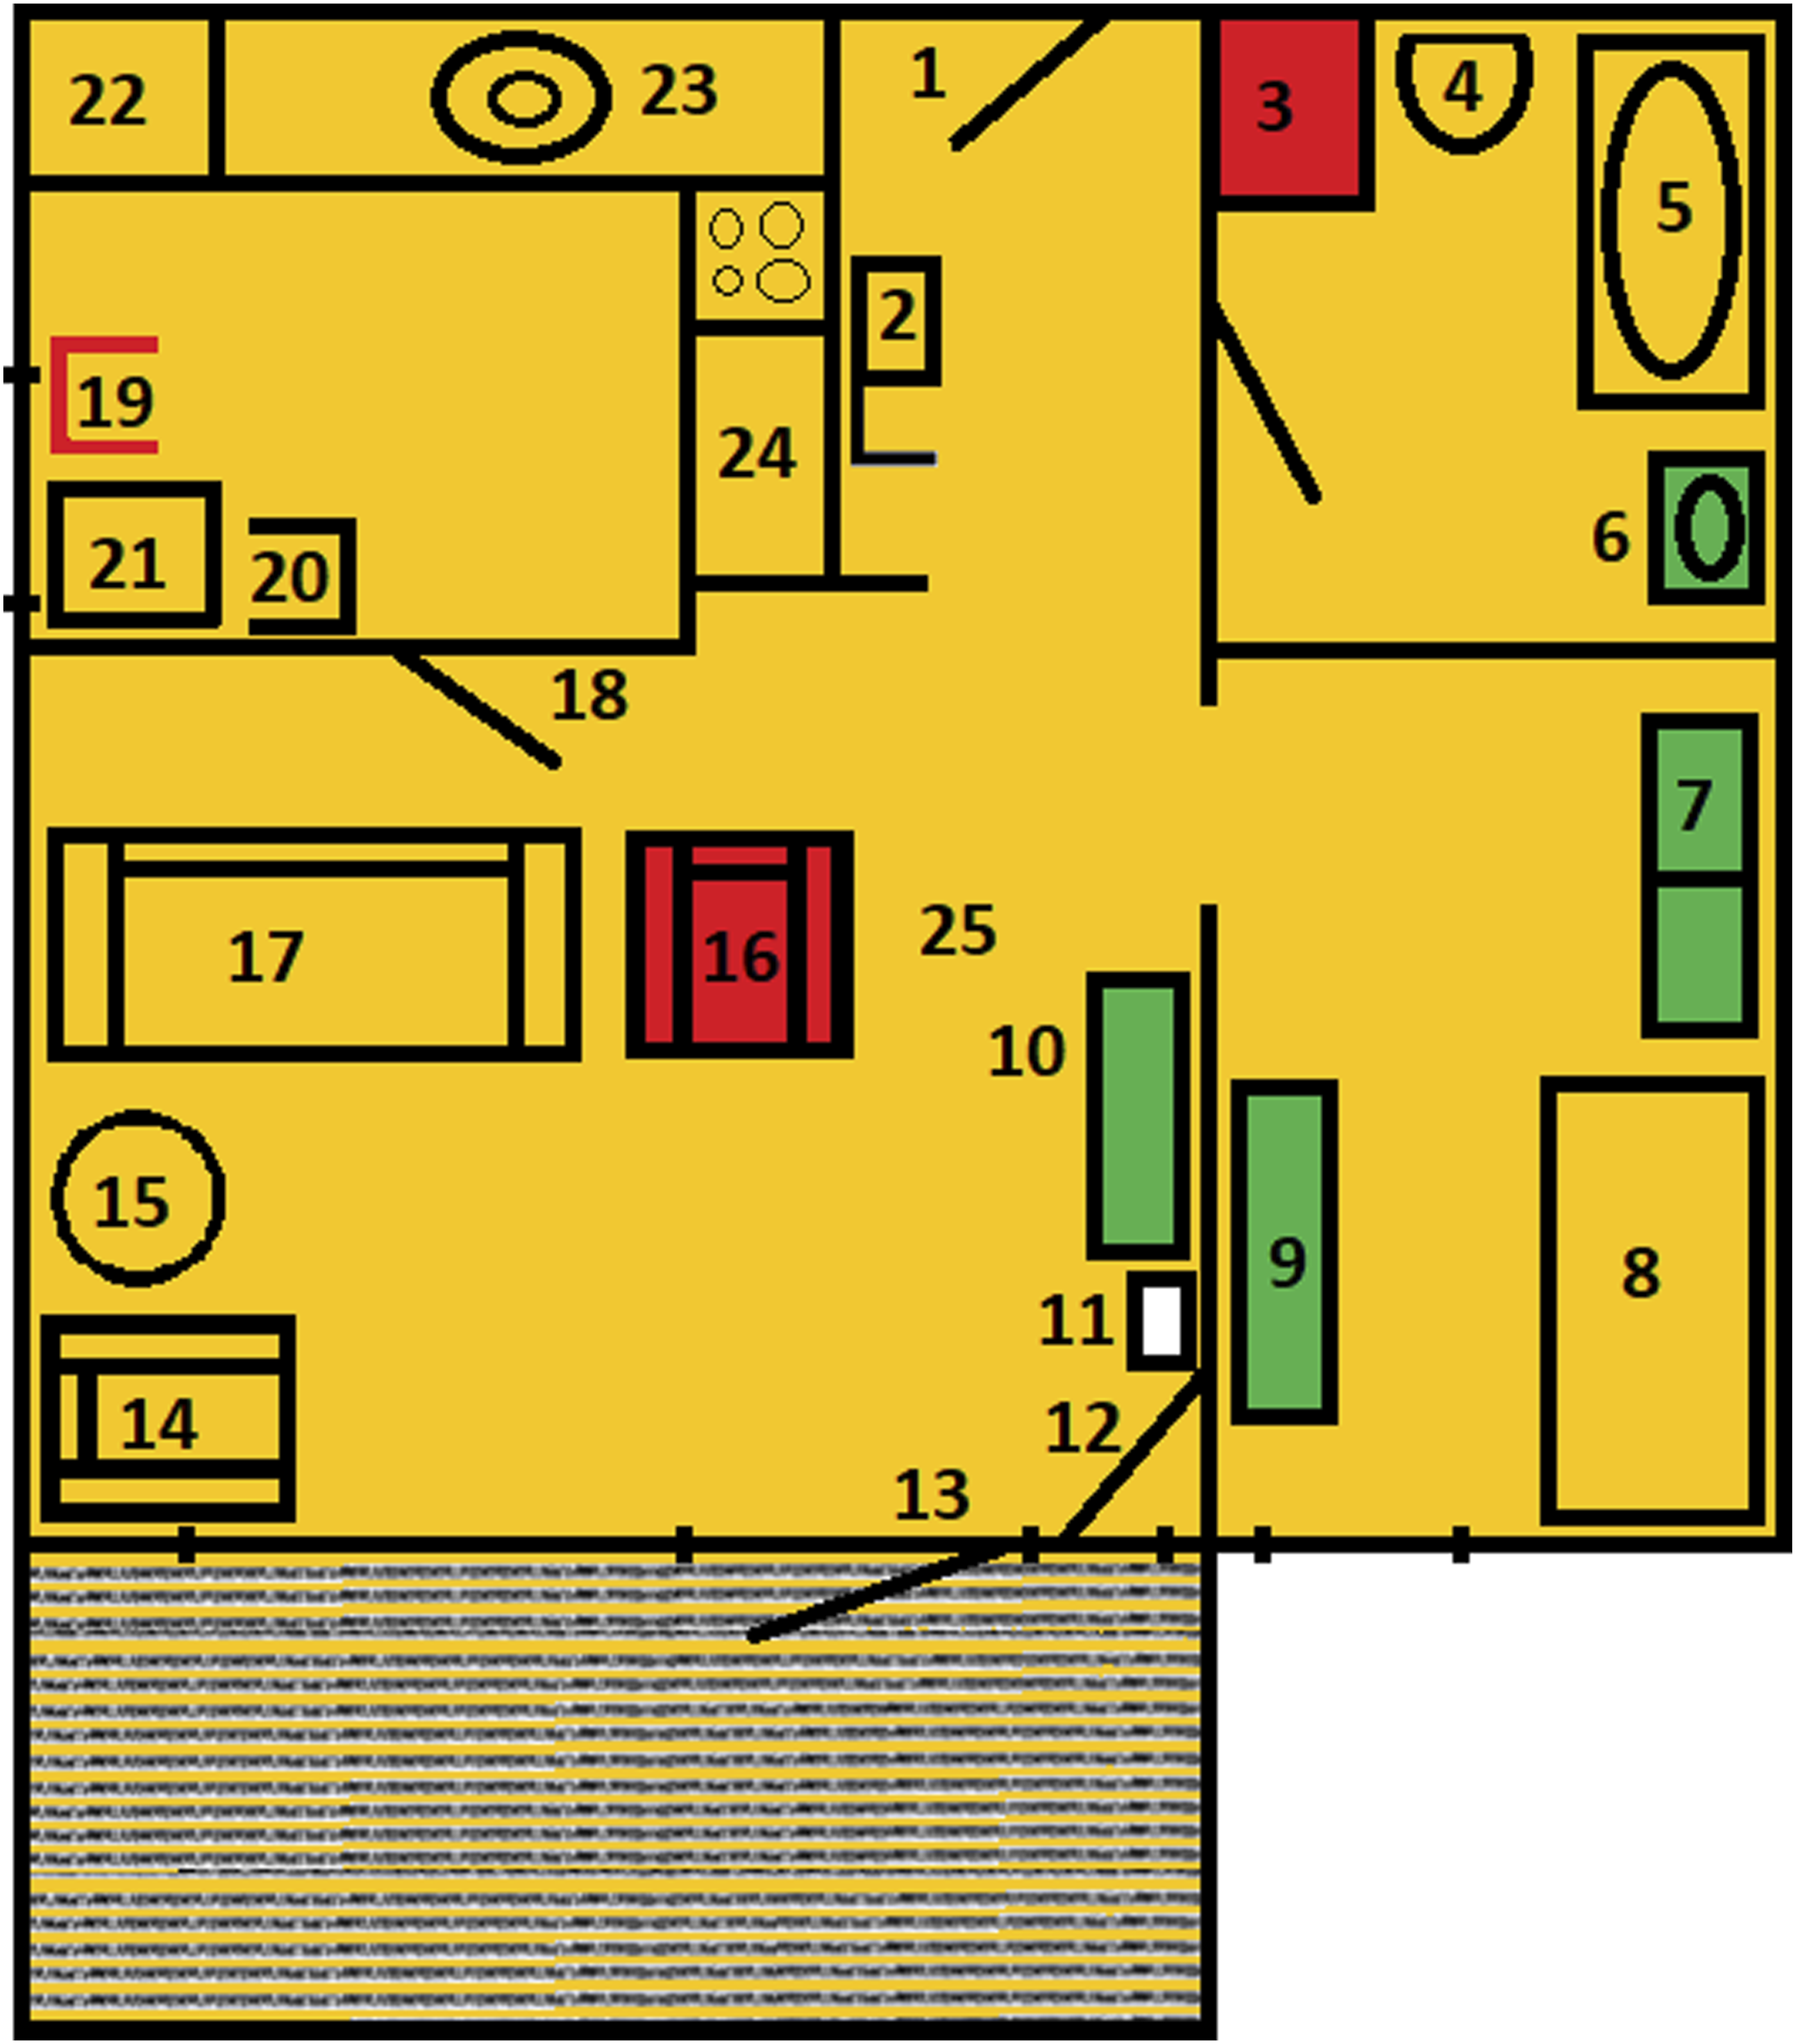

The constant surveillance of Peter brings associations to Foucault’s (1977) theorizing on self-surveillance, while the staff’s steps toward Peter can be viewed as threats of physical force. Their continuous effort to get Peter to sit still was based upon a desire to keep him calm. Due to this, the armchair could have been colored red. However, Peter was the only one to use it, and more importantly, there were several times when he seemed to use it voluntarily. The armchair was therefore colored yellow. It can, however, be argued that Peter was only allowed to use his chair because this coincided with the staff’s desire. The example of Peter’s armchair illustrates the messy but also exploratory color-coding process as it prompted a closer examination of interactions between staff and residents.
Coloring Peter’s armchair yellow also seemed right when comparing it to the other armchair (Figure 1, no. 16). This second armchair was, immediately and without a doubt, colored red. Peter never used this chair because it was reserved for the staff, hence its nickname, the “staff chair”. Having their own chair in the residents’ apartments was one of several practices that on closer inspection was more symbolic than related to actual dirt (Henriksen & Sandvin, 2023). The “staff chair”, combined with the sofa (no. 17), also constituted what one staff member described as an “obstacle course”, and which function it was to delay Peter by forcing him to go around the sofa and the “staff chair” to get to the front door. This gave the staff enough time to catch up with Peter and stop him, either by blocking him with their bodies or using physical force. The staff’s use of their own bodies in their capacity as solid matter, combined with their wandering in Peter’s apartment, resulted in them being placed in the floor plan drawings. Just like the materials, the staff were given a number (no. 25) and situated between the “staff chair” (no. 16) and the sideboard (no. 10), where they repeatedly passed by when wandering and where they usually stopped Peter. This illustrates how the color-coding process, in addition to identifying subtle forms of exercise of power, also identified intricate and complex forms of power, primarily by enabling the analysis of physical objects, including the staff themselves, and their use in relation to one another.
The staff did not use any kind of physical force against Christian or threaten to do so. Neither did they wander or move any furniture in his apartment. The exercise of power against Christian was more verbal. Staff could therefore not be placed in the floor plan drawing of Christian’s apartment. This highlights important differences in how the staff’s exercised power against the two residents, which in turn reflected differences in how the staff interpreted and understood them, and ultimately providing insight into the underlying reasons for the staff’s exercise of power.
Armchairs and Counterpower: Gaining Insight into the Residents’ Perspective
As part of the color-coding process, I imagined myself sitting in the residents’ armchairs, where they spent most of their time. In Christian’s apartment this meant sitting in the middle of the apartment. As one can see in Figure 2, tables, kitchen counters and other surfaces in Christian’s apartment are colored yellow. This is due to the staff’s perpetual tidying of these surfaces. The staff believed that “stimuli” in the form of visible things could cause Christian (and Peter) to become agitated, and they therefore tried to keep this “stimuli” at a minimum. For example, the staff could say “we must tidy up before you can have dinner”, implying that if Christian did not tidy up, dinner would not be served. Christian, for his part, seemed to prefer it differently, because he kept placing cups, magazines, and other things on the surfaces. In contrast to Peter, Christian was able to say “no” and often did so when staff tried to get him to tidy up or allow them to do it. With this, Christian exercised counterpower: he met the staff’s exercise of power with his own and succeeded (to a certain extent). The Colored Floor Plan Drawing of Christian’s Apartment With the List of Contents (Table 2) The List of Contents of Christian’s Apartment

To avoid Christian’s counterpower, the staff used closed or rhetorical questions. But most of the time they tried to be tactful. For instance, when moving between rooms, they could casually take a cup or two to the kitchen. However, from his chair (Figure 2, no. 23), Christian had an overview of the apartment. This made it difficult for the staff to be tactful, because the physical surroundings allowed Christian to monitor both them and the items they took. Thus, the physical surroundings were an important part of Christian’s exercise of counterpower, indicating that he was well situated within the socio-material field constituted by his apartment (cf. Østerberg, 1990).
Another reflection that emerged during the color-coding process was this: Did Christian place things on tables and the likes of it to entertain himself? Like Peter, Christian did not have a job or any daytime activities. The day was usually spent drinking coffee in the common room and watching TV in the apartment. Placing items around the apartment was an activity in itself, but perhaps even more entertaining was watching the staff try to tidy it up and occasionally telling them “no”. This is an alternative interpretation to that of the staff, who interpreted Christian as agitated because of too much “stimuli”.
The view from Peter’s armchair (Figure 1, no. 14) was similar to Christian’s view, but the outcome was very different. Peter saw most of his apartment but rarely had access to it. From Peter’s perspective, the sofa and the “staff chair” (no. 17 and 16) blocked the walk to the kitchen, leaving only the space between the “staff chair” and the sideboard (no. 10) open. However, this space was usually blocked by the staff (no. 25). When Peter was sitting still in his armchair, it was not necessarily because he wanted to, or because the staff’s wandering made him calm, as staff believed. But because every exit was blocked. This was one of the reasons why the whole apartment was colored yellow.
Peter would still try to leave, often by making a run for it when the staff wandered a little too far into the kitchen. He could make it to the front door but rarely any further. Because his front door swung inwards, Peter had to stop, grab and turn the door handle, take a step back and swing the door open. This gave staff enough time to catch up with him. Hence, his counterpower was rarely successful. Despite it being Peter’s home, he seemed poorly situated (cf. Østerberg, 1990). This illustrates how the color-coding process prompted me to view rooms and items, and furthermore, the staff’s exercise of power, literally from the residents’ point of view. As such, the color-coding process contributed to insight into the residents’ perspectives, which was especially valuable since they did not speak, sign, or otherwise communicate with me.
Completed Floor Plan Drawings and Their Material Structures: Revealing the Extent of Exercised Power and Identifying Power Relations
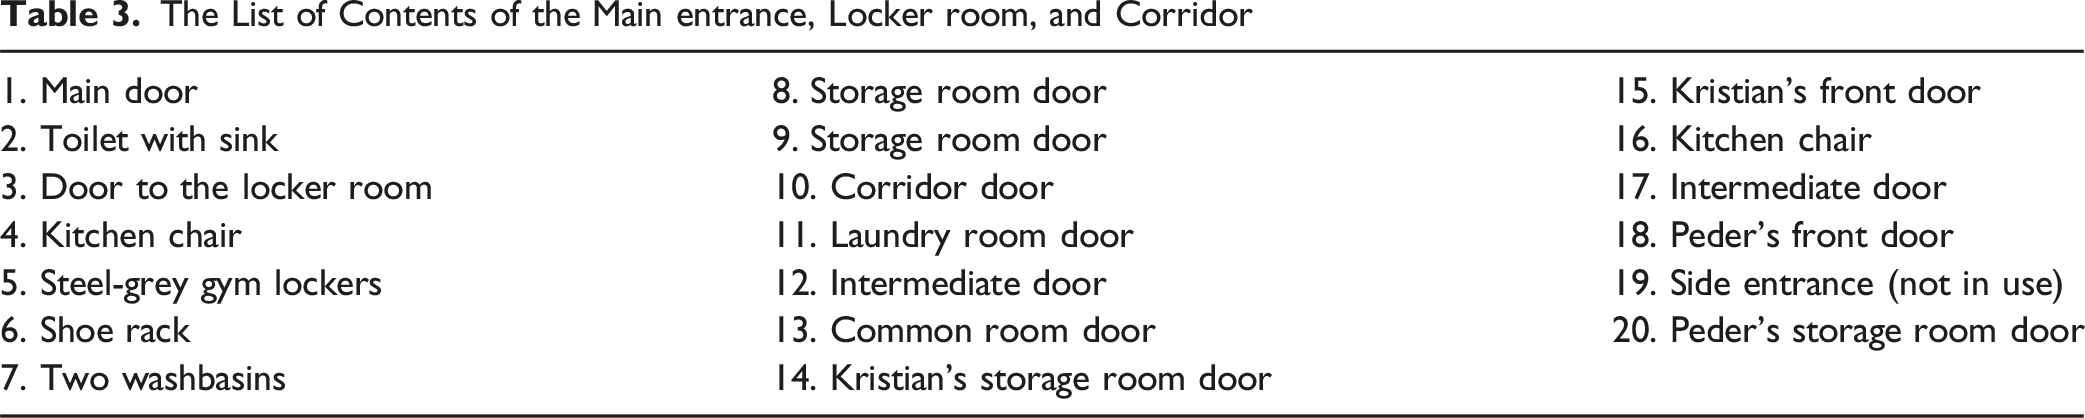
The fourth and last step was to interpret the completed, color-coded floor plan drawings, that is, to identify patterns in the staff’s exercise of power, as well as material structures related to power relations. One of the first things to become apparent through the four color-coded floor plan drawings was the extent of staff’s exercise of power in the residents’ everyday life. The residents’ apartments (Figures 1 and 2) contained some green rooms and items, although not as many as one might expect considering these were their homes, while the main entrance, locker room, and corridor (Figure 3), as well as the common room and staff’s office (Figure 4), were colored yellow and red. Nothing was colored green in the latter two drawings, indicating that the staff controlled all rooms and items outside the apartments. The pervasive extent of the staff’s exercise of power raised several critical questions – concerning the necessity and justifications of staff’s practices, the residents’ right to self-determination, and the nature of power relations. The Colored Floor Plan Drawing of the Main Entrance, Locker Room, and Corridor With the List of Contents (Table 3) The List of Contents of the Main entrance, Locker room, and Corridor The Colored Floor Plan Drawing of the Common Room and Staff’s Office With the List of Contents (Table 4) The List of Contents of the Common Room and Staff’s Office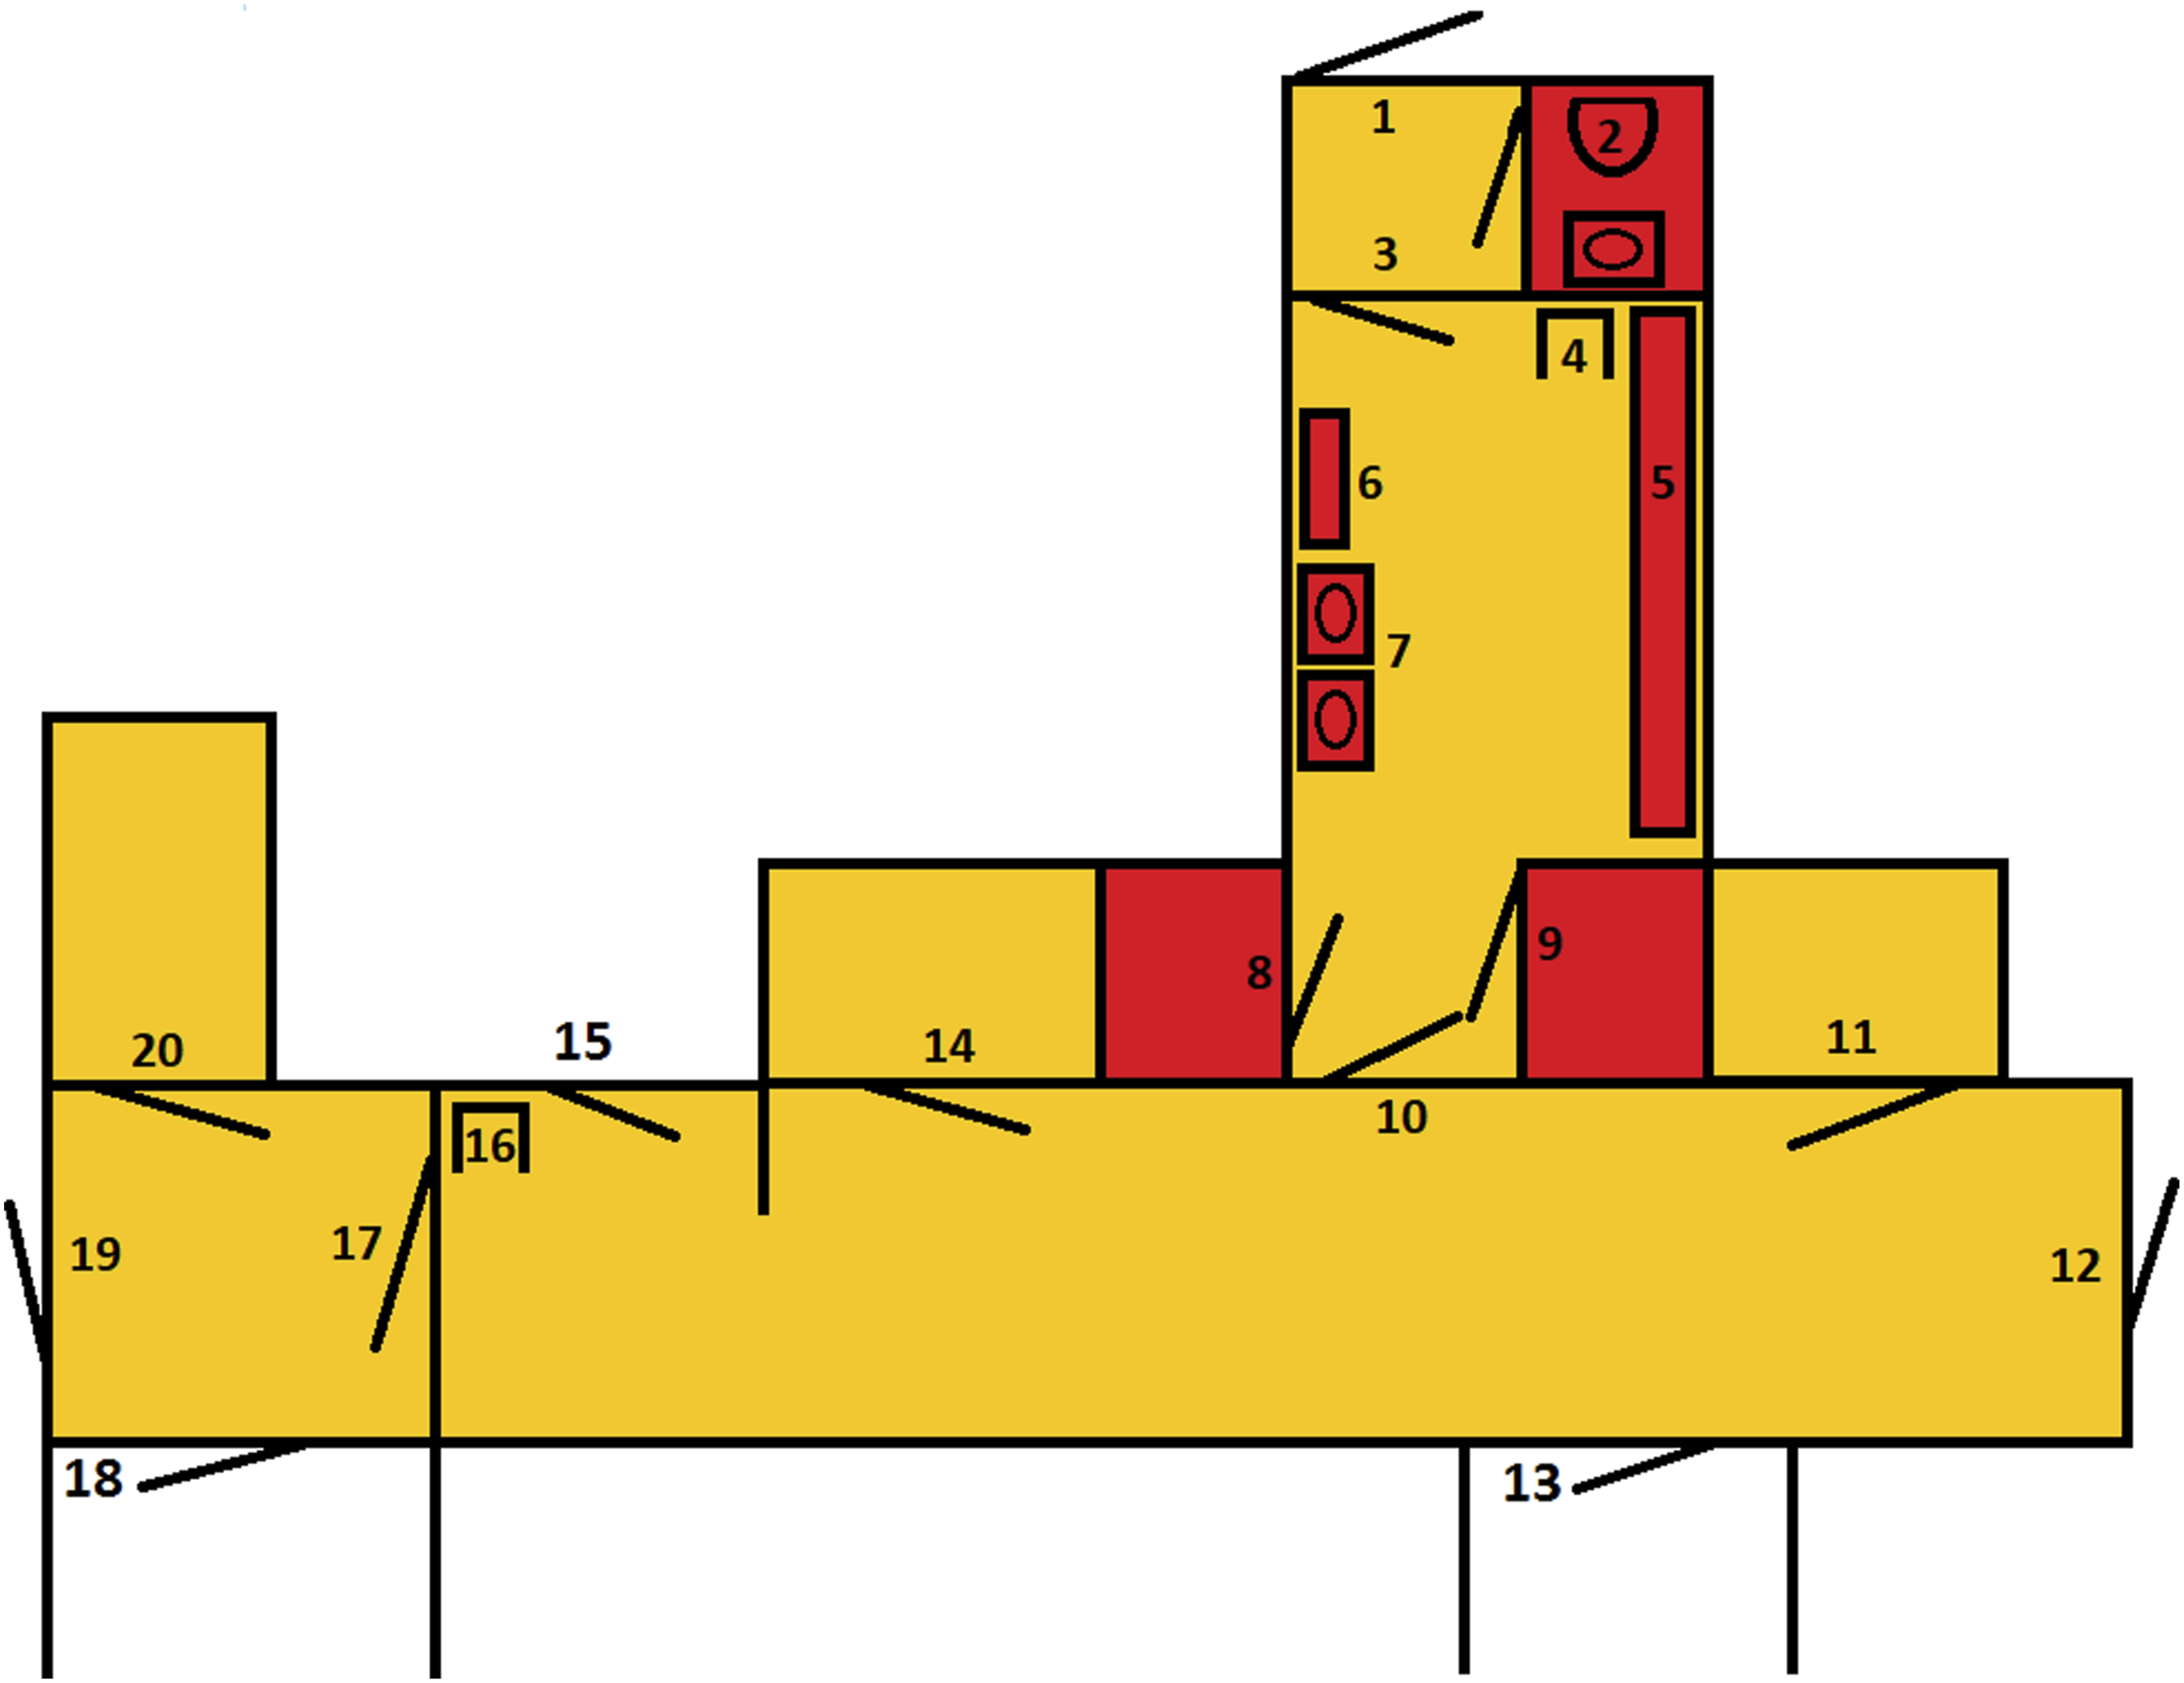


Furthermore, the floor plan drawings effectively made material structures (cf. Østerberg, 1986) more tangible and available for analysis. For example, the material structure of Peter’s apartment reflected an intention to control Peter’s movements – to contain him, in the armchair, the living room or the apartment.
Another example is the material structure in the common room, which seem to reflect that the room was intended for two different social communities – one among the staff and another among the residents. Due to hygiene reasons, the staff had decided that the residents were not allowed sit in the same seating area as staff members. Therefore, the staff sat around the living room table, in the armchair (Figure 4, no. 19) and the two sofas (no. 16 and 18), while the residents sat around the kitchen table (no. 21) on kitchen chairs (no. 20, 22, 23 and 24). Furthermore, the staff’s seating area appeared more closed off than the residents’ seating area. While two of the kitchen chairs usually had their backs against the wall, facing the living room table, the armchair and sofas were oriented toward the living room table and turned away from the kitchen table. As such, the material structure also appeared to reflect a desire among the residents to be included in the social community of the staff.
Central to the analytical process were the memos I kept while color-coding the floor plan drawings. I documented what I did, methodological reflections and tentative findings, as well as the reasoning behind the color-coding. This helped me recall why rooms and items were assigned specific colors and made it possible to critically review the coding. The analysis also had a clear comparative dimension. In Step 3, I compared items, rooms, and the exercise of power, and in Step 4, I compared the completed floor plan drawings to one another, including their material structures.
To sum up, the spatial mapping of staff’s exercise of power with the use of floor plan drawings appears particularly suitable to identify subtle and intricate forms of exercise of power, as well as material structures related to power relations. This analytical method also contributed to insight into the residents’ perspectives, while the completed, color-coded drawings illustrated the extent of staff’s exercise of power. Memos and comparisons played a central role in what proved to be an iterative analytical process.
Discussion: Methodological Strengths and Limitations
Common for many of the studies using floor plan drawings to generate and/or analyze data is the belief that physical surroundings can shed light upon social life. For example, Kuboshima and McIntosh (2023) presupposes that the physical environment influences service receivers’ quality of life, while McGrath et al. (2020) understand human “experience as both materially located and culturally patterned”. I did the same, by including socio-materiality in the study’s theoretical framework. This was important for the development, but also the use of the floor plan drawings.
Adopting the view that materials are co-actors in social life (Østerberg, 1986), not only forces researchers to focus on physical surroundings but also to take materials seriously, without knowing if they will be important or not. Sketching floor plans aligns well with this. Compared to mapping methods, which often generate data based on predefined categories of emotions (McGrath et al., 2020) or behavior (Cai et al., 2021), it is difficult to predict which kind of data that will be generated by sketching floor plan drawings. It will depend on which material clues the researcher notices and asks about, and what kind of stories the participants tell. It could be data on exercise of power, but also on service receivers’ financial situation or homemaking. In my study, sketching the floor plan drawings generated data on all three of these. On one side, this is a limitation as the data generation will be unpredictable. On the other side, it can be a strength in exploratory research. Heath et al. (2018, p. 718) describe their use of observational sketching as “experimentally” and does not view this as problematic as long as it is accompanied by other methods. Therefore, sketching floor plans should be combined with observation, and to a certain degree it must be – for the researcher to be able to draw the floor plan drawings.
Color-coding the floor plan drawings is a more purposeful method as it uses predefined categories (color-codes) representing different degrees of control over room and objects. The use of color-coding makes it resemble Johnson’s (2018) use of floor plan drawings to analyze spatial and material boundaries concerning bodily waste. Another similarity is findings in the form of detailed interaction patterns. For me this was the staff’s use of their own bodies when exercising power, among other things, while Johnson (2018) describe carefully performed rituals for dealing with human waste. It may seem as though a systematic review of floor plan drawings enables an analysis of even the most subtle actions and patterns.
At the same time, certain aspects are concealed. When applying visual methods, researchers need to be aware of “the inevitable difference between the depicted (the referent) and the depiction (the visual representation), a difference that can seriously influence or even misinform views on the depicted” (Pauwels, 2010, p. 557). For example, photos always render some things visible, and others invisible (Packard, 2008). The same applies to floor plan drawings as they do not include details such as ornaments, wall colors, and family pictures. From a socio-material perspective, this can be regarded as a form of reducing the complexity of places.
A related limitation is that floor plan drawings do not capture different use of rooms and items depending on the hours of the day. In my study, I solved this by coloring the relevant rooms and items yellow. For example, the gate in front of Peter’s kitchen (Figure 1, no. 18). This was open during the day and locked at night, and could therefore have been colored green or red. The gate were colored yellow, as an average between green and red. Still, the complexity in the exercise of power is reduced. This is important to consider, particularly in regard to the overview illustrating the extent of the staff’s exercise of power. The colored drawings do not give a still frame of an exact moment in time, nor do they capture every form of power exercised. They give an average image. If temporal differences in exercise of power had been a focus, one could have colored multiple floor plan drawings, each representing a specific time of day.
Another option is photography. Dunn (2021) took pictures of the nursing homes she studied, and established use of space over time based upon when the pictures were taken. However, “photos can be too detailed and particularistic” (Pauwels, 2010, p. 556). Reduced complexity may be a strength of the floor plan drawings, for instance, by making the color-coding manageable and the material structures tangible. It is still important to be aware of this limitation, especially when deciding what to include and what to omit when constructing the floor plan drawings.
In regard to using floor plan drawing to map exercise of power, the concept of being well or poorly situated in socio-material fields (Østerberg, 1990), prompted me to view the physical surroundings and staff’s exercise of power from the perspective of the two residents. Peter and Christian represent a group of people particularly challenging to include in research. They have limited verbal and writing skills, and they do not use augmentative or alternative communication. In addition, they cannot operate a camera or place stickers on maps due to reduced fine motor skills. Due to cognitive impairments, it is also difficult to ensure that they understand directions well enough to complete certain participatory visual methods. Hence, interviews and visual methods such as photovoice (Glegg, 2019) and emotion mapping (McGrath et al., 2020), are not suitable data generation methods.
Observation may be the only possible method to include this group, but healthcare personnel’s perspective would likely still dominate. Both during and after observations they can explain their actions and share their experience, including what they think are the experience of the service receivers. Therefore, even when doing observation, the perspectives of service receivers are mainly mediated through healthcare personnel, which is both ethically and scientifically challenging. A key concern during my study was to which extent the staff could neutrally mediate the residents’ perspectives given that the topic was the staff’s own exercise of power. The concern proved to be valid. For example, because Peter was being calm (sitting still in his armchair), the staff thought he liked it when they wandered in his apartment. Consequently, the staff did not define their wandering as exercise of power. Neither did they see the rule of separate seating areas as a form of exercise of power.
Service receivers like Peter and Christian depend on the researcher’s ability to observe, reflect on and understand situations from their point of view. Using floor plan drawings to analyze health care personnel’s exercise of power can aid researchers in achieving this: gaining valuable insight into the perspectives of service receivers, which can be difficult, if not impossible, to achieve by other means. Furthermore, this insight could strengthen the voice of a vulnerable group at risk of being marginalized in research. However, it is not gained directly from the service receivers themselves and must be treated accordingly. Among other things, researchers should be transparent about how the insight (data) are generated: that it is mediated through the researcher and therefore at risk of being shaped by the researcher’s values, opinions and experiences.
Alternative Uses
Color-coded floor plan drawings will always represent the researcher’s perspective. However, to check or nuance this perspective, the drawings could be introduced to and discussed with healthcare personnel (and service receivers, if possible) as a form of member checking. These conversations or interviews could generate additional data on healthcare personnel’s understanding of their own exercise of power, and the extent of it. Like photos (Prosser & Loxley, 2008), floor plan drawings could potentially make it easier for healthcare personnel to talk about their thoughts and behaviors. The floor plan drawings can also illustrate the exercise of power more concretely, which in turn can prompt memories, ideas, and reflections, as well as facilitate a shared understanding (cf. Glegg, 2019) and prevent misunderstandings between researcher and participants.
It is also possible to take a participatory approach, by asking healthcare personnel and service receivers (if possible), to color the floor plan drawings themselves. In this regard, the floor plan drawings would be participant-generated visuals. The participants could color floor plan drawings individually or in groups, before, during, or after interviews, based on the question “who controls what, when and how?” (or other questions, depending on the research questions). As previously mentioned, the staff at the group home did not understand their wandering in Peter’s apartment as exercise of power. They would probably have colored Peter’s armchair green. What else would they have colored differently, and why?
While this sparks curiosity, it is also a reminder of the potential limitations of participant-generated visuals. “[P]articipatory maps are subjective representations of spaces” (McGrath et al., 2020, p. 78). In addition, subtle forms of exercise of power can be informal and taken for granted as everyday practice. This challenges the use of interviews, where the researcher must rely on the participants’ memory and awareness of their own exercise of power. Furthermore, the exercise of power against others is generally considered taboo, and perhaps even more so when it is exercised by healthcare personnel against vulnerable service receivers. This, combined with the fact that healthcare personnel’s values often go against exercising power, can make it a difficult subject to be open about. Hence, as a participant-generated visual, the floor plan drawings would generate data on participants’ conscious and explicitly expressed reasoning behind their color choices.
After completing the color-coding, comparisons of participants’ colored floor plan drawings could generate data on differing understandings of power and exercise of power between healthcare personnel and service receivers, as well as within each group. This participatory use of floor plan drawings could empower participants by reducing researchers’ influence over the research (Pain, 2012) but it could also cause harm. With participant-generated visual, there is a risk of participants reliving traumatic situations (Cox et al., 2014).
Ethical Considerations
When utilizing visual methods, researchers must rethink ethical issues (Cox et al., 2014), such as confidentiality. When combined with other information, floor plan drawings can cause participants to be identifiable. To protect participants’ confidentiality, floor plan drawings should not be presented in full, or in any other way that makes it possible to recognize a building. This is particularly important if the building is an institution with an unusual design.
Another ethical consideration is that there is a potential for distress when participants are “faced with the images they have produced” (Cox et al., 2014, p. 11), such as the overviews of the healthcare personnel’s exercise of power against service receivers. Despite being researcher-generated visuals, these can be overwhelming for healthcare personnel, service receivers and next of kin since they depict the power they exercise onto others, are subjected to themselves or that their family members are subjected to.
To minimize the risk of distress, researchers should be attentive to the colors used during the color-coding. In my project I sought a neutral understanding of power (as far as possible), but the red and green colors did not reflect this. Instead, they might have reinforced traditional associations about power as something bad and the absence of power as good. Future use should therefore entail neutral colors.
Finally, the use of floor plan drawings depends on observation. Firstly, the researcher needs access to the physical surroundings to construct floor plan drawings, and secondly, the color-coding is based on observational data. The first reason does not imply a long observation period, however, the second implies a period long enough for the researcher to get in-depth knowledge of staff’s actual exercise of power in order to complete the color-coding. Observation entails its own set of ethical challenges, which can be amplified when conducted in someone’s private home (Pink et al., 2017).
Conclusion and Implications
This article has illustrated how the use of floor plan drawings as visual methods for generating data and analyzing observational data can contribute to the study of healthcare personnel’s exercise of power against service receivers. Sketching floor plans can enrich the data by generating detailed and accurate descriptions of the physical surroundings where the exercise of power unfolds, as well as narratives about physical surroundings and the social practices they hinder or enable, including healthcare personnel’s practices of control. Color-coding floor plan drawings, based on data generated through observations, appears particularly suitable to identify subtle and intricate forms of exercise of power, contributing to insight into service receivers’ perspectives, illustrate the extent of staff’s exercise of power and identify patterns and material structures related to power relations.
By being able to generate data and findings that often evade traditional methods, floor plan drawings have the potential to bring some much-needed attention to the more subtle and intricate forms in which healthcare personnel exercise power, both in healthcare research and in clinical practice. With increased awareness and improved methods, more researchers may be encouraged to explore and generate knowledge about these forms of exercise of power. In addition, these visual methods are grounded in a broad understanding of power, which may contribute to theoretical development in areas such as power dynamics and ethics. Simultaneously, the field of visual methods itself is strengthened through their application.
The knowledge generated through these visual methods could inform clinical practice by making visible the subtle and often taken-for-granted exercises of power. Furthermore, understanding why healthcare personnel exercise these forms of power could help identify barriers and contribute to the development of measures to prevent excessive and unnecessary exercise of power, as well as to ensure that necessary exercise of power is carried out in a professionally and ethically sound manner.
The analytical method of color-coding floor plan drawings can also be used as a reflective tool directly in healthcare services, to generate awareness and reflections about how and why healthcare personnel exercise power, as well as to provide insight into service receivers’ perspectives. In this way, spatial mapping may support user involvement, especially when other means are difficult or impossible. Finally, whether it is through research-based knowledge or reflective, situated knowledge, reducing excessive and unnecessary exercises of power will likely contribute to improved health and quality of life for service receivers.
Footnotes
Ethical Considerations
The study was reported to the Norwegian Agency for Shared Services in Education and Research (ref. no. 57993).
Consent to Participate
The study followed the ethical guidelines of the Norwegian Agency for Shared Services in Education and Research, including obtaining informed consent from the healthcare personnel and the residents’ next of kin. Since the residents were deemed incapable of providing consent, their next of kin consented on their behalf.
Consent for Publication
Both healthcare personnel and next of kin consented to publication.
Funding
The author disclosed receipt of the following financial support for the research, authorship, and/or publication of this article: Nord University funded the doctoral project on which this article is based.
Declaration of Conflicting Interests
The author declared no potential conflicts of interest with respect to the research, authorship, and/or publication of this article.
Data Availability Statement
Data sharing not applicable to this article as no datasets were generated or analyzed during the current study.