
Abstract
Community-engaged research is an approach that helps foster partnerships between community members and researchers by incorporating community members across multiple stages of the research study. In doing so, researchers can gain a deeper understanding of the insider perspective. One area that has received limited attention is the process of engaging community members in qualitative data analysis. To overcome this limitation, we outline how we implemented and adapted the Rigorous and Accelerated Data Reduction (RADaR) technique to explore learners’ perceptions and experiences of a tailored research best practices training for community health workers and promotoras. We reflect on the strengths and challenges of using the RADaR technique in community-engaged research and provide a list of considerations for researchers engaging in a similar process. We also incorporate the community partner’s perspectives on engaging in qualitative data analysis. This article provides a step-by-step approach for engaging community partners in the qualitative data analysis process, particularly using the RADaR technique, as a strategy for enhancing research quality and mitigating the power imbalance between researchers and communities.
Keywords
Introduction
Community-engaged research encourages collaboration between community members and researchers during the research process to ultimately benefit the communities involved (Clinical and Translational Science Awards Consortium Community Engagement Key Function Committee Task Force on the Principles of Community Engagement, 2011; Khodyakov et al., 2016). Several frameworks inform community-engaged research in the United States, including community-based participatory research and participatory action research (Ahmed & Palermo, 2010). These frameworks are similar to patient and public involvement and engagement frameworks outside the United States (Greenhalgh et al., 2019). Regardless of origin, they share the same goal of understanding and improving health, quality, and equity for all (Holkup et al., 2004; Israel et al., 2013; Stocker et al., 2021; Wallerstein & Duran, 2010).
Researchers are increasingly engaging community members in various roles ranging from community outreach and education to advisory boards and decision-makers on the study team (Sanders Thompson et al., 2021). Community members are often involved in helping the study team understand the ‘insider’ perspective at various stages of the research, including planning and designing the study, recruiting participants, summarizing and/or interpreting the data, and disseminating findings (Jacquez et al., 2013; McDavitt et al., 2016). For example, Jimenez and colleagues (2019) conducted ethnographic interviews with a community member before conducting semi-structured interviews with participants to enhance their sampling approach and interview guide. Despite the level of involvement of community members across different research stages, additional ‘insider’ involvement in other aspects of research is often absent.
Ideally, ‘insiders’ should be involved in the process of analyzing data. Researchers engaging individuals with disabilities provide some insight into these community-engaged research processes for quantitative data (e.g., Ehde et al., 2013; Frankena et al., 2019; Gauld et al., 2011; Kramer et al., 2011; Stevenson, 2014; Tanabe et al., 2018). However, the steps they recommend for quantitative data analysis do not necessarily apply to qualitative data analysis as the community partners analyzed numeric findings and visuals. Some guidance exists to help inform US-based researchers on how to integrate non-scientists in qualitative data analysis (Garfield et al., 2016; Jennings et al., 2018; Stevenson, 2014), but this work often focuses on patients and the public as healthcare consumers rather than as research partners.
Patient and public involvement (PPI) and engagement literature from outside the U.S. offers insights into collaborative data analysis where community partners become co-researchers in the analytic process (Aiyegnusi et al., 2023; Jennings et al., 2018; Stocker et al., 2021). In developing a methodology for collaborative data analysis, Jennings and colleagues (2018) engaged PPI partners to inductively create codes using a small sample of transcripts and the researchers deductively applied the codes across all the remaining transcripts. The PPI partners provided the fundamental codes, while the researchers used these codes to inform the remainder of the qualitative analysis process. Although researchers provided flexibility to PPI partners in the coding process, one limitation of this approach is that the patient partners were not involved throughout the entire data analysis process. Stocker et al. (2021) also developed a step-by-step process for collaborative qualitative analysis with PPI partners. However, in their process, all members of the research team transcribed and analyzed the data and held a workshop with PPI partners to present coded segments and a list of themes for PPI partners to interpret and apply. After, the research team held discussions with PPI partners to explore how their themes were supported or not and discussed discrepancies. This approach suffers from the same limitation – PPI partners are involved in one phase of the qualitative analysis process rather than being engaged throughout. Therefore, while the PPI literature provides some broad guidance for how to integrate non-researchers across steps of qualitative research, the strategies are study specific. Limited literature details how researchers can adapt existing methods to engage community members throughout the entire qualitative data analysis process, rather than promoting engagement with either developing codes or reviewing themes. Therefore, additional step-by-step guidance anchored by a specific qualitative analysis technique is valuable for aiding researchers’ understanding of the methods, strengths, and challenges of engaging community members in qualitative data analysis. This novel approach is critical to qualitative research as it helps researchers further adapt and advance existing rigorous qualitative methodologies and techniques by centering community partners in the process.
The purpose of this article is to provide guidance and actionable strategies for engaging community members in qualitative data analysis. We detail how we engaged a community member, specifically a community health worker/promotora, using the Rigorous and Accelerated Data Reduction (RADaR) technique in the qualitative analysis process to explore learners’ perceptions and experiences of research best practices training for community health workers and promotoras. We also reflect on the strengths and challenges of using the RADaR technique within the context of community-engaged research and highlight modifications we made to facilitate our process. Finally, we provide recommendations to researchers interested in using the RADaR technique in collaboration with community members to analyze qualitative data.
The RADaR Technique
The Rigorous and Accelerated Data Reduction (RADaR) technique was developed to rapidly and rigorously analyze qualitative data (Watkins, 2017). The RADaR technique can be applied across various qualitative data sources including interviews, focus groups, documents, and case studies, and typically takes both an individual and team-based approach to qualitative coding and analysis (Watkins, 2017). Using a five-step process, this technique guides researchers through the process of organizing, reducing, coding, and analyzing data through several iterations.
Step 1 of the RADaR process involves formatting the qualitative data (e.g., transcripts) in a similar manner with relevant document headings and sub-headings (e.g., interview questions, participant responses, codes, notes, participant identifier number). Once a common template has been established, step 2 involves copying and pasting all text from the qualitative data documents (e.g., transcripts) in tables to facilitate the data reduction and coding processes. Tables can be created using programs from the Microsoft Suite (i.e., Word, Excel) or Google Workspace (i.e., Docs, Sheets) for ease of use and sharing between analysts. In step 3, the data from the tables are reduced by removing segments of text that are not relevant to the research question(s). Initially, the removal process involves highlighting text in grey, then deliberating with the analysis team about whether those rows and segments of data address the research question(s) or not. If not, then those greyed segments of data can be removed, resulting in a more focused table of data known as the phase 2 data table.
Often, analysts work independently on these steps and then come together to discuss any discrepancies in their decisions about the greyed rows and segments of data. In step 4, the analysts repeat step 3 by reducing data in the phase 2 data table to generate a more refined data table. Note that step 4 can occur as many times as necessary, moving analysts toward data that includes only the text that address the overall research question(s). In the final step, project deliverables are developed using the remaining text from the final data table, as these data will help answer the research question(s). Examples of project deliverables include scientific articles, book chapters, conference papers, or sections of project codebooks generated from the remaining rows and segments of data. For some teams, the remaining qualitative data will be used to generate themes and representative quotes that can be placed in project deliverables. In sum, the RADaR technique guides researchers on steps to organize, reduce, code, and analyze data through several iterations (Watkins, 2017). Figure 1 presents the five-step process of the RADaR technique. Original RADaR Technique from Watkins (2017).
We chose the RADaR technique for two primary reasons. From a methodological standpoint, the RADaR technique is a rapid, rigorous, and systematic method for qualitative data analysis developed by one of our study team members, offering us deep expertise on the technique. From a practical standpoint, the RADaR technique requires less time-intensive training as it follows a template-based iterative coding and analysis process and does not require qualitative software. Since it does not require qualitative software, it offsets additional training burdens and costs associated with software programs. Figure 2 displays an adaptation to the traditional five-step process of the RADaR technique to engage a community partner. Detailed guidance on the RADaR technique is available elsewhere (Watkins, 2017). Adapted RADaR Technique Steps with Incorporation of Community Partner.
Process of Applying the RADaR Technique to an Exemplar Study
We conducted a qualitative study that explored the experiences of English and Spanish-speaking community health workers and promotoras (CHW/Ps) who participated in a peer-led culturally and linguistically tailored research best practices training for CHW/Ps (Harper et al., 2024). The training equips CHW/Ps with content in research basics (e.g., fundamentals of the research process and CHW/Ps roles), participant recruitment, informed consent, privacy and confidentiality, and how to communicate effectively with communities to support health and well-being. The training was offered online or in-person and in English or Spanish across three states. A prior quantitative evaluation found that this training was effective at increasing CHW/Ps’ perceived knowledge and skills, yet no differences were identified across research sites (i.e., California, Florida, Michigan) or modality (i.e., virtual or in-person) (Murphy et al., 2024). Since no meaningful quantitative differences were found, we sought to explore the unique experiences of CHW/Ps and identify potential modifications to the training using qualitative analysis.
For the qualitative study, we used a combination of criterion and maximum variation sampling to recruit CHW/Ps based on the average training experience rating at each of the sites and demographic characteristics of CHW/Ps including gender, training language, past research experience, and training mode (i.e., virtual or in-person) (Creswell & Guetterman, 2019). We conducted semi-structured interviews lasting approximately 30 minutes each with 17 CHW/Ps (n = 10 in English; n = 7 in Spanish) to explore their experiences with the training, suggestions for improvement, and strategies for sharing the training with other CHW/Ps. Interviews were anonymized, transcribed, translated to English as needed, and checked for accuracy prior to initiating data reduction and coding. The study was approved by the University of Michigan’s Institutional Review Board (IRB). Further details about the training are provided elsewhere (Murphy et al., 2023, 2024).
Researchers have their own lenses through which they interpret qualitative data, and community members may have other interpretations based on their stories and experiences from being and working in communities (Andress et al., 2020). Therefore, it was important for us to involve at least one CHW/P partner throughout the participatory qualitative analysis process. The steps below provide detailed information on the data analysis process with a CHW/P as a community partner.
Step 1: Initial Engagement of a Community Member
Before starting the data analysis phase, we emailed CHW/P partners to identify interest in collaborating on this study as an analyst. One partner (Black female >60 years old with graduate training in social work and public health located in Florida) expressed interest and had adequate time availability to dedicate to the process. She has extensive experience working and leading community-engaged projects centered around health and wellbeing. Her two decades of experience as a CHW/P, prior work history partnering with academic researchers to analyze health policy, and involvement in community health across various local, state, and national organizations made her an invaluable partner for qualitative data analysis. Before training the community partner in qualitative data analysis, we had discussions about time commitments (e.g., approximately 4 hours/week with 1-hour weekly team meeting), expectations for what is needed to conduct the work (e.g., requiring a computer with Zoom and access to Excel), and how she would be compensated for her time. During this initial meeting, we also identified a process for her to access the data securely.
We added the community partner to the IRB to help ensure participants’ data protection. Additionally, to mitigate the potential of our community partner identifying participants, the community partner was blinded to who participated in interviews, and all data were anonymized. Data were protected using the University’s secure Dropbox software, and only members from the research team had access to the data.
Step 2: Preparing Documents for Data Analysis
Before engaging in data analysis, we ensured that all Spanish interview transcripts were translated into English. These translations were reviewed by several team members whose first language is Spanish to ensure translations were accurate and contextually appropriate. Once transcripts were verified, we prepared the documents in Microsoft Excel according to RADaR procedures, such as organizing the data into columns by participant ID and participant response (Watkins, 2017).
Step 3: Initial Data Reduction and Coding by Primary Analysts
The first and second authors (AP and AH) independently reduced the data using Microsoft Excel by highlighting text – in grey – that was irrelevant to the research questions before coming together to discuss discrepancies. Then, the primary analysts independently coded each transcript before reviewing them together to identify commonalities and resolve discrepancies. Only data relevant to the research questions were coded. This process resulted in the development of an initial codebook with codes, definitions of the codes, and examples of text segments that would be applicable to each code. Figure 3 presents an excerpt from a participant transcript with greyed out text (column B), codes provided by each primary analysts (columns C and E), our consensus code (column G), and the final refined code from our codebook (column H). Excerpt from Microsoft Excel Documenting Step 3 of Adapted RADaR Technique.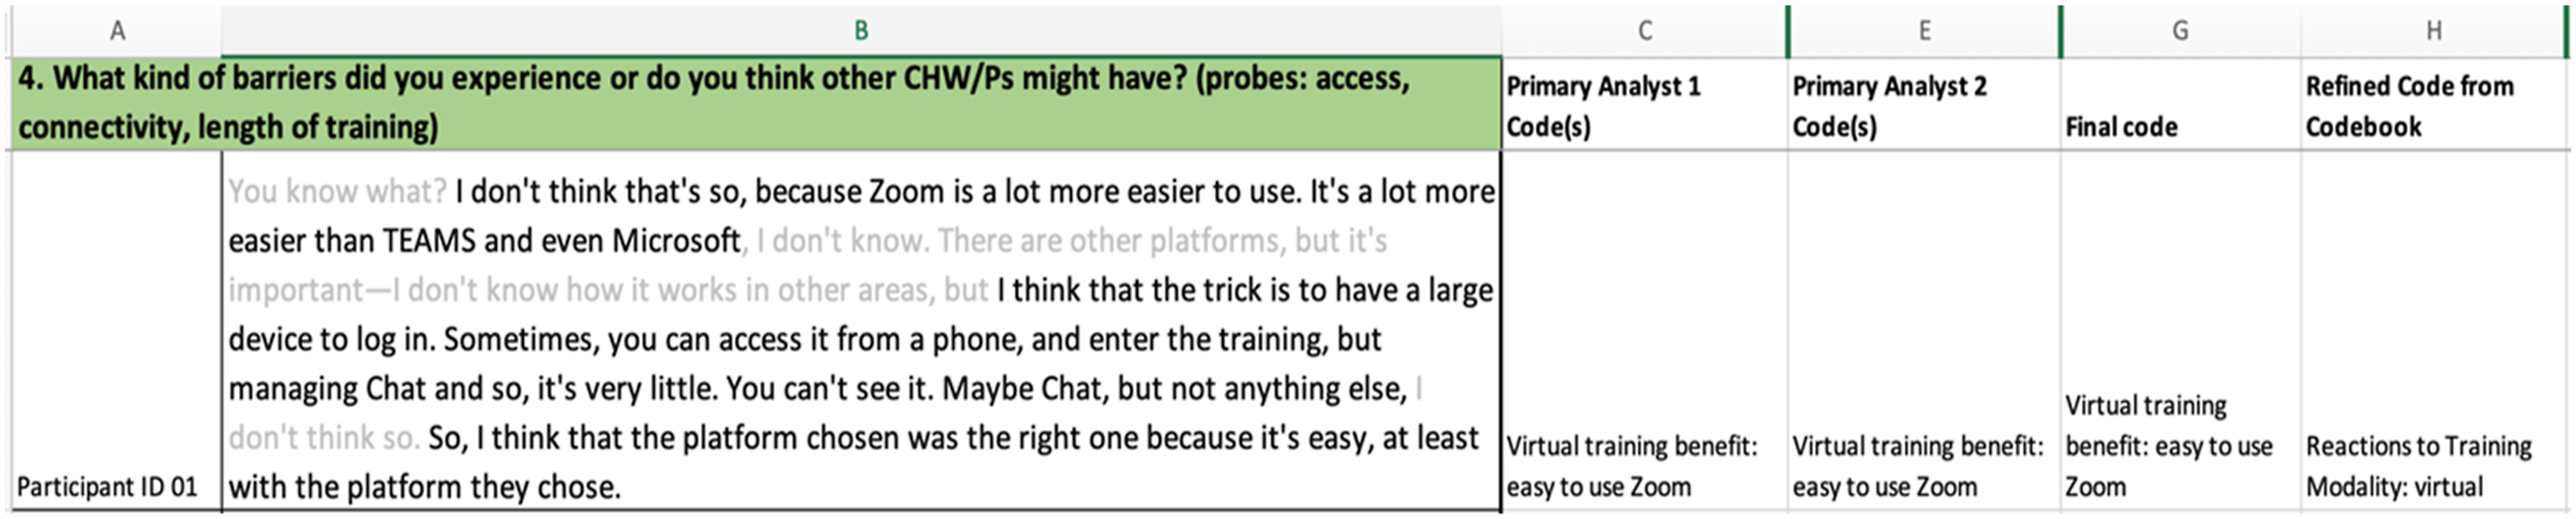
Step 4: Training a Community Member on the RADaR Technique
We held training sessions with the community partner on the RADaR process and logistics of sharing and reviewing data using a secure Dropbox folder behind the University of Michigan’s firewall. As part of the training session, we also coded a transcript synchronously as a team. During this process, all three analysts discussed how and why codes were applied to text segments. Training took approximately 6 hours across multiple sessions.
Step 5: Analyzing Qualitative Data
The parent study included a total of 17 interview transcripts with CHW/P learners lasting approximately 30 minutes (Harper et al., 2024). After the training session, the community partner independently coded nine of the 17 transcripts (53%), completing one transcript a week. After they coded each transcript, we came together as a team to discuss line-by-line codes and resolve discrepancies. The goal of this process was to achieve consensus among analysts.
To mitigate issues of power imbalance in the participatory analysis process, the community partner was asked to share her ideas and rationales for the selected code(s) for each text segment similar to all other team members. We emphasized that the CHW/P’s insider perspective was equally, if not more, important when determining final codes. In several instances, some codes initially applied by the primary analysts were modified after reviewing them with the CHW/P and hearing her insights. For example, the primary analysts coded the following text segment using one code: Reactions to Training, Content, and Materials: “I enjoy training because it has made me understand that there are some teams that I get to know much about the work I’m doing, the job I’m doing, you know, and I’ve been putting it to use. I’ve been really gonna be of great help and the positive for me.”
However, upon review with our community partner, she used that code along with the code Effects of Training: Perception of Self. She explained that from her perspective, the participant also expressed the impact of the training on their perceptions of themselves as CHW/Ps in the community. Discussions for each transcript ranged between one to two hours depending on the length of the transcript, with most requiring more than one hour. The coding process lasted from February 2024 until May 2024.
Step 6: Developing Project Deliverables
The final step included importing all coded and finalized transcripts into MAXQDA (VERBI Software, 2023) to organize and facilitate the final data analysis. Specifically, we used MAXQDA to identify categories based on similarity of codes and ultimately develop overarching themes. MAXQDA also allowed us to visually depict the codes into their corresponding categories and identify meaningful variation in participant perspectives through codes and quotes. The researchers did not expect the community partner to learn and be familiar with the software. While using qualitative data analysis software is unnecessary when using the RADaR technique, it may facilitate a deeper understanding of the data through visual representations (Watkins, 2017). After the overarching themes were identified using thematic text analysis by the two primary analysts (Kuckartz, 2014), results were shared with the community partner for feedback. The community partner confirmed the findings without suggestions for revisions.
Methodological Reflections on the Applications of the RADaR Technique in Community-Engaged Research
There were several instances when using the adapted RADaR technique converged with the originally proposed methods, while at other points we needed to make modifications when applying the technique in a community-engaged context. In the following sections, we reflect on these methodological insights and propose several recommendations to promote the participation of community members in the qualitative data analysis process.
Adaptations
We identified several necessary adaptations to the RADaR technique when engaging a community partner. The two primary analysts reduced the data and generated an initial codebook before training, coding, and reviewing transcripts with the community partner. When RADaR was initially developed, the use of this technique for the purpose of creating a codebook had not yet been tested (Watkins, 2017). However, we used the RADaR technique to generate a robust codebook that was refined through iterations with the community partner and shared with her to refine and use when coding all transcripts. We found these strategies to be beneficial for several reasons: (a) presenting only relevant data and having an initial codebook to reference facilitated the training process; (b) it allowed the community partner to implement and suggest changes to the codebook informed by her insider perspective; and (c) this process was more time efficient, enabling the CHW/P to focus primarily on the coding process.
Strengths
The RADaR technique follows a structured and systematic approach to qualitative analysis that may be particularly beneficial to novice researchers or community partners. To facilitate the qualitative analysis process with community members, the RADaR technique uses template-based tables to present the data and facilitate the data reduction process. These data tables can be developed using Microsoft Word and Excel, cloud-based apps like Google Docs and Sheets, or other software with which many non-researchers are already familiar. By using template-based documents to facilitate the data reduction process, we did not have to rely on qualitative software when working in the initial stages of data analysis with our community partner. In doing so, we were able to focus more intensely on qualitative data analysis training rather than simultaneously training the community partner on both qualitative analysis and the intricacies of qualitative software. The systematic and stepwise process of the RADaR technique provides clarity on the qualitative analysis process from the beginning of the study, which may not otherwise be apparent to community partners new to qualitative analysis. Embracing a systematic, structured template-based format and easier-to-access technology for data analysis helped to minimize technological barriers and allowed us to focus more closely on the data. We also found having an initial codebook with preliminary categories helpful when reviewing transcripts with our community partner, as it provided an anchor from which to work rather than relying on abstract concepts.
Using the RADaR technique also allowed us to incorporate the insider (i.e., CHW/P) perspective at multiple phases of the data analysis process rather than solely at study conceptualization, implementation, or the dissemination of findings. The community partner had the power to suggest edits to the codebook itself, and the iterative nature of the RADaR technique was well-suited to empower the community partner to share her insights and revisions to the codebook. Moreover, incorporating an insider in the qualitative data analysis process provides multiple methodological benefits. This strategy enhances the trustworthiness of a study and leads to more robust and credible findings, particularly in community-engaged studies (Creswell & Miller, 2000; Creswell & Poth, 2018). Involving an insider in data analysis also promotes social validity (i.e., the value of the research to the population of interest) as well as internal and external validity (Seekins & White, 2013). As such, involving a CHW/P in the qualitative data analysis process improved the trustworthiness and credibility of our findings.
Another advantage of the RADaR technique was the reduction of technological barriers by using common Word processing software, placing less emphasis on the community member learning a new qualitative data analysis software. This strategy also helped mitigate the increased time to learn new technology and the costs associated with qualitative data analysis software. We found it particularly beneficial to rely on Microsoft Excel when working with the community partner. Nonetheless, we also support researchers using qualitative data analysis software in the final stages of analysis when using the RADaR technique after prolonged involvement with the community partner to ensure a robust, valid, and reliable analysis. Indeed, we acknowledge two strengths in pairing the RADaR technique with a qualitative data analysis software such as MAXQDA. One, it enabled us to visualize the data to identify patterns, categories, and themes by activating only the codes that were relevant for each corresponding category to inform theme generation. Two, using MAXQDA increased the speed and thoroughness for extracting relevant quotes across themes for each participant. If using Microsoft Excel, we would have needed to review each data sheet independently from each other and potentially could have missed meaningful quotes. In both examples, having access to the complete dataset in an interactive environment provided by MAXQDA made for an easier and more efficient data analysis process for the researchers.
Challenges and Limitations
Although using the RADaR technique was an effective and efficient qualitative analysis approach when engaging with a community partner, we also experienced some obstacles when implementing this approach. Though the structured and systematic approach to data reduction and coding was beneficial, it is important to note that training in qualitative data analysis is a necessary part of the community-engaged research process in this context. For example, researchers using the RADaR technique or any qualitative analytical approach with community partners may need to train individuals on the overall purpose(s) of qualitative research and steps to conduct the analysis. Often, this can be a lengthy process, and researchers should consider the most effective ways of presenting this information without burdening community partners or making the process overly complicated. For example, training our community partner and going through the iterative coding process took four months. Therefore, before getting started on using the RADaR technique, it is essential to consider the community partner(s)’ level of familiarity with qualitative research, how much training will be needed before getting started on data reduction and analysis, and the impact this process will have on study deadlines and deliverables.
Researchers will also need to determine if they will use a qualitative software, Microsoft program (e.g., Word or Excel), or Google Workshop apps (e.g., Docs or Sheets) to analyze the data. Deciding on this in advance will help researchers think through how the data reduction process (steps 2 through 4 of RADaR) will occur. For example, if using qualitative software, will additional training be needed on how to use either of these programs? Will the software used to analyze the data align with the steps of the RADaR technique? One of the advantages of the RADaR technique is that it relies on cost-friendly programs like those in the Microsoft Suite and Google Workspace rather than qualitative software, which can be costly and have a steep learning curve for novice qualitative analysts. However, if using Microsoft Word, Microsoft Excel, Google Docs, or Google Sheets, analysts will be involved in copying, pasting, highlighting, and categorizing information manually and may still need guidance on this process (Watkins, 2017). Therefore, depending on the community partner’s familiarity with these approaches, additional training may be needed on how to use these programs when analyzing data using the RADaR technique.
Another common challenge in participatory analysis can be a power imbalance between researchers and community partners/participants (Jennings et al., 2018). The RADaR technique is a team-based qualitative analysis approach (Watkins, 2017). The team is usually comprised of academic researchers who are more likely to have a shared understanding of research and the qualitative analysis process. However, our team included a community partner with limited qualitative expertise, therefore, it was critical for us to address and mitigate potential power imbalances across all steps of the RADaR technique. Power imbalances can play a role when deciding which rows and segments of data to remove or not, guided by the research question(s). For example, will community partners feel they can disagree with an academic researcher when it comes to keeping or removing a row or segment of data from the data reduction table?
To address issues of power imbalance, the two analysts used a participant-driven approach from the inception of the qualitative study. The analysts built a co-partnership with the community partner and encouraged her feedback and suggestions in an open dialogue, which enhanced the data analysis process. During analysis meetings, analysts affirmed to the community partner that she was the content expert. The role of analysts was to provide guidance on the analysis process, not to supersede our CHW/P partner’s perspectives, emphasizing that we aimed to learn from everyone’s lived experiences. It is important to note the community partner did not perceive a power imbalance among our team. Instead, she reported that the analysts and herself, as a CHW/P, each have distinct and complementary skills, both “bringing together different ways of knowing” to the data analysis process.
One potential limitation is that, to our knowledge, the adapted processes of the RADaR technique we applied have not been used beyond this study. We are uncertain if this adapted technique to engage non-researchers as qualitative data analysis partners will be appropriate with other partners, such as individuals with disabilities who may require additional modifications to meet physical or cognitive needs. For example, using a different template format and identifying the best modality for analyzing the data, such as paper and pencil, virtual whiteboards, or another method may be more suitable across different populations. Care should be taken when adapting the RADaR technique, and we recommend researchers to co-create adaptions of the RADaR technique to maximize its use as a participatory analysis method.
Community Partner’s Reflections on the Data Analysis Process
To understand the impact of being involved in qualitative data analysis, we asked our community partner several questions about her experiences. Our conversation occurred via Zoom and was recorded with permission. We summarize her reflections below with direct quotes provided in italics.
The community partner acknowledged that the process of qualitative coding can be difficult. She discussed the initial challenge of understanding the codebook and learning how to apply codes to segments. She also mentioned the technological barriers encountered, such as learning to work with multiple screens and windows (e.g., to view the codebook and transcript simultaneously) and how to do data entry in Excel for coding. These barriers were related to her own level of familiarity with technology, which she overcame with practice.
Despite these challenges, the community partner felt it was a rewarding experience overall. She appreciated developing new skills in using technology and analyzing data. Although she felt “just totally incompetent” when we started, having collaborative learning discussions with analysts about their rationales for applying which codes and why helped to build confidence, particularly when codes between the community partner and analysts were discordant. As we progressed in the data analysis process, the community partner felt more confident in her skills. It made her: …feel good about voicing my opinion…it gave me more of a level of expertise of actually understanding what this actually meant in that person’s [participant] voice…and then say, ‘OK, this person [participant] is talking about something is important to them.’
Moreover, she described feeling confident in “pushing back a little bit and say ‘oh, but I don’t see it like that now’ because before I couldn’t say that because I didn’t know what I was looking at.” Engaging in the qualitative data analysis process helped her build skills and capacity in conducting community-engaged research in partnership with academia – “I’m doing science.”
Recommendations and Future Directions
Recommendations for Using the RADaR Technique in Community-Engaged Research.

Note. *Considerations with an asterisk indicate recommendations heavily endorsed by the community partner.
Conclusion
This paper advances the field of participatory analysis by adapting an existing qualitative analysis technique, the RADaR technique, to provide step-by-step guidance and actionable strategies for engaging community members in qualitative data analysis. Although community-engaged research and patient and public involvement and engagement frameworks exist that incorporate collaborative data analysis between researchers and patients or community partners, research has yet to address how existing qualitative techniques can be adapted. Following appropriate training in fundamental qualitative data analysis, the RADaR technique is a valuable tool that does not require advanced qualitative data analysis software. While engaging community members in qualitative data analysis can pose some logistical complications, the benefits of analyzing data with a community member outweigh the issues one may experience. Aside from integrating the insider perspective, this approach strengthens relationships and identifies and mobilizes skills within the communities we serve, which are critical tenets of community-engaged research (Clinical and Translational Science Awards Consortium Community Engagement Key Function Committee Task Force on the Principles of Community Engagement, 2011). Further, this strategy can help to mitigate the power imbalance that can exist between communities and researchers. Future work detailing additional steps and strategies for engaging diverse community members in qualitative data analysis would improve researchers’ ability to conduct translatable community-engaged research. It would be particularly valuable to establish processes for engaging individuals who require additional adaptations to the technique in order to be successful (e.g., cognitive and/or communication impairments).
Footnotes
Declaration of Conflicting Interests
The author(s) declared no potential conflicts of interest with respect to the research, authorship, and/or publication of this article.
Funding
The author(s) disclosed receipt of the following financial support for the research, authorship, and/or publication of this article: This project was supported by a grant from the National Center of Advancing Translational Sciences, National Institutes of Health (U01TR003409; MPIs Murphy, Aguilar-Gaxiola, Cottler) and supported by Clinical Translational Science Awards from the Michigan Institute of Clinical and Health Research (MICHR) (UL1TR002240), the University of California, Davis Clinical and Translational Science Center (UL1TR001860-06), and the University of Florida Clinical and Translational Science Institute (UL1TR001427).