
Abstract
The COVID-19 pandemic, travel restrictions, and social distancing measures have made it difficult to observe, monitor, or manage urban life. To capture the experience of being in New York City during the first year of the COVID-19 pandemic, we used a novel method of remote ethnography to interview people who were walking the city. We developed the Walkie-Talkie Map to collect and present these interviews, enabling website visitors to see what the subject saw as they walked the route of their choice. Visitors can interactively scroll through the interview and have access to additional visualizations and imagery that contextualize the main narrative. Visitors are thus able to vicariously experience what it was like to be in New York City at the outset of the COVID-19 epidemic. This work provides a case study on how to perform observational research when geographic and bodily distance has become the norm. We discuss the advantages and limitations of our method and conclude with its contributions to the study of cities and for others looking to conduct remote observational research in different fields of knowledge. The Walkie-Talkie maps can be found on this url: https://www.socialdistancing.tech.cornell.edu/what-is-a-walike-talkie
Introduction
Ethnography as a research method is inseparably connected to the study of city’s life and urbanism. The Chicago School scholars (Park, 1915; Simmel, 2012; Wirth, 1938) coined the term Urbanism as the reciprocal relationship between the physical structure of the city and the way in which people behave in it. Their approach came hand in hand with the methodology of the street corner ethnography (Whyte, 1947). The pratice of observing the way people behave in the city, analyzing and reporting it, usually in an elaborate text, was later termed by Geertz as “thick description” (Geertz, 1973). According to Geertz, the ethnographer’s report is a comprehensive description which provides detailed knowledge of how people feel, think, imagine, and perceive their world. Similar to Teti et al.’s claim in their editorial about qualitative methods in the time of COVID-19 (Teti et al., 2020), we believe that this kind of description is essential at times of significant change, such as during the COVID-19 pandemic, when most of the world’s cities experienced enormous transformations.
To capture the experience of being in New York City during the COVID-19 pandemic, we sought to apply urban ethnography. However, in the first year of the pandemic, when the changes in the street and people’s lives were most notable, being outside for field observations and engaging in conversation with people was considered to be a life-threatening activity. To overcome this challenge, we developed a novel method and system, which we call Walkie-Talkie Maps, to gather stories of people living in the city. Our system is intended to help urbanists, researchers, engineers, and designers to better respond to the situated contexts of cities, being able to see, hear and analyze the space in as-close-as-possible-to-embodied experience, without having to be physically present on site. This novel method contributes to on-going research on Pandemic Urbanism (Evans and Jones, 2011; Neuman et al., 2021; Portacolone et al., 2021; Shaer et al., 2021) and to the growing field of remote ethnography (Postill, 2016). This paper describes our unique qualitative data collection method and the technical systems we developed to conduct, analyze and present it.
Related Work
From Walking Interviews to Remote Ethnography
As noted by Teti et al. (2020), qualitative researchers face unique challenges and opportunitie during COVID-19. In a similar aim to Lobe et al. (2020), when we were unable to use our traditional face-to-face data collection methods, we were forced to develop a novel form of data collection. This challenge was shared by many researchers during COVID-19, and contributed to the formation of a new branch in qualitative methods that use advanced technology to collect and analyze qualitative methods (Kaufmann et al., 2021; Kobakhidze et al., 2021; Racionero-Plaza et al., 2021; Saltzman et al., 2021; Rahman et al., 2021; Shamsuddin et al., 2021). Our unique contribution lays in the combination of data collection, analysis and visualization.
Our remote ethnography method transpired out of the challenges posed by COVID-19 and its sharp spike in NYC, but it builds on deeper roots. For example, the Situationists, an international organization of social revolutionaries made up of avant-garde artists, intellectuals, and political theorists in the 1960s, engaged in the practice of the dérive, a method of drifting through space to explore how the city is constructed, as well as how it makes one feel (Debord, 1967). They documented and visualized their experimental walks through psychogeographical maps, which combined their observations, analysis, and social critique (Barnard, 2004; Geertz, 1973; Inwood and Martin, 2008). More recently, the walking narrative emerged as an important mode of research in geographical discourse, as a way to capture the experience of places which are changing due to urbanisation processes, globalism and climate change (Murphy, 2011; Wylie, 2005). Geographers developed the method of walk-and-talk interviews (Anderson, 2004; Evans and Jones, 2011; Hitchings and Jones, 2004; Ingold and Vergunst, 2008; Inwood and Martin, 2008) while highlighting the advantages of walking in comparison to stationary ethnography (DeLyser and Sui, 2013; Edensor, 2008; Mara et al., 2013). Walking offers an opportunity to participate in the spatiality of everyday life in the city (Pierce and Lawhon, 2015), helping researchers develop local literacy and an embodied understanding of the scales and rhythms of an urban context (Anderson, 2004; Edensor, 2010).
In addition to the embodied experience of walking to elicit place-based knowledge, our method is rooted in visual methods (Collier and Collier 1986), both in collecting the data and communicating our results. Visual methods capture rich, multidimensional data; they trigger the expression of emotions and tacit knowledge and encourage reflection (Glaw et al. 2017). In some cases, visual methods facilitate communication between the researcher and participant. By asking participants to produce the visual data, we acknowledge them as experts in their own lives (Pain 2012), hence giving them agency in the research development. Similarly to traditional Autophotography, our data-set was based on photographs taken by the participants; in this way, we were able to capture the world through the participant’s eyes (Glaw et al. 2017). In some ways, walking in the street and seeing familiar places has a similar effect to that of Photo Elicitation (Lapenta 2011), where a photograph or other visual mediums are shown during an interview to generate verbal discussion. In our case, the advantages of visual methods of evoking deep emotions, memories, and ideas (Lapenta 2011; Shaw, 2013; Smith and Woodward, 1998), were beneficial to overcome the distance created by the remote interview method. In communicating our results, the visual method’s role was to give form to abstract ideas and phenomena in urban space. We built the visual language of the maps using Super-positioning as a research method as put forward by Yavo-Ayalon (Yavo-Ayalon 2019; Yavo-Ayalon et al. 2019; Yavo-Ayalon et al.2020). Super-positioning is the overlaying of information from different fields of knowledge and disciplines on an urban map. In this case, we overlaid the route, narration, and video with additional data sets of the location socio-economic matrix and the pandemic rates. We also overlaid the content analysis of recurring themes to highlight the contact points between interviews. This visual method juxtapose physical phenomena with social ones from a spatial perspective and helped summarize and contextualize our findings.
While notable work in remote ethnography has occurred in the social sciences (Postill, 2016), much of the prior work is premised on digital technologies such as video conferencing or mobile phones, and hence has developed amidst the field of human-computer interaction (Kushniruk and Borycki, 2015; Pink et al., 2016). Early systems focused on extending the experience sampling method (Csikszentmihalyi et al., 1977) as a technique to evaluate and improve ubiquitous computing applications (Consolvo and Walker, 2003). Froehlich’s MyExperience, for example, enables designers to survey users after specific interactions with their device (Froehlich et al., 2007). One example had users rate the call quality after a mobile phone call on the phone itself. Carter et al.’s Momento (Carter et al., 2007) was developed to help designers better understand the in-world context in which people were using mobile computing applications. Designers receive notifications around specific trigger events notifying of a participant’s mobile application use, in real-time. They can subsequently interact with the user over multimedia messaging by sending questions and requesting photos or videos of the user’s environment.
Although these methods help extend our understanding of users’ daily routines and contexts, Crabtree et al. (2009) point out that many aspects of interaction in ubiquitous environments are invisible and fragmented. They champion the combined use of video and system data in remote ethnography to enable sensemaking of increasingly computational user experiences, arguing that “there is a strong need to enhance observation in these environments, making the invisible visible and reconciling the fragments to permit coherent description” (Crabtree et al., 2009). The WozWay and FarmWoZ systems were built to perform remote ethnography in automotive environments, providing high quality video, multiple camera angles in and out of the cabin, and map data to remote interactants to help them localize what they are seeing when they interact with drivers (Martelaro and Ju, 2017; Ju et al., 2021). Our Walkie-Talkie method uses current day mobile phone technology and infrastructure, video conferencing technology, and web-based data visualization to build on this prior work to collect walk-and-talk interviews in a way that enables others to sample the narratives and draw their own feelings and conclusions about the more general experience of this historical urban moment.
Method
To understand how the social distancing restrictions changed the streets and the way people behaved in NYC during the first year of COVID-19, our research method was structured so that it could be conducted in-situ but from a distance. Our protocol makes use of modern-day video conferencing software and mobile phone technology to conduct the interviews, with participants speaking with a remote researcher as they walk around their neighborhood. We used timestamped GPS logs from participants’ mobile phones to help synchronize collected audio and video with participants’ walking waypoints. After the walk, these interviews were analyzed for their thematic content by the research team (The context and discussion of that analysis will be presented in future publications). Subsequently, we developed and refined an online interface to showcase the interview content and the thematic markers on a geospatial map, providing an interactive, rich visualization of the interview data and observations from multiple participants. Site visitors can use this interface to move from one story to another to make their own observations of the data. The objectives for our novel method were to: (1) Develop a system that enables us to perform remote field studies of people observing changes in the street and in the urban lifestyle during the pandemic. We aimed to design a system that is inexpensive, remotely operable, remotely deployable, and easy to use, so as to maximize adoption by other researchers. (2) Perform field studies to tell the story of the city under the mandated social distancing restrictions. In Geertz’s (1973) terms, we aimed to provide a thick description of physical changes in the appearance of the street and more intangible changes in the urban lifestyle, a frame of interpretation to the Pandemic Urbanism.
Here we focus on the first aim and elaborate the method in greater detail to enable its adoption by other researchers. For clarity, we divide the description of the method into four stages (as illustrated in Figure 1): The four stages of the walkie-talkie map method.
1. Data collection through walk and talk interviews; 2. GPS tracking of the route to contextualize the walk in a specific location in the city; 3. Content analysis of the video images, audio, and narration in relation to their location; 4. Visualization in a geo-spatial web-based interactive map that tells each Walkie-Talkie story individually and combines all the stories into a Supermap that enables to move between the stories.
1. Data collection: Zoom Walk and Talk Interviews (Walkie-Talkie)
For our data collection, we recruited 25 participants to perform Walkie-Talkie Interviews. The interviews were conducted in the fall of 2020 and the winter and spring of 2021. As exemplified in Figure 2, our walking interviews were conducted via Zoom, as interviewees were walking in a very familiar area (the neighborhood in which they live or work). In a ten-minute pre-interview briefing, the interviewees were instructed on how to mount their mobile phone cameras so that they faced forward, and the video feed that was live streamed from their phone, and the real-time narration they provided enabled the remote interviewer (and subsequent audiences) to observe the interviewees’ perspectives of their immediate environment. The walkie-talkie interview settings.
Interviewees were asked to walk through a part of the city with which they were familiar and were prompted, through a semi-structured interview, to reflect on aspects of the environment that have changed due to the pandemic. The interviewer helped focus the interviewees’ narration on the specific places in which they were walking. The interviewees were also asked to talk about things they miss and to recall a specific event that highlighted the change for them. This method allows interviewees to represent the world as they see it, while providing additional data visualizations and imagery.
2. GPS Tracking App
To provide the contextual spatial background, the interviewees were also instructed to download a GPS tracking app in advance. Out of several available free apps, we used “Open GPX Tracker,” which proved accurate and easy to use. The version we used can be found on this URL: https://apps.apple.com/us/app/open-gpx-tracker/id984503772. In the pre-interview briefing, the interviewees practiced the operation of the app. When the interviewer started the Zoom recording, the interviewees pressed the Start button on the app. With the interviewee’s permission, the GPS tracking was working in the background, capturing the route over the course of the interview. At the end of the walk, interviewees were instructed to save the GPS data file and send it to us via email.
The GPS data file was formatted and filtered for use with Mapbox’s API. As site visitors scroll through the interview timestamps in our visualization, the route of the interviewee displayed is updated on the map to reflect the route traveled so far in the interview.
The Walkie-Talkie interview protocol provided us with three layers of information: (1) the video – what we see in the street; (2) the audio and the transcript – what the interviewer and interviewee talked about during the interview; and (3) the route – what we know about the area and the specific location. The three layers of information corresponded to one another, although sometimes the discussion between the interviewer and interviewee had to do with previous time points, off-screen locations, or other topics which did not relate directly to anything that was in the interviewees geographical vicinity or that could be viewed in the video stream. Our research team consisted of five individuals with varied backgrounds, including architecture and urban planning, urban sociology, computer science, and human robot interaction. The team analyzed these layers to acquire as much information as possible. The video provided information about the features and physicality of the street, the size of the sidewalk, and the comfort of walking. Observing the videos, we counted other people on the street and observe what they were doing. The video also provided data about the time of day, the weather, traffic, sidewalk and street cleanliness, and so forth, providing us with rich information.
Combining the video with the audio and narrative also furnished information about the physical changes in the area in question, including things that were not there prior to the pandemic or things that are now missing. The audio and the transcript reflected how people were feeling about the changes in their lives and in the urban environment.
3. Visualization
Since our research originated in urban, public spaces and involved people living and using those spaces, we wanted to communicate our results to this kind of audience. Assuming that videos and maps are more engaging to the broader public than written academic articles, visualisation was an integral part of our research, aiming to share our findings and disseminate the knowledge we created to broader populations. Additionally, since our data set was mainly visual, it called for a visual method of reporting. To achieve these two goals, we built a website that includes the analysed data set in the form of Individual Walkie-Talkie Maps combined into one Supermap, as elaborated in the coming sections. This article serves as a ”roadmap” to the website inviting the research community to explore it. In addition, the website is accessible to all through the University platforms; the people who participated in the research, New Yorkers and city dwellers throughout the world who had similar experiences during COVID-19. Additional, practitioners, urban designers and decision-makers can benefit from this interactive visual tool to get practical results from the research. The website enables viewers to choose how much or how little they want to dive into the project.
4. Data Analysis: Thematic Content Analysis
Individual walkie-talkie maps
To visualize the findings of our interviews, we used the Mapbox GL Javascript library running in a browser. It was based on a variation of their Interactive Storytelling template – designed to create web-based digital multimedia “stories” that unfold as a website visitor scrolls through the webpage (with a map trace function that helps indicate changes in the location of each story as each narrative unfolds) – to create an interactive map-based rendering for each interview. In the first stage of our research, we selected 10 high-quality interviews out of the 25 conducted for rendering.
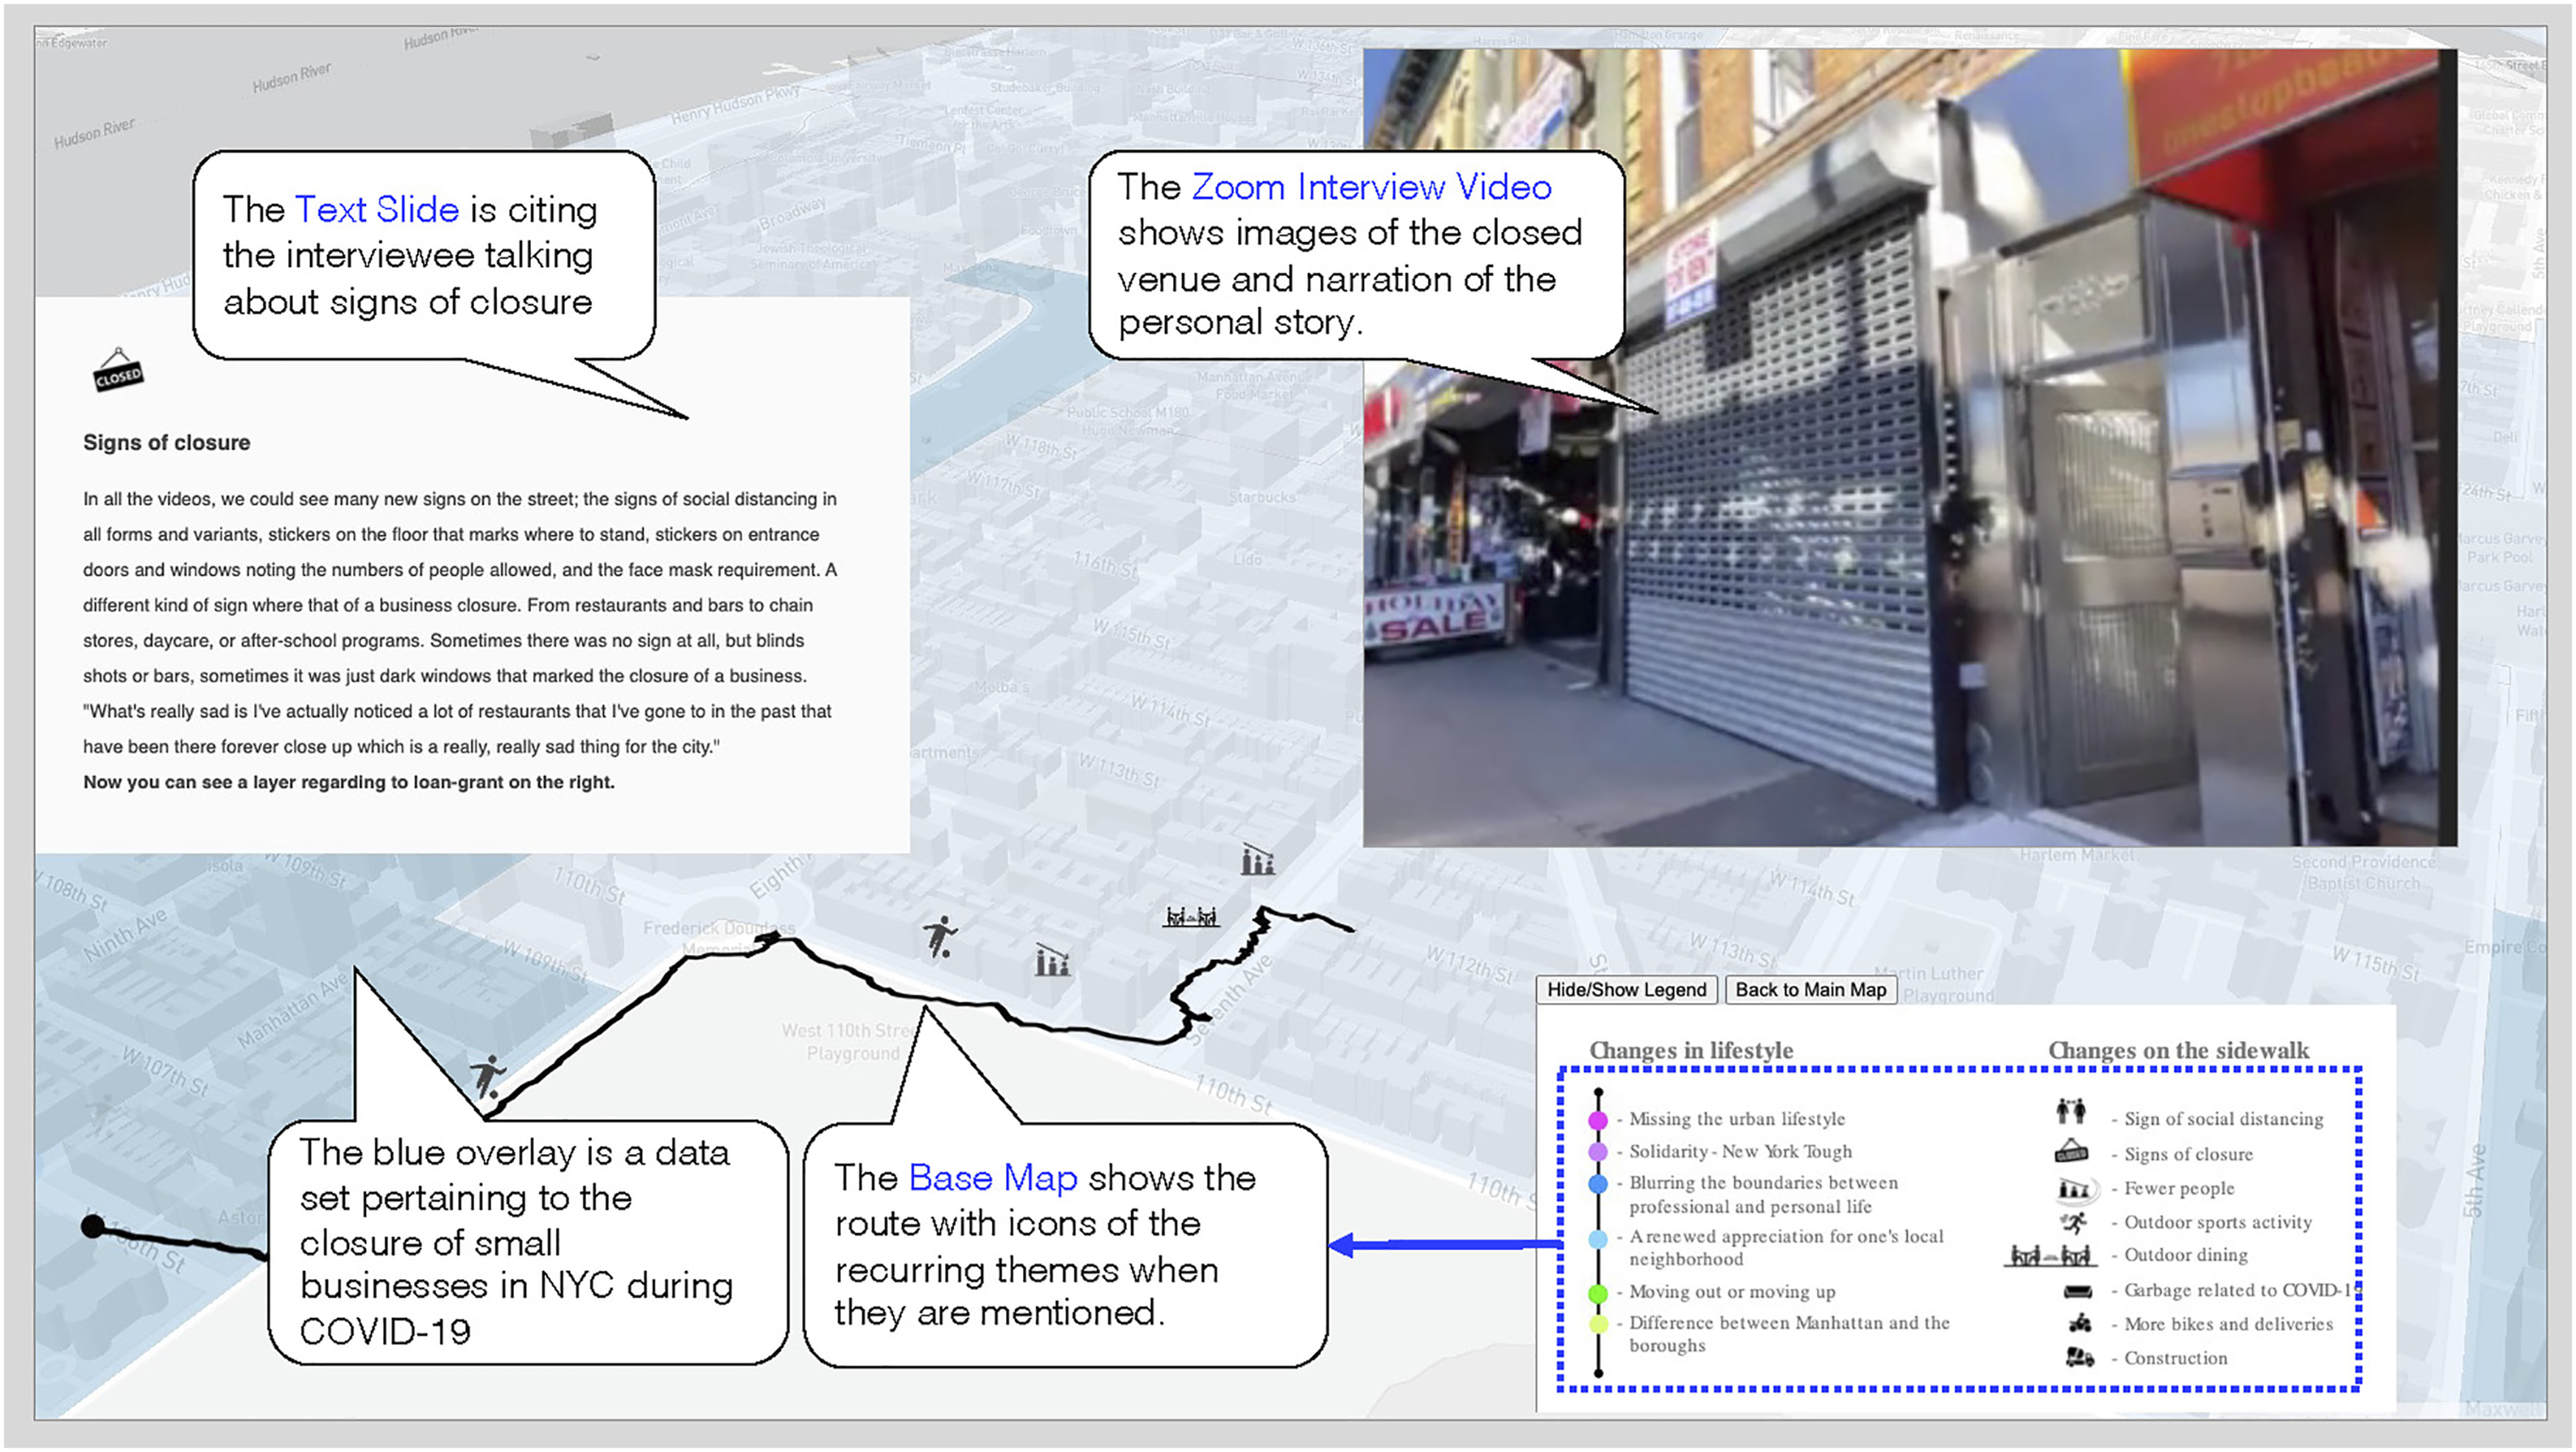
As shown in Figure 3 and Figure 4 each Walkie-Talkie Map has a similar interface that includes: 1. a text slide, 2. the base map, 3. the zoom video, 4. a legend button and 5. a link to the main Supermap. When the website visitor scrolls down, the interview’s video and narrations start playing, and accordingly, the route is drawn on the map. All the Walkie-Talkie maps are similarly structured; At the beginning of each interview, the participants introduce themselves and the area they would be walking. In the map, we translated this part into an expository introduction slide: therefore, each map begins with background information on the neighbourhood the person is traversing and how the neighbourhood was affected by the COVID-19 pandemic (from the NYC Open Data website https://opendata.cityofnewyork.us). Following the introductory slide, the map zooms in (and sometimes with a little side view of the walking location, and the close-up 3D building models) to focus on corresponding interview footage and customized to our analysis. These narratives bring the website visitors immersively into the moment, and give them insight into the experiences of specific individuals in specific locations at a specific time.
The data from our 10 maps are statically hosted on a cloud-based server instance. The walkie-talkie map interactive interface. The walkie-talkie map interactive interface.
The supermap
The individual Walkie-Talkie Maps are combined into one Supermap that includes an image with the complete route for each interview. Figure 5 shows the Supermap design, which is inspired by the original Situationist International Psychogeographic guide of the Paris map. This resemblance aims to highlight that the Supermap is not a realistic map of New York City but rather an impression and interpretation of the city. It is a visuall thick description that combines multiple perspectives in multiple locations. Currently, this Supermap includes links to each of the Walkie-Talkie Maps and can be found on this url https://www.socialdistancing.tech.cornell.edu/supermap. In a more advanced stage, or as a recommendation to future researchers, we would like to add more interactivity into the Supermap to make it an analytical tool that enables compression and connections between the individual stories. To improve the Supermap, we plan to add the same color-coded markers and icons as in the individual Walkie-Talkie Maps so that site visitors can locate areas where recurring themes arise. This feature will facilitate non-linear browsing; instead of viewing individual Walkie-Talkie in sequence, a viewer can toggle between similar markers to compare vignettes from different narratives. Alternatively, they can choose to view various interviewees’ stories about similar locations. Adding these features to the Supermap will transform it into an analytical tool that observes all stories simultaneously, with their diversity and distribution throughout the city. We would like this future map to offer a visual summation of the recurring themes, enabling analysis and understanding of commonalities and differences across the individual narratives. The supermap (left) inspired by the situationist international psychogeographic guide of Paris (right).
Discussion
Traditional ethnography is based on being in the street with the people being observes, sharing their experiences while suggesting a frame of interpretation to reason their actions. However, during the pandemic, our ability to collect qualitative data in traditional methods was limited, leading to the novel way of conducting remote ethnography described in this article. Among other qualitative methods that were developed as a result of the pandemic (Racionero-Plaza et al., 2021; Saltzman et al., 2021; Rahman et al., 2021; Kobakhidze et al., 2021; Kaufmann et al., 2021; Shamsuddin et al., 2021), our contribution is the combination of data collection method, its analysis and its visualization in a web-based platform that tells the city’s story under mandated social distancing restrictions, as a new form of “visual thick description.” In this discussion, we compare the limitations of our methods to that of other qualitative methods that use advanced technology on top or along side with qualitative methods.
We wanted to collect stories from all of the city’s five boroughs, but the system as designed depends on having good cellular connectivity throughout the course of the Walkie-Talkie interview. Like Lobe et al. (2020) discovered, issues with bandwidth, lighting, and the quality of the participant’s video camera impeded our ability to perform this type of interview successfully with all of the recruited participants. Some of our interviewees suffered from lost GPS data and others from low-quality video, which are a function of the participant’s own cellular phones and the infrastructural issues with cellular access in their neighborhood.
Some of the limitations we faced are similar to those encountered by Shansuddin et al. (Shamsuddin et al., 2021) who struggled with getting consent to record online focus groups. In our case, the consent to record and track the route was the essence of our method. We recruited participants remotely; before taking the Walkie-Talkie interview, they filled out a short demographic survey and signed a consent form with the option to allow or refuse us to use their photos. It therefore limited the number of interviewees to only those who were willing to publicly share their story. We were unable to recruit people from communities which were most severely impacted by the pandemic, such as low-income populations in overcrowded apartments or essential workers who continued working. This difficulty of recruiting key populations was an experience also shared by Kaufmann & Tzanetakis (2020) and Kobakhidze et al. (2021). As a result, our current Supermap features only a narrow sampling of participants largely from upper-middle-class and highly educated backgrounds and from only some of the city’s five boroughs, which paints a specific image of the city from the participants’ perspectives.
To compensate, we integrated layers of city-scale data into each Walkie-Talkie Map, with links to specific statistics and information about how the area in question was affected by COVID-19 and to media articles pertaining to particular remarks made by the interviewees. Those additional layers are elaborated in Figure 6. For example, in the case of an interviewee who pointed out that she could not take her children to the playground, we added a data set of all the closed playgrounds in the city. When another interviewee noted how bad a specific neighborhood of immigrants had been hit, we added a link to an article that elaborates on the neighborhood’s story during the pandemic. Overlaying the individual route of the interviewee and the multiple datasets grounded each story in its specific locale. The addition of these extra layers of data to each interview enriched our visual thick description, compensated for the small sample of participants, and generated an integration of the individual points of view with that of the city. Additional data layers at the city scale.
As next steps for this platform, we would like to find further applications for the underlying infrastructure that we built. While we are working on analyzing and enabling the experience of replaying the stories of the pandemic experience, the opportunity to add additional stories is past. In some ways, the motivation of capturing the experience of a specific movement in time in the city also limited our ability to build upon the system now. However, we believe this system can be applied to future city-scale events for monitoring extreme situations or mundane everyday activities. For example, researchers can use this method to document and raise attention to severe weather conditions such as floods or snowstorms or get insights into political protests, being able to be in many places simultaneously, to assess the distribution of these events across a city. Alternatively, research focusing on the small interactions of everyday life can also use this method for studying cultural or sports events. In addition, the walk-and-talk format might be useful for understanding the pedestrian commutes of urban dwellers to help planners and municipal workers understand how people are experiencing their streets and neighbourhoods. Because of its flexibility and reliance on simple, available technology such as mobile phones, this method will translate well to these less exceptional areas of public life. We can also imagine the application of this method in international settings. Since, theoretically, the physical distance can be unlimited, researchers can conduct ethnographic fieldwork in as remote locations as they choose as long as this place has Wi-Fi. For example, utilizing it to document extreme situations such as the current warfare in Ukraine (2022). However, despite its many advantages, we do not believe remote ethnography is a completely substitutes for the immersive experience that in-person fieldwork creates. With remote ethnography, the interpretation of culture or events is mediated through a different person’s perspective and point of view. Furthermore, it does not involve all human senses, such as smell or touch; it can be cut at any point, leaving the interviewer remotely with no context or ability to understand the situation. When applying this method to different scenarios or locals, researchers should carefully pick the questions they ask and the frames of interpretations they weave on top of the data collection method. Like any qualitative or ethnographic research, it should engage with sense and sensitivity to the specific cultural and social environment.
As a first step towards applying this method by other researchers and for other scenarios, we recommend using the technical tutorial on creating a Scrollytelling map method, which is available in the following url https://github.com/mapbox/storytelling. Similarly, we created a GitHub repository that explains how to make our version of the Walkie-Talkie. It is available on this url https://github.com/FAR-Lab/sidewalk-ballet-walkie-talkie .
Conclusion
As a visual conclusion, we added at the end of each Walkie-Talkie Map a summary slide, shown in Figure 7, of the route and the recurring themes that the interviewees mentioned during their walk. The Walkie-Talkie interviews and their accompanying interactive geospatial maps help future site visitors to get a glimpse of what it was like to be in New York City during the COVID-19 pandemic. In this way, this work contributes to the growing field of knowledge that seeks to understand and characterize Pandemic Urbanism (Abusaada and Elshater, 2020; Neuman et al., 2021; Portacolone et al., 2021; Shaer et al., 2021). The contributions of this research are therefore multilayered: based on the data collected, it creates a snapshot of an unprecedented period in the history of NYC; through its method of capturing data, it suggests a new way of engaging in remote ethnography; through its analysis of three layers of information (images from the video, personal stories from the text and audio, and routes from GPS), it identifies recurring themes that resonate in all the stories; and through visualization of the stories and the recurring themes on an interactive map, it helps communicate and disseminate this research knowledge to wider audiences. The final slide of each walkie-talkie map is a summary of the talk and the route.
Footnotes
Acknowledgements
Many thanks to the wonderful people who took the walk-and-talk interviews and shared their stories with us.
Declaration of Conflicting Interests
The author(s) declared no potential conflicts of interest with respect to the research, authorship, and/or publication of this article.
Funding
The author(s) disclosed receipt of the following financial support for the research, authorship, and/or publication of this article: This material is based upon work supported by the American National Science Foundation under Award # 2028009, RAPID: Tracking Urban Mobility and Occupancy under Social Distancing Policy
Ethical Approval
We confirm that the manuscript has been submitted solely to this journal and is not published, in press, or submitted elsewhere. We confirm that we have checked the manuscript submission guidelines and complied with any specific policy requirements specified. We confirm that you have prepared (a) a complete text minus the title page, acknowledgements, and any running headers of author names, to allow blinded review and (b) a separate title page with author information