
Abstract
The training of artificial intelligence requires integrating real-world context and mathematical computations. To achieve efficacious smart health artificial intelligence, contextual clinical knowledge serving as ground truth is required. Qualitative methods are well-suited to lend consistent and valid ground truth. In this methods article, we illustrate the use of qualitative descriptive methods for providing ground truth when training an intelligent agent to detect Restless Leg Syndrome. We show how one interdisciplinary, inter-methodological research team used both sensor-based data and the participant’s description of their experience with an episode of Restless Leg Syndrome for training the intelligent agent. We make the case for clinicians with qualitative research expertise to be included at the design table to ensure optimal efficacy of smart health artificial intelligence and a positive end-user experience.
Keywords
Authors’ note. Describing how we employed qualitative methods to assist with developing
Key Word Definitions.
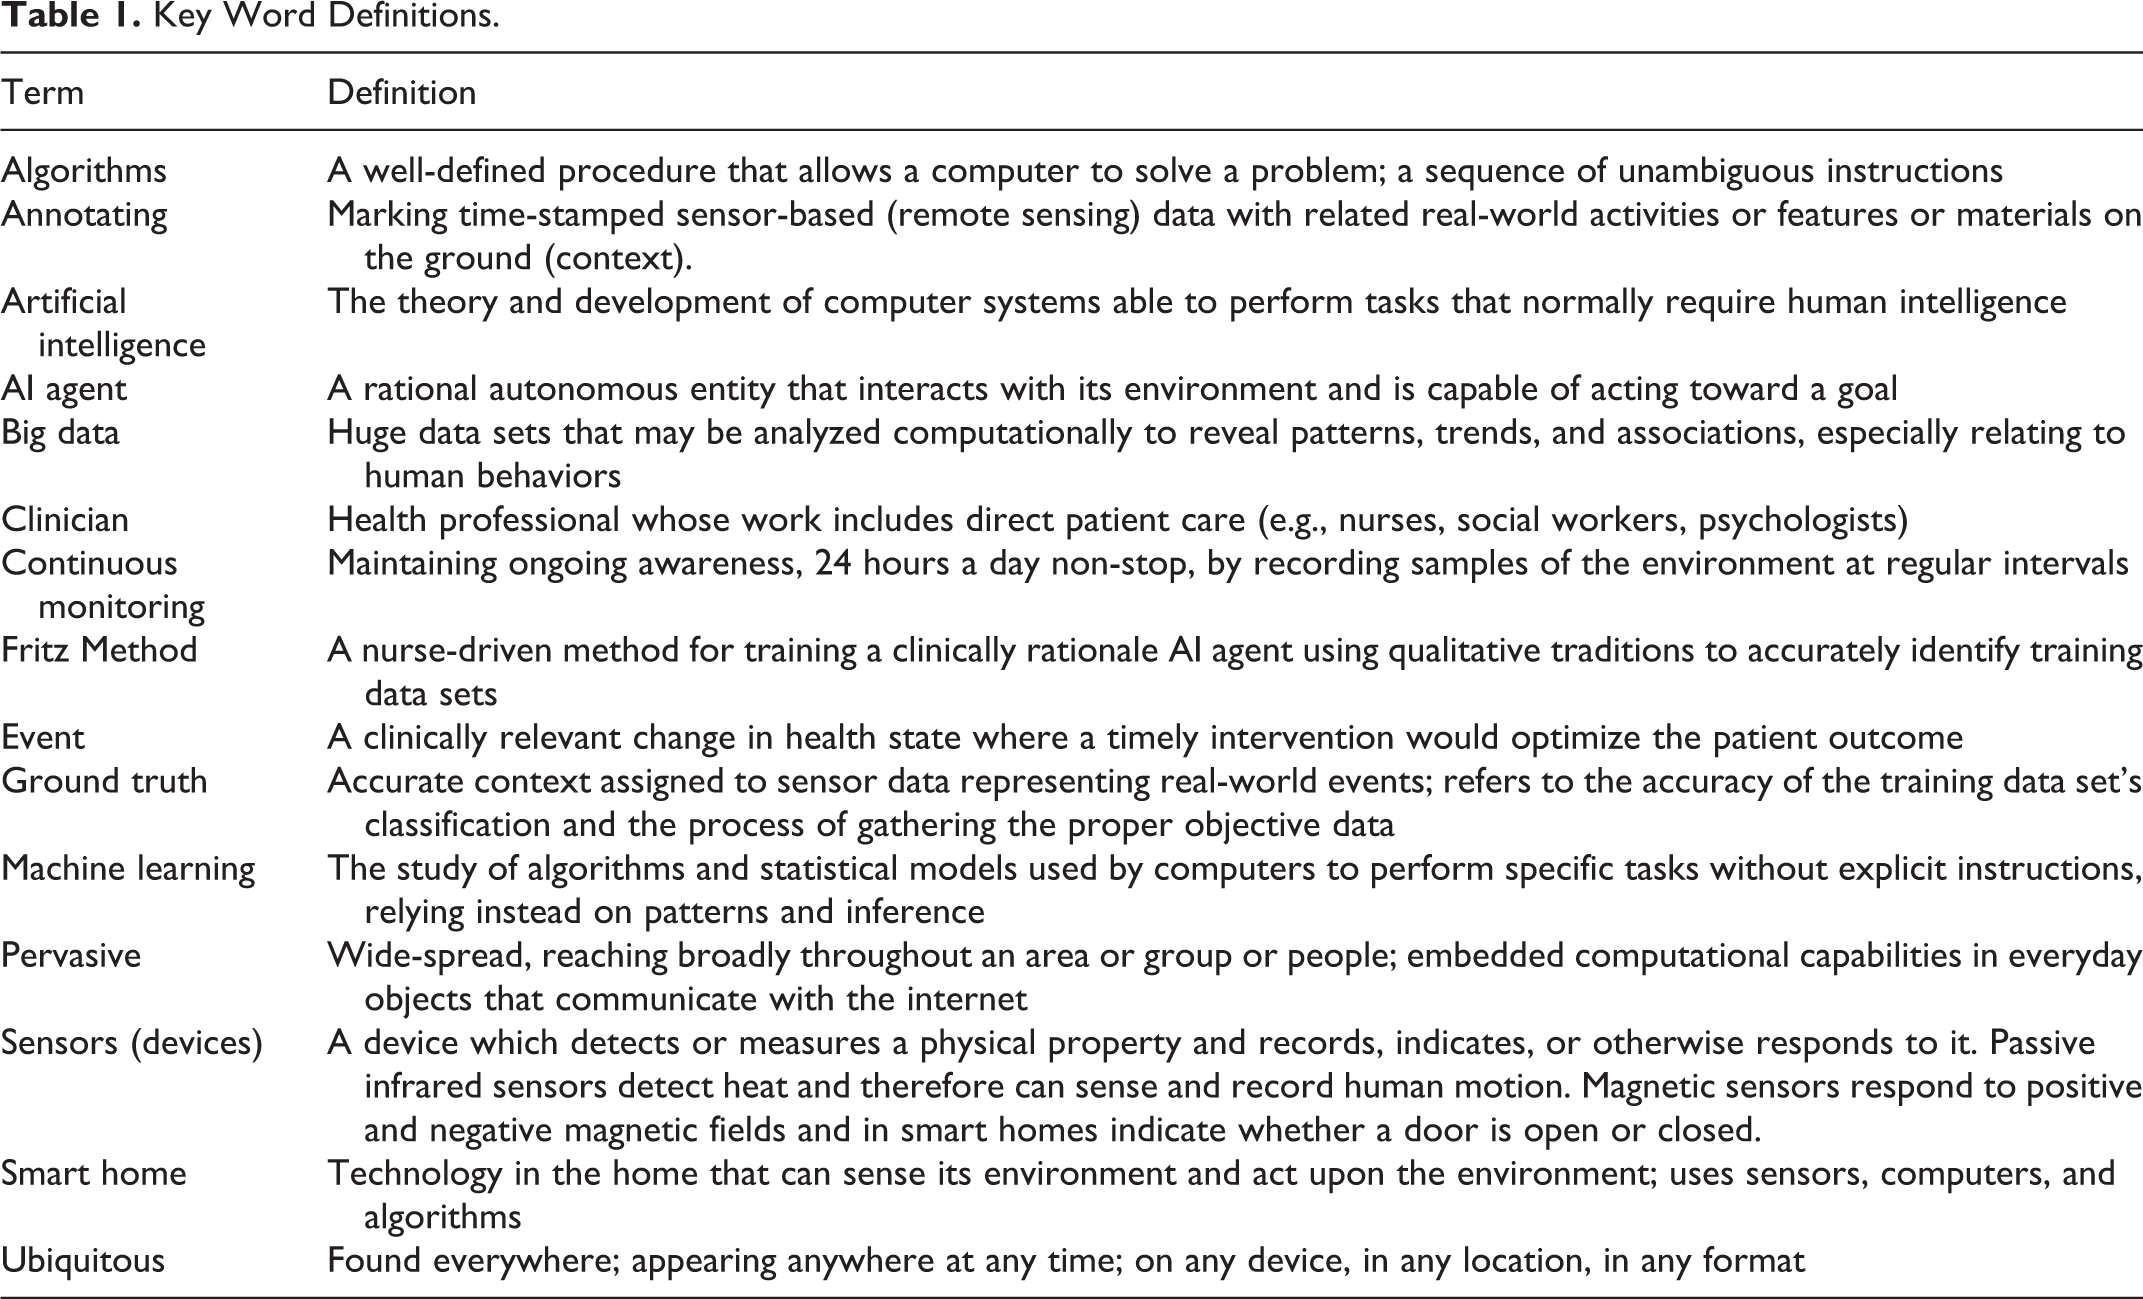
Technological innovations designed to address the complexity of social and health problems abound. Although these health-assistive technologies are often developed by scientists and inventors primarily trained in computational disciplines that value Cartesian thinking (Hatfield, 2006), the connection between science, engineering, technology, and society is primarily qualitative in nature (Idhe, 1990). Health technologies are designed to assist with solving real-world health problems that humans experience. As such, the development of these technologies requires situational, naturalistic knowledge along with the strongest possible phenomenological explanation to ensure the technology can meet the human’s health needs. Qualitative data and analytic traditions are well-positioned to provide such explanations because inductive thought is a distinguishing feature of qualitative methods and a precursor to deductive reasoning, a primary characteristic of quantitative methods (Aspers & Corte, 2019; Callaos, 2019). Social and health scientists can use their clinical experiences and inductive thought to provide technology development teams with critical health knowledge targeted at improving efficacy and population-specific applicability.
Since the dawn of the computer age, technologies have become increasingly intelligent, precise, and intentional. Today, health technology is
The purpose of this methods article is to illustrate how qualitative approaches and inductive thought can inform efficacious development of smart technologies and bridge quantifiable
To situate this methods work, we provide a brief description of the smart home followed by a discussion of quantitative and qualitative data types in the context of
Smart Homes
Smart homes that monitor health to support the growing aging population are emerging as a potentially viable solution for facilitating aging-in-place (Fritz et al., 2016; M. J. Rantz et al., 2015; Reeder et al., 2013; Schmitter-Edgecombe et al., 2013). Smart homes use a variety of sensors along with computer
Sensors and Sensor-Data
Prototype smart homes include sensors that are deployed into an existing home. The floorplan of the home and the resident’s use of the space within the home determine the location, quantity, and type of sensors that are deployed (Fritz & Dermody, 2018). For example, a favorite dining room chair will have a sensor near it (Figure 1, Left). Sensors are designed to blend with walls and ceilings to limit drawing attention to the them (Figure 1, Right). They are quiet and usually do not contain microphones or cameras. Sensors detect motion associated with activities of daily living, and send date and time-stamped text messages as motion is detected. A single line of text data appears as “2020-02-08 00:24:24.700575 BedroomAArea ON.” This text message means that motion was detected in the bedroom on February 8, 2020 at 24 minutes and 24 seconds after midnight. Sensor timestamps allow tracking of a resident’s sequential movement throughout the home. Every day, as the resident moves about their home accomplishing their daily activities, sensors transmit approximately 3,000 text messages, or “lines of data.” This results in data sets too large for a human to analyze in a reasonable amount of time; accordingly, algorithms are used to rapidly identify residents’ activity patterns so relevant anomalies can be detected (Ghods et al., 2018).

Floor plan with sensor locations identified in blue, red, and green (Left). Sensors installed in a residence; the Center for Advanced Studies in Adaptive Systems (CASAS) smart home testbed; Washington State University campus, Pullman, WA, USA (Right).
Sensor Data to Knowledge Continuum
Knowledge impacts the development of a system (Motta et al., 1989). Effective systems rely on human abilities for gleaning, processing, and filtering information so the system can be trained to emulate the decision-making of a human expert, and act intentionally (Jackson, 1998; Russell & Norvig, 2003). The smart home’s effectiveness relies on dual knowledge from both computer scientists and clinical experts. Both disciplines’ knowledge domains are needed to make sense of a health
To frame our interdisciplinary communication and improve the cogent transfer of information, we draw on qualitative traditions when identifying and reporting on health events. Specifically, we use qualitative descriptive methods. This is our preferred methodology because it is flexible (Kahlke, 2014; Sandelowski, 2010) and low levels of interpretation (Sandelowski, 2000) are helpful for smart health monitoring and computer algorithm development. We also use a participatory approach with underpinnings taken from Person-Centered Care (PCC), a middle-range theory designed to provide a person-centered approach that focuses on individual needs and care approaches (McCormack et al., 2015; Powers, 2013).
Developing knowledge about a smart home resident with fluctuating health is highly individualistic. The emphasis for knowledge development is placed on obtaining data of changes in health experienced by smart home residents. This includes capturing residents’ experience before, during, and after a health event. Two different paths to discovering an event, or a resident’s change in health, exist: 1) the smart home resident reports that they have experienced a change in health; and/or 2) clinicians discover that the motion sensor data show a significant deviation from the individual’s baseline. Health experiences are captured through weekly nursing interviews using semi-structured questions that regard health or status changes in the preceding 7 days. We record responses as text-based field notes documenting when, where and how an event played out (e.g., a fall occurring in the kitchen just before bedtime). We also record any reported changes in health status (e.g., higher blood pressure), and associated changes to the treatment plan (e.g., medication dosage changes). Our written field notes are basic descriptions that are not highly interpretive and include brief phrases of participants’ own words. When an event has occurred (e.g., a fall, an episode of RLS), in addition to describing the activities the resident was engaging in around the time of the event, we observe the naturalistic setting in which the health event occurred (i.e., the home). Naturalistic observations add to our understanding of how the event unfolded. Field notes are later used to validate annotations of health events in the sensor data. These validated annotations and chosen data segments are required to effectively train an AI agent to recognize changes in health states occurring during continuous monitoring. Without these contextualized qualitative data, algorithms cannot become knowledgeable enough to be capable of recognizing clinically relevant anomalies. For the AI agent to act upon changes (i.e. sending an alert), clinical ground truth (information) is critical.
Smart Home Mixed Data Characteristics
Each variety of data provide unique perspectives and guide understandings regarding individuals’ health experiences. Qualitative data play a unique role in guiding understandings of sensor-based data. To explicate the role of contextualized qualitative data, one must first understand the characteristics of sensor-based data.
Quantitative smart home data
In developing a smart home AI agent, quantitative data are subject to computational analysis and are, in their original form, a string of alphanumeric characters (e.g., a single line of data looks like “2019-02-08 00:24:24.700575 BedroomAArea ON”; for multiple lines of data see Figure 2). The four historical quantitative data types—nominal, ordinal, interval, and ratio (Portney & Watkins, 2009), are only part of the whole picture when considering data that are used by computer algorithms. Computer-based big data taking the form of alphanumeric strings are collected using a variety of technologies including environmental sensors, smart phones and watches. This type of data can be collected in massive amounts.
Qualitative smart home data
We use written text-based semi-structured contextualized health data, including: physiological status (diagnosis, medications, body systems), psychological status (mood, attitude), socialization (out of home activities, visitors), function (independent or levels of assistance), and routine aspects of living (daily activity patterns). The physical environment (geographic and situated home location, home floorplan, sensor locations) are image-based. Data from the semi-structured clinical interview and clinician assessment of the body and psychosocial systems represent smart home residents’ experiences with their daily routines, and health and independence. We seek to understand how those experiences impact daily activities that can be captured by motion sensors.
Having semi-structured health data (from interviews and assessments) associated with sensor data is valuable because it allows the possibility of locating segments of sensor data that represent health events. For example, a smart home resident can describe how they lost their balance and fell in their living room. The description of the experience of the fall can facilitate the location of the segment of sensor data that captured the fall. Events leading up to the fall can also be identified in the sensor data. Qualitative data provide information that are critical to embedding in the AI agent an individual’s response to a change in their health, so the agent will recognize a similar change in the future. The process of collecting and contextualizing qualitative data is time and resource intensive. It is also challenging to consistently and accurately associate “qualitative” data of smart home residents’ health experiences with “quantitative” sensor data. To enhance trustworthiness of the data and improve process reliability, we developed a neoteric inter-methodological method.
Fritz Method
The Fritz Method was developed in response to a need for clinicians to provide consistent interpretation of health-related sensor data to a computer science team. The Fritz Method is used for collecting, analyzing, and contextualizing sensor data. This method assists clinical researchers with generating ground truth for labeling segments of sensor data with clinically relevant information (e.g., movements representing a human response to illness), a necessary component of training an AI agent. The method facilitates a clinician-based, expert-guided approach to
Analytic Reflections
In this section, the primary author and creator of the Fritz Method describes in first person her process for applying qualitative descriptive methods when analyzing and contextualizing historic smart home sensor data. Reflections illustrate the qualitative stance taken during analysis. Data are from a resident living in a prototype smart home who experienced an episode of Restless Leg Syndrome (RLS). The analytic process begins with the qualitative practice of presence.
In a quiet, private place of solitude I clear my mind of the clutter of the day and turn my thoughts toward Anne (fictitious name) whose daily activity patterns are represented in the data. She is a warm and friendly person, and a widow. Anne lives in a 600 square foot single bedroom, single bath, open floorplan apartment (Figure 1, Left). In my mind I acknowledge her interest in participating in the study and her desire to fulfill, what appears to be, a personal need to continue giving back to society. I recall her saying, “I feel like I am still doing something important….” I reflexively ponder multiple aspects of my work with Anne’s data including reviewing: (a) her night time rituals, (b) her complaint that the RLS is worse, (c) the resulting impact on her daytime routines, (d) the change I noted in her sensor data when I quickly checked it in her presence during the recent home visit where she reported the issue, (e) the realization that the sensor data provided clear evidence of worsening RLS, and (f) the subsequent discovery that the pharmacy had mistakenly cut her medication dose in half on her latest refill. I embrace the success of discovering the reason for the worsening RLS and for recognizing this particular exacerbation in the sensor data. I re-consider my own desire to assist with developing the smart home and acknowledge a bias related to my belief in its capabilities.
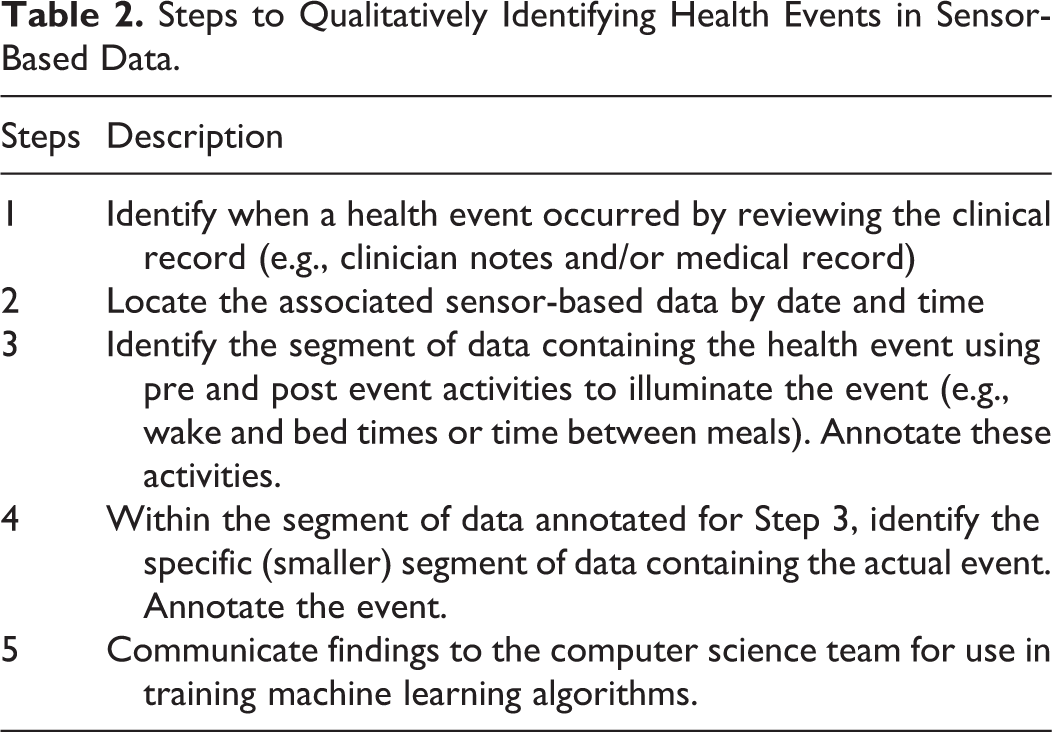
Now, at this later time, I am preparing to annotate the historic data associated with the RLS episode. I intentionally reflect on my methodological process and the steps I need to follow so all my analytic methods are rigorous (Table 2). I remind myself that despite the complexity and nascent nature of assigning clinical meaning to sensor data using qualitative methods, there is value in a clinician simply “giving it a try.” I acknowledge that for me, this is a value-laden work that assumes neoteric applications of qualitative descriptive methods are needed to address complex, real-world problems. I reaffirm in my mind that the application of qualitative descriptive methods is a good fit for this interdisciplinary, inter-methodological work. I grant myself permission to be pragmatic and to do “what needs to be done.” I take pride in being at the design table.
Steps to Qualitatively Identifying Health Events in Sensor-Based Data.
Capturing the Event
Step 1: Reviewing the clinical record
I review the nursing record that contains weekly health assessments and focus on the account of this particular RLS episode. Anne reported during a monthly home visit that her legs were “more jerky” than normal on Thursday night March 2, 2017. Reportedly, she tried to sleep in her bed (located in the bedroom) until she gave up and went to her recliner chair to sleep (located in the living room). She could not recall what time she relocated to her recliner but did report, “I am always hotter than Hades and my legs feel like stumps…they jerk all night…but it’s better when I take another pill.” In response to the question, “Tell me how that changes what you do during the day? Your routines? Or what you get done?” she said “Well, I never take naps but I’ve been dosing off here [she points to the recliner chair] after lunch…I’m just more tired…and 10 [p.m.] is feeling late now.”
I imagine her movements around the home on the night of March 2, 2017 and think about which sensors should be able to detect movements associated with RLS. The images in my mind are based on my knowledge of sensor locations and knowing Anne’s activity patterns (her routines), which are documented but are also etched in my mind from having visited Anne’s home many times.
Anne’s daily routine
Anne arises about 6 a.m., goes directly to the bathroom, and then relaxes in her recliner chair where she watches the morning news and sometimes falls back asleep. About 8 a.m. she makes coffee in the kitchen and warms up leftovers in the microwave. About 10 a.m. she leaves her apartment and goes to the lobby of her building (in a retirement community) to chat with friends until lunch time. She eats lunch in the dining room from 11:30 a.m. to 12:30 p.m. and then returns home. She passes the afternoon in her recliner or at her desk. She goes to dinner in the dining hall at 5 p.m., returning shortly after 6 p.m. to relax in her recliner. Children or grandchildren who live nearby frequently drop in for an evening visit. Anne prepares for bed about 10 p.m. and falls asleep in bed in her bedroom between 10:30 to 11 p.m.
Step 2: Locating the sensor data
I am looking for an episode of RLS based on Anne’s report, “My jerky legs are driving me nuts.” I search the database on our secure data storage platform using Anne’s assigned code and the date(s) Anne indicated she was symptomatic. I download de-identified data to my desktop from March 2 and 3, 2017. I also include all data from the 24 hours before and after the event (March 1 and March 4) as well as any comparison data that are needed for a scoping data review (discussed in Step 4). I iteratively move between the two data types: the record of Anne’s experience and the sensor data from the night of March 2, 2017. The descriptive nursing report includes: documentation of the date, time, and type of visit (telehealth, home visit); physical assessment (head to toe); medication updates (dose changes, new or stopped medications); a balance and movement test (Timed Up and Go); functional status (use of assistive devices, other resources like housekeeping); daily routines (highlighted changes in routine since previous visit); sleep; post-visit nursing notes and additional thoughts. About 400–500 lines of data out of ∼3,000 are relevant to my search for evidence of RLS. In my mind, I filter out the irrelevant data out like I would mentally sort traditional qualitative transcripts that contain “Uhms” or “sirens heard outside” or “dog barking” to locate phrases or words with real meaning. Relevant sensor data include all motion, door use, and object use data. I sort out less informative data such as temperature, light, humidity because these do not enhance my understanding of movements that regard RLS symptoms. I look for data showing when Anne went to bed and when she got up the next morning. I recognize the event will be book-ended by data showing her bed time and wake time and that finding these data will help illuminate the event.
Step 3: Identifying data boundaries
I locate sensor data indicating she was in bed on March 2, 2017 and then skip to the other “book-ended” data showing her arising in the morning. I section-off a segment of data (beginning at bedtime and ending at wake time) and begin a line-by-line review. I return to data from the evening before the event and locate data showing food-related activities in her kitchen about 6 p.m. (2017-03-02 18:00:00.101006 KitchenAArea ON) followed by relaxation in the recliner (2017-03-02 18:49:45.313111 LivingRoomAChair ON) followed by pre-bedtime bathroom activities (2017-03-02 20:31:33.619317 BathroomASink ON). I let the sensor data to tell the story of her evening activities, which appear to be normal except that she stayed in her apartment for dinner instead of taking it in the retirement community’s main dining room. I note she spends time in the recliner watching television and naps between 7:48 p.m. and 8:16 p.m. (sensors were almost completely quiet—not activated by movement—during this time):
2017-03-02 2017-03-02 19:48:09.110357LivingRoomAArea ON 2017-03-02 19:48:10.348093LivingRoomAArea OFF 2017-03-02 20:16:30.786559LivingRoomAChair ON 2017-03-02
I note she had her usual late evening snack (2017-03-02 20:32:05.415467 KitchenAArea ON), spends 5 minutes in the bathroom between (2017-03-02 22:34:26.242197 BathroomASink ON…2017-03-02 22:39:34.565052 BathroomAArea OFF), and finally retires to her bedroom at her normal time between 10:30 and 11:00 p.m. (2017-03-02 22:40:03.024739 BedroomAArea ON).
After reviewing her evening activities and identifying her bed time, I skip to the next morning around 7:00 a.m. and look for data that represents her getting up to the bathroom and then moving to the kitchen, which is her normal morning routine. I locate both the evening and morning activities as well as her bed time and wake time and annotate start and stop times of these activities (Figure 2).

Clinician-annotated sensor data. This figure illustrates Anne’s RLS beginning on March 2, 2017 at 11:59 P.M. Sensor activations are shown that represent beginning, middle, and end of RLS movements (by time). Data that bookend the actual event (i.e., boundaries, pre an post event activities) help illuminate the event so it can be accurately identified. Ellipses replace data to shorten sequencing for this figure.
Step 4: Annotating ground truth
The primary abnormal event is represented in the data by an anomaly appearing at 11:59 p.m. on March 2, 2017 and continuing until 2:52 a.m. on March 3, 2017. I see evidence that she is not sleeping well at the beginning of the night. The event itself is initially identifiable based on Anne’s report of her activities before, during, and after the event and the existence of abnormal sensor data. The sensor data tell the story of her lack of sleep. Anne’s typical pre-sleep phases are about 10–30 minutes and are represented in the sensor data by the number of lines of data. The amount of pre-sleep lines of data might range from 20 (i.e., falls asleep quickly) to 100 (i.e., falls asleep slowly). This is followed by data that includes time gaps, meaning none of the sensors are sensing motion. I assign meaning to the lack of data (within these time gaps) and conclude that the resident is asleep. On this night however, Anne does not have any gaps in the data and I conclude that her restless leg movements are causing the sensors to activate. On the night of March 2, 2017, the sensors are nearly continuously being activated.
During the time when Anne would typically be asleep and I would normally see significantly fewer lines of data, I note that there are 438 lines recorded (exhibited in part in Figure 2). Historically, about half the number of lines of data are recorded on Anne between midnight and 3 a.m. For example, on October 9, 2016 (a randomly selected mid-week night) between midnight and 4 a.m. there 268 lines of data and on October 10, 2016 during the same timeframe there were 122 lines of data. Additionally, I note that in the 24 hours of the calendar day of March 3, 2017 there were a total of 4,291 lines of data which is significantly higher than the average of 3,000. Additionally, on the night of March 2, 2017, the significant increase in lines of data leads to a suspicion that Anne is indeed experiencing an exacerbation of RLS. I mark the beginning of what I believe is the beginning of the specific segment of sensor data that represents an episode of RLS (Figure 2). To confirm the anomaly, I compare data from March 2–3, 2017 between 11 p.m. to 3 a.m. to 10 or more randomly selected dates that are from comparable times of the week (i.e., I compare mid-week to mid-week and weekend to weekend). At a minimum, I select 2 days from the preceding and proceeding weeks each (n = 4 days), two from 2 weeks prior, two from the preceding month, and two within the previous 6 months during times when no health issues are noted in the assessment data. Sometimes, more days are added and the scope of the review is broadened (by time and number of comparisons) until I get a good understanding of the resident’s sensor data norms, which I then compare with the specific anomaly that is the health event. I review sensor data transcripts and make comparisons between the event date and other dates; considering the amount of data, location of activated sensors (i.e., living room, kitchen, bedroom), and the time data were recorded.
I note that Anne relocated to her recliner in the early morning (3:42 a.m.) where evidence exists that her RLS continued (Figure 2). I see this sequential order of movement in the sensor data and make note of when she went to the living room followed by multiple trips to the bathroom, kitchen, and back to the living room where she rested (but did not sleep) in her recliner. Anne finally arises for the day at 6:25 a.m. The direct boundaries of the event are noted as “2017-03-02 23:59:24.495377 BedroomABed OFF” and “2017-03-03 03:43:00.691694 LivingRoomAChair ON”; she dosed some between 2:52 a.m. and 6:25 a.m. Dosing was represented in the data as motion gaps, for example, no data were recorded between “2017-03-03 02:52:53.586971 KitchenAArea OFF” and “2017-03-03 03:14:31.788469 LivingRoomAChair ON” (21 minute gap) or between “2017-03-03 03:43:01.815711 LivingRoomAChair OFF” and “2017-03-03 06:02:25.639415 HallwayA ON” (79 minute gap indicating restful sleep). The general event boundaries were noted at “2017-03-02 22:40:00.401570 BedroomAArea OFF” and “2017-03-03 06:25:53.811165 HallwayA ON.”
Step 5: Communicating findings
Once the RLS event has been identified and annotated in the sensor data, I communicate my findings to the computer science team using a spreadsheet where event start and stop times are noted as well as the associated diagnosis and relevant clinical notes. Ground truth annotations are also communicated (Figure 2). This information is used when training the machine learning algorithms. The data’s story and clinical context assist computer scientists in understanding which segments of data best represent Anne’s physical and activity response to RLS.
Communicating clinical knowledge and qualitative interpretations of sensor-based data to non-clinical team members who are solely accustomed to quantitative ways of thinking and knowing can be challenging. I find computer scientists prefer ground truth be presented in a spreadsheet, which organizes discrete data such as date and time stamps and alphanumeric strings. I communicate three separate items: a paragraph style quarterly summary of the participant’s routine behaviors and activities, the spreadsheet containing ground truth interpretation (with event beginning and ending timestamps), and a set of annotated raw sensor data. The spreadsheet captures: (a) the type of event (e.g., RLS, a fall); (b) symptoms experienced prior to the event; (c) associated diagnosis; (d) date and time of event and whether it occurred during the day or night (i.e., according to the participants diurnal rhythms); (e) duration of event (i.e., in minutes); (f) sensor data activation characteristics (e.g., combination of sensor activations versus single sensor continuous activation); (g) routine movement and the associated change in movement); (h) beginning and ending lines of data; and (i) clinician comments that add to contextual understandings (Table 3).
Clinical Interpretation of a Health Event Communicated to Engineering.

Discussion
Big data derived from a variety of sources (e.g., sensors, numeric reports, and more) indirectly represent human activities in the real-world. These types and amounts of data are increasingly used in the delivery of healthcare. Intelligent algorithms are already in use in many areas of healthcare including, oncology, ophthalmology, pathology, radiology and more. Many AI agents are functioning more accurately, reliably, and efficiently than their human counterparts (Topol, 2019). Despite the increasing use of big data and the associated work of AI in healthcare, many computer algorithms designed to analyze large clinical datasets are often created absent of clinical context, insight, or validation (Topol, 2019). The lack of clinical context sets these technologies up for failure or suboptimal application in the clinical setting. One issue is that there is a considerable lack of interdisciplinary and inter-methodological knowledge and abilities in the field of big data. Further, a scarcity of clinicians trained in interpreting and using big data exists. Despite being well-positioned to provide symptom-context and real-world context (i.e., the story) for health events that are represented in big data, few clinicians are involved in providing ground truth.
Qualitative methods, and their associated data types, add valuable context to sensor-based data. They facilitate an expert-guided approach to developing health-assistive AI. Based on our experiences, we think that using qualitative descriptive methods to provide ground truth adds consistency and rigor when training intelligent machines. Consistency and rigor are important because these machines rely on accurate interpretations in order to become capable of intentional performance. Our particular application of qualitative methods proved key to acquiring and transferring clinical knowledge about Anne’s experience with RLS so the AI agent could begin to recognize it (i.e., as an activity pattern anomaly). We know we were successful in this process, in part, because our computer science collaborators indicated our input helped them create working algorithms, and we use those algorithms in our continued research (Fritz et al., 2020; Sprint et al., 2016a, 2016b). Without the clinician, it would have been difficult, if not impossible, for the computer scientists to know what to look for in the data. For clinicians, observations of the human response to illness are a major part of how we come to know about how a person feels, and this response is indirectly observable in sensor data.
A supervised approach to training the algorithm includes setting clear rules that the computer must follow. This could include telling the computer which sensors to pay attention to, and which to disregard. In the supervised learning approach, the clinician’s reliance on observations derived from particular sensors impacted the computer scientist’s choice of computer-assigned rules. Thus, the clinician played an important role when this technique was used. Supervised learning, however, is resource intensive and is therefore less desirable from a cost and effort perspective. To address this concern, our computer science collaborators also tested semi-supervised and unsupervised machine learning techniques but these did not fare as well as supervised learning techniques supported by clinician annotations (Dahmen, 2019). Although unsupervised techniques are most commonly used for patient monitoring technologies (Dahmen & Cook, 2019; Zhang et al., 2018) they are less desirable because of their susceptibility to false positives and negatives. Expert-guided supervised learning techniques result in more robust and efficacious algorithms.
Including a participatory qualitative approach to data collection assures that the future end-user (i.e., participant, patient) has input and that ground truth is as accurate as possible. We check-back with them regarding the accuracy of our interpretations by showing them their own sensor data and our ground truth annotations. This allows us to verify the sequence and timing of the participant’s experience. We also seek their feedback on how the technology impacts their lives and what they would like the technology to do. We iteratively integrate these ideas in our interdisciplinary group discussions. In this way, end-user voices are included at the design table.
Methodological limitations and recommendations
A major limitation is the nascent nature of the Fritz Method. Clinical judgment about sensor-based data for developing AI may vary. Clinicians are not typically trained on such topics. Our team is just beginning to explore how to ensure rigor in qualitative approaches applied to alphanumeric strings and big data. Additionally, our work is limited to the type of data produced by the array of sensors we deploy. Other research teams may use sensors that produce different types of data (e.g., wearables, cameras, microphones). This limits our ability to compare the rigor of our interpretations with other teams. Qualitative methodologists need to expand their knowledge about the types of data used by computer scientists for training AI and get involved with technology design teams.
Future health technology research continues to rapidly expand yet most AI related technologies have never undergone clinical trials. Clinical trials are needed for any technology that uses algorithms to identify, predict or act on information used in patient care. Additionally, larger and more diversified samples are needed in technology development and adoption research. Exploring other qualitative traditions that might better illuminate sensor data is needed in order to increase knowledge about big data and algorithms (Dermody & Fritz, 2018). Drawing from a variety of qualitative traditions could enhance discoveries of how humans exhibit their response to illness in ways that are detectable using motion sensors. These discoveries could lead to more efficacious technology-enabled health-assistive devices. Future publications about using qualitative methods in the development of intelligent algorithms should explicitly describe how qualitative methods were integrated.
Developing health technologies should be a multidisciplinary endeavor that includes clinicians from all allied health disciplines including nursing (clinical and informatics), medicine, pharmacy, physical therapy, psychology, sociology, human development, engineering, computer science, and data science. It should also include community stakeholders (e.g., senior living industry, retirement communities). Importantly, patients and older adults with chronic conditions should be considered partners in technology development.
Conclusion
Innovative applications of qualitative methods are needed to address contemporary, complex, real-world health problems. Neoteric applications of qualitative methods can assist with rigorously interpreting large amounts of quantifiable sensor-based data to assist with developing intelligent health technologies, such as the health smart home. Qualitative methodologists and clinicians from any social science discipline can have a significant impact on the development of intelligent technology. We hope this article inspires qualitative researchers to seek out their quantitative computer science research counterparts to begin discussions about how their qualitative ways of thinking and understandings of the human experience can be used to improve the development of intelligent health technologies.
Footnotes
Authors’ Note
Portions of this article were presented at the Western Institute of Nursing 51st Annual Communicating Nursing Research Conference on April 13, 2018 in Spokane, Washington. State University Center for Advance Studies in Adaptive Systems (CASAS) Laboratory, Pullman, Washington. Specifically, we thank Drs. Diane Cook and Maureen Schmitter-Edgecombe and former students Gina Sprint and Jessamyn Dahmen.
Acknowledgments
We thank the computer science students and faculty collaborating with us at the Washington
Declaration of Conflicting Interests
The author(s) declared no potential conflicts of interest with respect to the research, authorship, and/or publication of this article.
Funding
The author(s) disclosed receipt of the following financial support for the research, authorship, and/or publication of this article: This work is funded in part by the National Institutes of Health (R25EB024327), the National Institute of Nursing Research (R01NR016732), Touchmark Foundation, and Washington State University Lindblad Scholarship Funds.