
Abstract
Despite the advantages of using qualitative data to advance research and practice, applied researchers agree that the most daunting task is trying to analyze the data rapidly and rigorously. This article introduces a quick and comprehensive qualitative analysis strategy called the rigorous and accelerated data reduction (RADaR) technique. The RADaR technique involves using tables and spreadsheets from general purpose, word processing software to develop all-inclusive data tables that undergo several revisions. These revisions, called “data reduction,” help produce shorter, more concise data tables. The RADaR technique converts raw, textual data into a more manageable and user-friendly format. It is rigorous because of the systematic analysis that occurs during each step of the process, and it is accelerated because the time required to review and reduce each phase of the data table becomes shorter as the user produces more condensed and concise presentations of the textual data.
What is already known?
Qualitative methods play a vital role in applied research because they provide deeper examinations and realizations of the human experience (Grinnell & Unrau, 2011; Padgett, 2008; Watkins, 2012; Watkins & Gioia, 2015). Compared to quantitative methods, qualitative research methods help researchers acquire more in-depth information—or the words behind the numbers—for a phenomenon of interest (Watkins, 2012; Watkins & Gioia, 2015). Despite this contribution, however, the time needed to immerse oneself into (and truly benefit from) qualitative inquiry means that researchers often shy away from collecting qualitative data and/or engaging in a rigorous qualitative data analysis process. Depending on the type of qualitative data and the analysts involved, the length of time required to collect, transcribe, and organize the data can be extensive. Similarly, some researchers argue that the most time-consuming step in a qualitative research project occurs during data analysis, as the amount of data (e.g., number of pages) and depth of the data generated from qualitative data collection methods can exceed that of quantitative data collection methods.
What this paper adds?
Though the data analysis phase of qualitative research is more difficult to execute rapidly compared to other steps (e.g., project planning, data collecion, and transcription), there are ways to expedite the data analysis phase, so that the organization, coding, analysis, and reduction of data can be handled in a more streamlined manner. What this article adds to the literature is a grounded, more holistic way of managing, organizing, and analyzing qualitative data. I contextualize this rapid and rigorous strategy for use with qualitative data considering two essential requirements of any qualitative project: the appropriate tools to perform the work and an organized system for organizing, reducing, and analyzing the data.
Introduction
For more than 30 years, advances in qualitative research methods have contributed to a broader acceptance of qualitative approaches in the social sciences, in general (Bryman, 2012; Miles & Huberman, 1994; Ulin, Robinson, & Tolley, 2005; Watkins, 2012; Watkins & Gioia, 2015), and in applied professions such as the health sciences and social work, specifically (Barusch, Gringeri, & George, 2011; Grinnell & Unrau, 2011; Haight & Bidwell, 2016; Malai, 2012; Padgett, 2008). Despite the benefits of incorporating qualitative methods into applied research and practice, most qualitative researchers would agree that a daunting, yet essential, step of any qualitative project is analyzing the data in a manner that is both thorough and efficient. This step, while necessary, is often cumbersome and time consuming, leaving researchers puzzled about what to do and how to go about making use of their qualitative data to answer their research questions. The ability to analyze qualitative data quickly and rigorously is especially important for an applied researcher whose aim is to uncover solutions to practical problems and social conditions that have direct applications to the world. Further, the resources of applied researchers may be limited and their need for analyzing data may involve its timely dissemination and application of the findings to improve the living, learning, and working conditions of communities in need.
The purpose of this article is two-fold. First, I will briefly highlight the advantages of using general-purpose word processing and spreadsheet software (i.e., Microsoft® Word and Excel) as tools for organizing, reducing, and analyzing qualitative data for applied researchers (Meyer & Avery, 2009). Then I will present a quick and comprehensive method for analyzing qualitative data called the “rigorous and accelerated data reduction” (RADaR) technique that has been used in over a dozen qualitative and mixed methods projects (e.g., Jefferson, Watkins, & Mitchell, 2016; Kales et al., 2015; Watkins, Abelson, & Jefferson, 2013; Watkins, Allen, Goodwill, & Noel, 2016; Watkins & Gioia, 2015; Watkins, Wharton, Mitchell, Matusko, & Kales, 2015). Capitalizing on the depth and naturalistic relevance of qualitative analysis, the RADaR technique provides an expedited and user-friendly way of organizing, reducing, coding, and analyzing qualitative data to obtain findings from qualitative projects and disseminate these findings to relevant stakeholders. The RADaR technique is rigorous because of the systematic strategies employed during each step of the process, and it is accelerated because the time required to produce each phase of the data tables shortens as more condensed presentations of the textual data are completed. It is also accelerated in comparison to other qualitative data analysis techniques.
For 15 years, I have used Microsoft Word and/or Excel for my individual and team-based qualitative and mixed methods projects. Intense work within and across teams using Microsoft Word and Excel as our primary data coding and analysis tool has resulted in the development and fine-tuning of this analysis technique. The RADaR technique, using Microsoft Word and/or Excel, allows users to begin with the raw qualitative data from transcripts or case records and end with a streamlined list of quotes that can be incorporated into tangible products such as presentations, papers, and final reports. Although the RADaR technique can work with either transcripts or case records, throughout this article, I describe the process for working with transcripts.
As technology continues to enhance the way researchers handle data, an exciting advantage of using Microsoft Word and Excel to organize, reduce, and analyze qualitative data is the ability to share files remotely. The Internet has made collaboration across place and space a more realistic endeavor. During the data analysis phase of qualitative projects, analysts may consider taking advantage of web-based meeting platforms such as Skype, Google+ Hangout, and GoToMeeting to maximize the time away from one another. In addition, the use of GoogleDocs, DropBox, Google Drive, and other web-based document storage services, sharing, and synchronization services can make the exchange of qualitative data files easier. When researchers need to share their data tables and spreadsheets with other analysts and because of the popularity of the Microsoft Office suite for both Mac and personal computer (PC) users, researchers can view Microsoft files on their computer, make contributions to the analysis, and save the file to a folder in a web-based document storage service that can be shared with other members of the analysis team.
The RADaR Technique Described
The RADaR technique is an individual and team-based approach to coding and analyzing qualitative data (Fernald & Duclos, 2005; Guest & MacQueen, 2008; Watkins, 2012; Watkins & Gioia, 2015). To date, I have used the RADaR technique to analyze various types (e.g., focus groups, interviews, case studies, existing documents, etc.) and quantities (e.g., 5 case studies, 12 individual interviews, 8 focus groups, etc.) of qualitative data so that my qualitative project findings could be seamlessly extracted from a data set and incorporated into specific project deliverables. Over the years, these project deliverables have included peer-reviewed manuscripts for scientific journals, theses/dissertations, final project reports, conference presentations, book chapters, and resource materials for community and foundation stakeholders.
Before implementing the RADaR technique, analysts first complete some of the preliminary and preparatory steps for team-based qualitative data analysis that have been described elsewhere (Fernald & Duclos, 2005; Guest & MacQueen, 2008; Padgett, 2008; Watkins, 2012), such as transcribing audio and/or video files and reviewing them extensively. Therefore, it is recommended that the RADaR technique be used as a tool for—and in conjunction with—completing other steps of team-based qualitative analysis. For example, the RADaR technique can occur after the team revisits the research question and “becomes one” with the data (Watkins, 2012; Watkins & Gioia, 2015), but before the team develops the data’s “open codes” (Grinnell & Unrau, 2011; Ulin et al., 2005; Watkins, 2012; Watkins & Gioia, 2015). Tables and spreadsheets developed in word processing and accompanying general-purpose computer programs (Niglas, 2007; Stockdale, 2002; Swallow, Newton, & Lottum, 2003) are the basis for the RADaR technique, as they encourage users to focus more on the content of the data and less on the bells and whistles that qualitative data analysis software (QDAS) packages offer. Below are the five steps of the RADaR technique for organizing, reducing, and analyzing qualitative data.
Step 1: Ensure that all the data transcripts are formatted similarly
Qualitative data can come in many forms, such as in-depth interviews (e.g., one-on-one or focus groups), direct observation (e.g., field notes, video recordings, and audio recordings), and written documents (e.g., archival records, newspapers, case studies, magazines, books, websites, memos, reports, transcripts). The first step of the RADaR technique (Figure 1) involves ensuring that all of the qualitative data (e.g., transcripts, reports, or other text data) are formatted similarly, although they need not be in any particular format.

Rigorous and accelerated data reduction technique.
For example, a popular way of formatting focus group data is for the transcript to include details about the focus group (e.g., date, time, location, type of group) at the top of the first page or in the page header. The name of the participant(s) speaking is oftentimes placed in bolded font, or all “caps”, and their words are either in plain text or italicized. If the qualitative transcripts all have similar formatting, this can speed up creating the RADaR Phase 1 data reduction table (Figure 2).

Step 1 of the rigorous and accelerated data reduction technique: ensure that all the data transcripts are formatted similarly.
Step 2: Place formatted data transcripts into an all-inclusive, Phase 1 data table
Step 2 involves copying and pasting the text from the transcripts (or other data reports) into a table with multiple rows and columns (Figure 3). Developing this Phase 1, or all-inclusive data table begins the formal RADaR process, as this all-inclusive data table will serve as the first in a series of data reduction tables. A “data reduction table” is the cornerstone of the RADaR technique and is a table or spreadsheet, created in Microsoft Word or Excel that contains all the information from the transcripts or other data reports. After this first data table is created, subsequent steps produce different phases of this data reduction table, each phase signifying a narrower and more specific presentation of the data that brings the analysts closer to identifying a condensed and streamlined list of qualitative results that can be used in presentations, papers, and data reports. Popular column headings for the Phase 1 data table include transcript number, questionnaire section, question, participant’s response, code, notes, and theme.
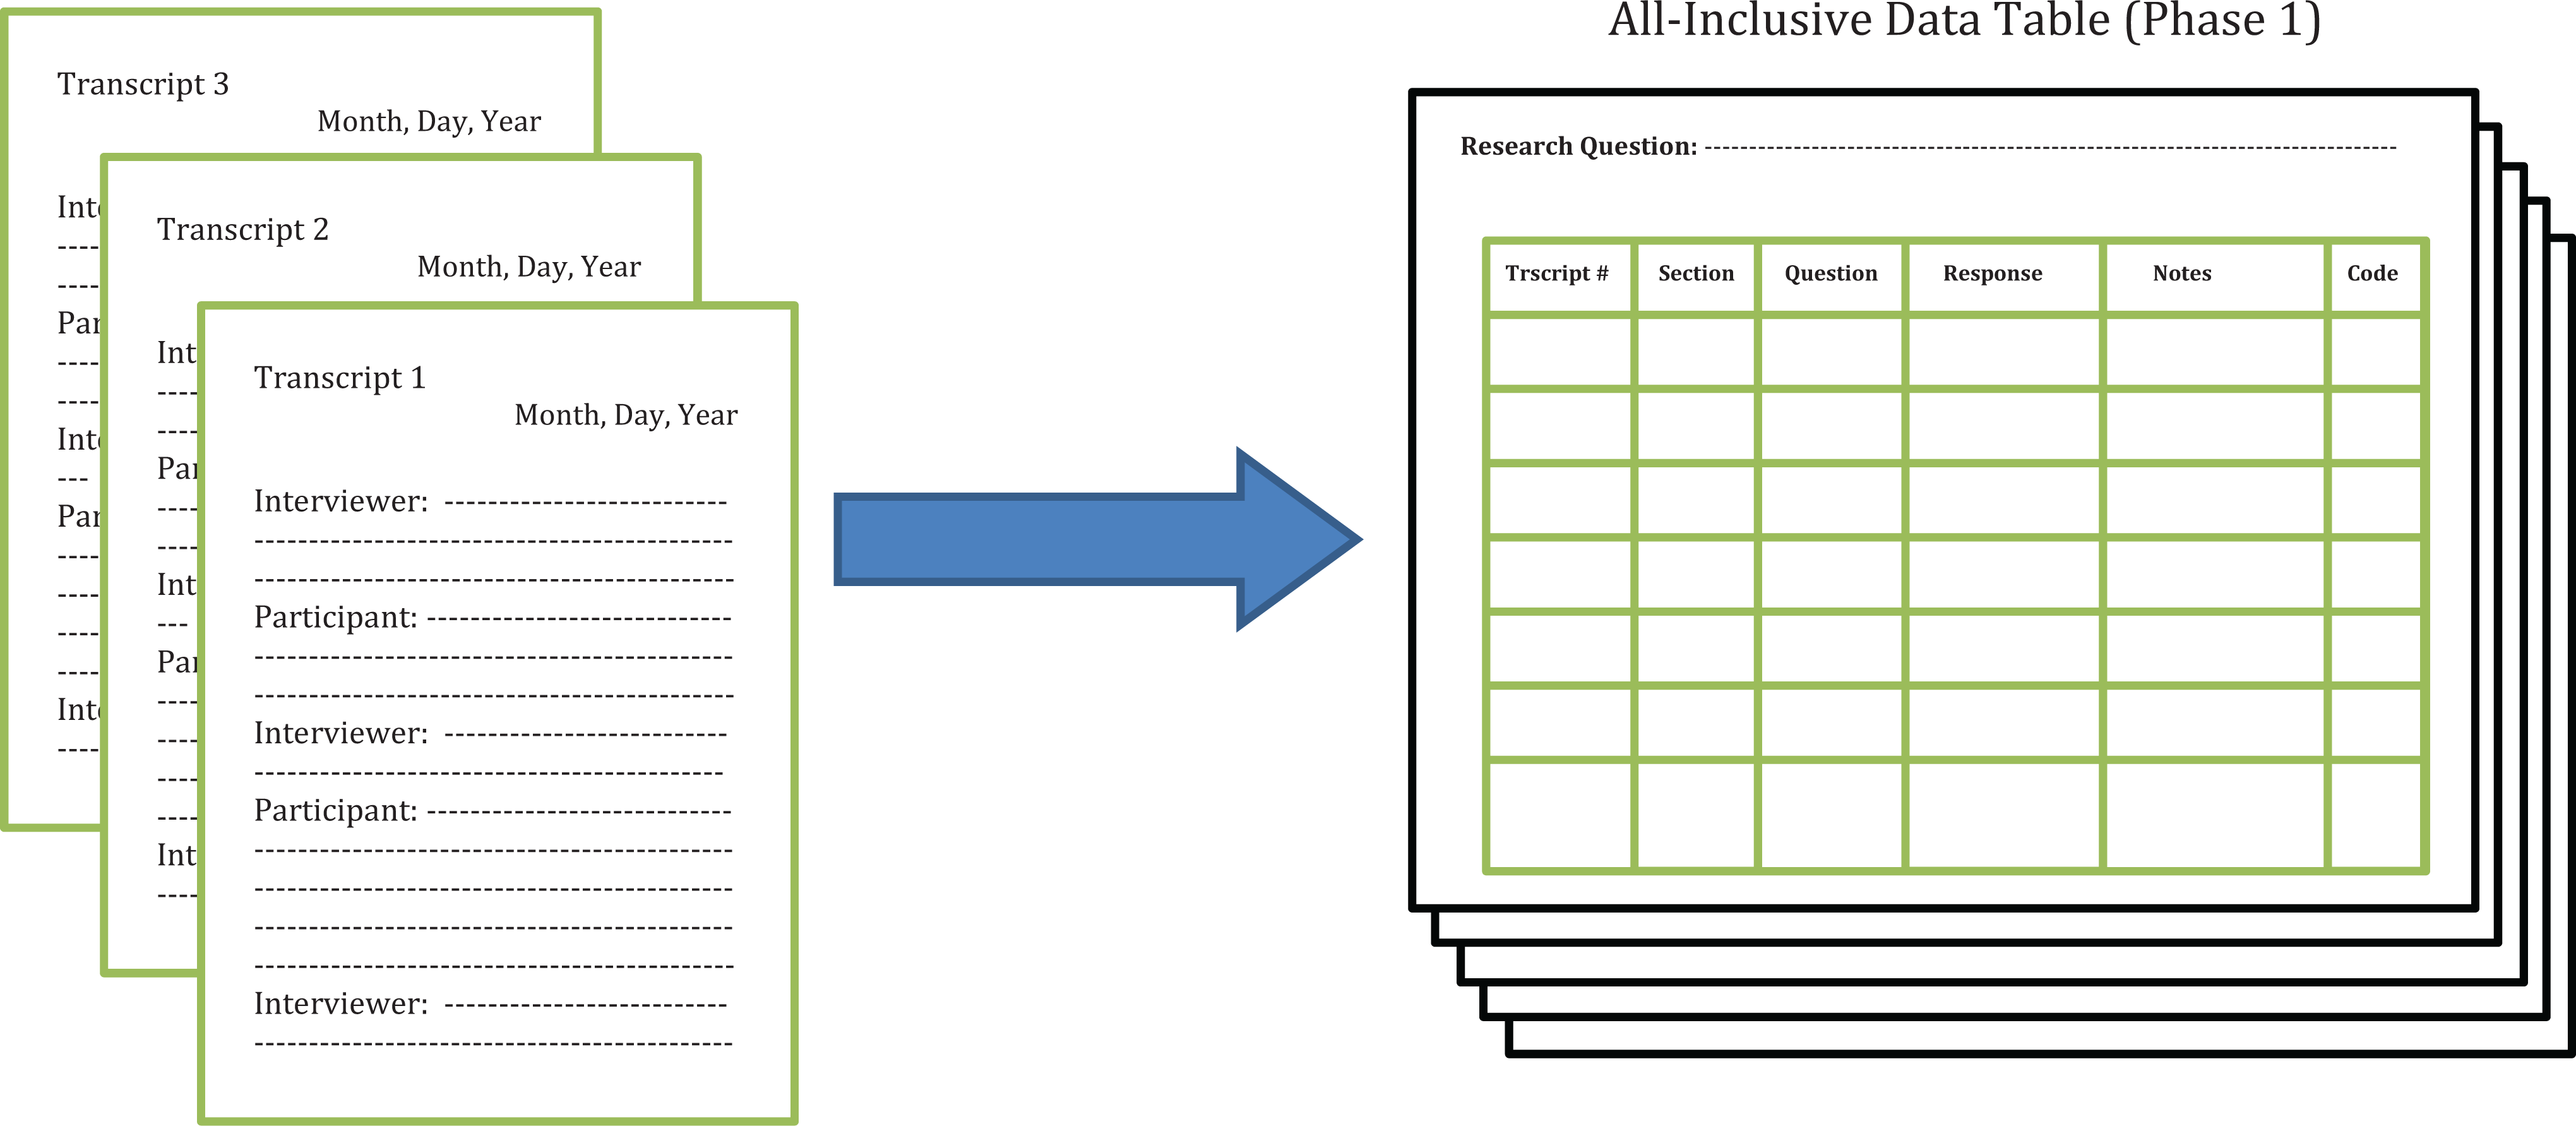
Step 2 of the rigorous and accelerated data reduction technique: place formatted data transcripts into an all-inclusive, Phase 1 data table.
The Phase 1 data table will include large segments of text taken directly from the transcripts. Another way to think about the Phase 1 data reduction table is that it includes all the data from the transcripts, but it is presented in a table or spreadsheet format; only aesthetically does it differ from the actual transcripts. The Phase 1 data table is complete once all the information from the study transcripts has been copied and pasted into the table. Once the Phase 1 data reduction table has been created, the analysts are encouraged to review the table (individually) and make notes about areas of commonalities and differences—the points of interest—that overlap across or between participants (or cities, age-groups, income levels). After this individual review of the Phase 1 data table, analysts engage with other members of the team (who would have also completed their review) to discuss the team’s goals and objectives and what they hope to achieve by the end of the analysis. Collectively, the team develops an overarching research question to focus on during this analysis, and this research question should be placed in the page header of the Phase 1 data table and referred to throughout the entire RADaR process. An example of an overarching research question could be something like “What are the social and cultural experiences of depression for African American men ages 18 to 30?”
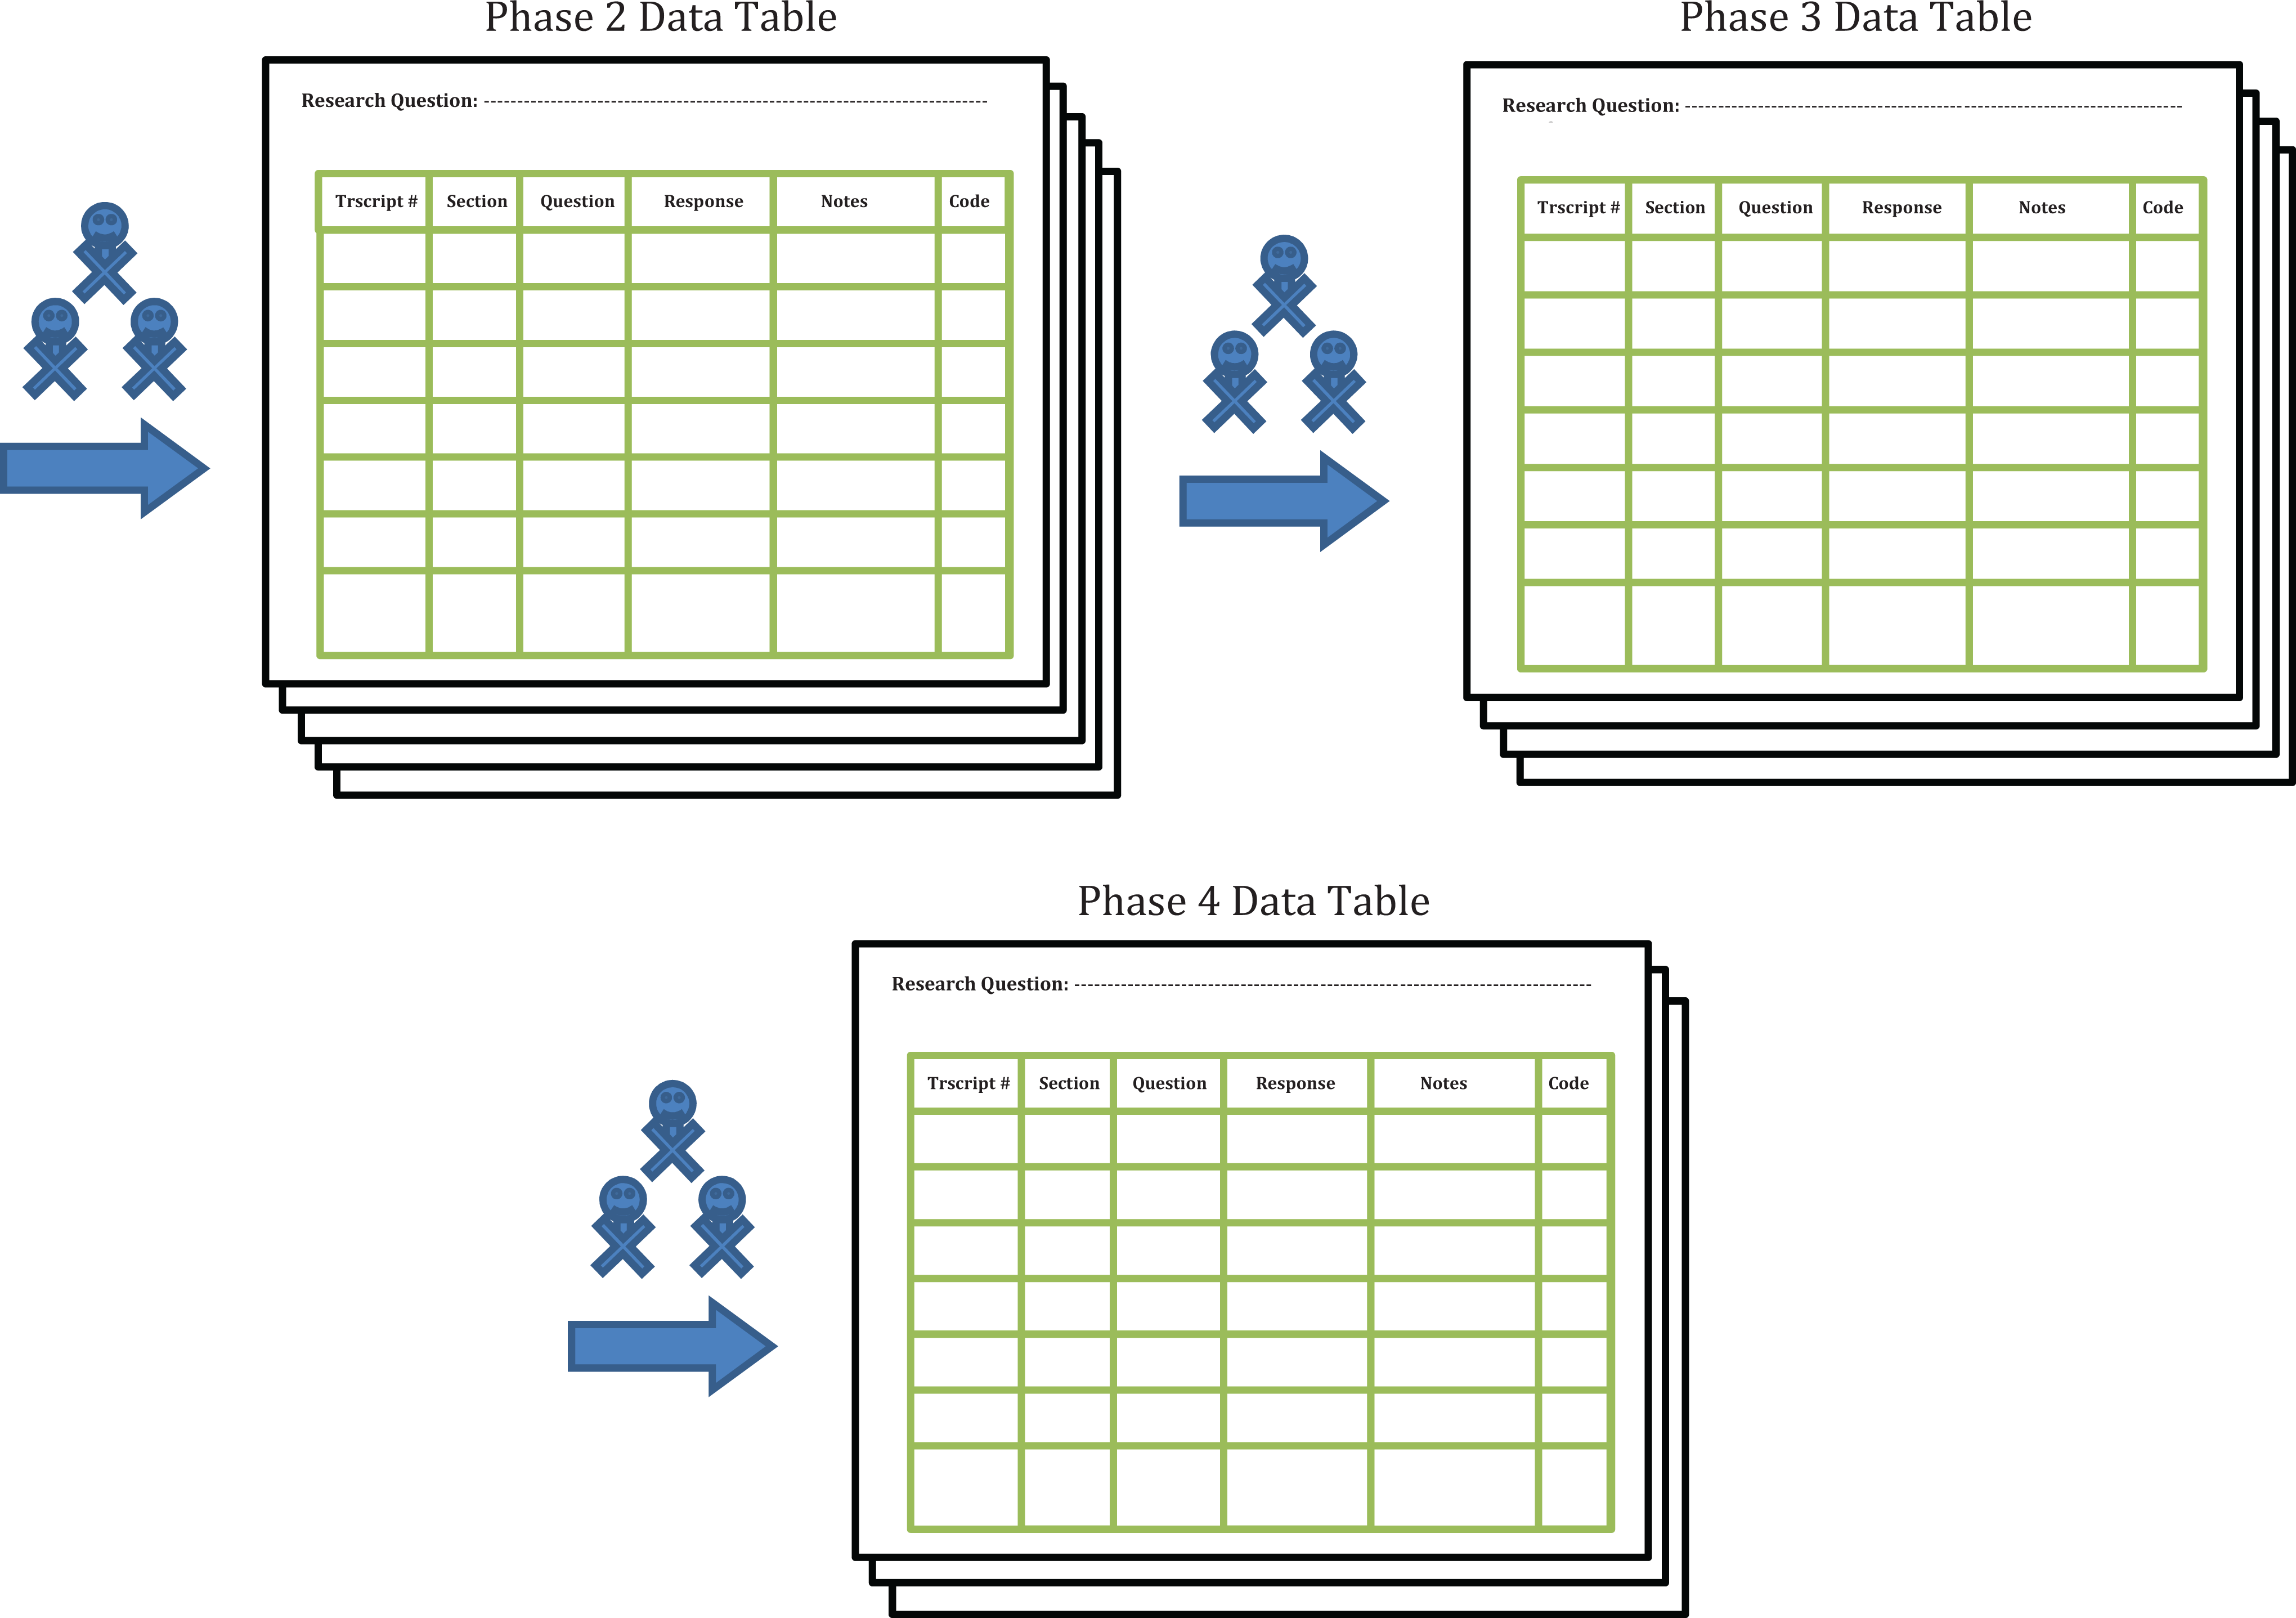
Step 3: Reduce data in the all-inclusive data table to produce a Phase 2 data table
The next step involves using the all-inclusive, Phase 1 data table to produce a shorter, more concise Phase 2 data table. Once the analysts begin to work through and think about the information compiled in the Phase 1 all-inclusive data table, they will naturally see areas of the table, or concepts from the text, they would like to focus on. Given this, analysts are encouraged to produce a Phase 2 data table, where the information from the Phase 1 data table is removed (i. e., reduced) so that what remains is only the content that is of primary interest to the analysts. This process requires the analysts to eliminate chunks of texts, or data, leaving the Phase 2 table with only the text that is relevant to the overarching research question (Figure 4). Moving from an all-inclusive, Phase 1 table to a Phase 2 table involves a process of elimination where the analysts focus on the research question in the page header of the all-inclusive, Phase 1 data table and work, first individually and then collectively, to ensure that only the data that can be used to answer that research question is included in the table. Each row of data that does not help to answer the research question should be removed. This moves the analysts toward a narrower focus on the data and encourages their progression from the development of open codes to more specific, “focused codes” (Grinnell & Unrau, 2011; Watkins, 2012). Subsequently, the focused codes can be developed into concepts and then themes that can be included in project deliverables such as presentations, papers, and reports. Staying with the theme of my overarching research question from above (What are the social and cultural experiences of depression for African American men ages 18 to 30?) an example of an open code that might be used to address this question is “African American men believe that social media is a vehicle for depression education.” An example of an accompanying focused code might be “social media as a depression education tool.”

Step 3 of the rigorous and accelerated data reduction technique: reduce data in the Phase 1 data table to produce a Phase 2 data table.
When working with the Phase 2 data table, all the text should be reviewed and portions should be noted and highlighted (literally and figuratively). Although this review of the data is still considered preliminary, the notations made during Phase 2 are meant to guide the analysts as they interpret the text and discuss how to move the coding and analysis closer to complete; the fundamental goal is to reduce the data in the table so that the remaining data can be used to answer the overarching research question in the page header of the data table. While working with the Phase 2 data table, the notations become more refined and the preliminary open coding occurs. In other words, the notations made while working with the Phase 2 table could potentially help get the analysts closer to identifying blocks of text that can be used in a final project deliverable. The Phase 2 data table will, therefore, be shorter than the Phase 1 data table because the text that is not noted, underlined, or highlighted from the original Phase 1 data table should be removed.
Removing this text helps reduce the number of pages of the data table and helps achieve a shorter, more condensed table that includes only the data that (1) addresses the research question in the page header and (2) the analysts are seriously considering for inclusion in their final project deliverables. The Phase 2 data table usually includes a second round of notes by the analysts that are a deeper interpretation of the data as well as how appropriate the data are for helping the analysts answer the overarching research question. These notes should have their own column in the data table because they can be used during later phases of the RADaR technique to elaborate on the analysts’ interpretations of the data, particularly when producing the final project deliverables.
Variations in the structure of qualitative studies, data coding, and analysis will result in each phase of the data table looking different from phase to phase and from project to project. For the most part, the way the data and subsequent codes are framed (which will vary from project to project) is a function of how the final codes and quotes are produced. Unlike Step 2 of the RADaR technique, Step 3 involves teams making hard decisions through each observation and interpretation of the data. Team members should delight in the chance to remove rows of data that do not help address the overarching research question in the page header. This iterative process is how the team generates shorter and more narrowly focused data tables and moves from broad, descriptive tables to more focused tables that provide the most representative results that help answer the research questions and illustrate the project themes.
During Step 3 of the RADaR technique, the analysts will begin to feel the urge to attach meaning to certain concepts that emerge from the data. This is best achieved by coding the data (Miles & Huberman, 1994; Ulin et al., 2005). Earlier steps in the RADaR technique encourage preliminary coding to move the analysts closer to making final decisions about the language of the project codes; however, Step 3 is when some agreement and semi-final decisions should be made about which codes will likely remain in the code column from now until the end of the analysis. Coding with the RADaR technique is like coding qualitative data in any other form (Watkins & Gioia, 2015). However, the presentation of the codes in the RADaR technique provides more benefits to the user as he or she has designated a specific column for these codes that can be later sorted and used for more sophisticated qualitative analyses and interpretations (Miles & Huberman, 1994; Watkins & Gioia, 2015).
Step 4: Reduce data in the Phase 2 data table to produce more data tables
To reduce the text in the Phase 2 table to create an even shorter, and more condensed presentation of the data, the study team repeats Step 3 of the RADaR technique again, and as many times as necessary. Reviewing each phase of the data tables and making decisions about which text chunks will move forward in the analysis and which will be removed is oftentimes a difficult decision to make (Figure 5). This is why implementing the RADaR technique in a team-based (e. g., three or more analysts) setting is such an advantage. Working individually to develop one’s own opinions about the data and then working with others to help frame the team’s interpretation and consensus of the data is necessary for the RADaR technique to be implemented successfully. Discussing areas of commonality across groups or between participants (e.g., transcript numbers, income groups) and then generating opinions about the relevance of certain quotes to the study objectives is the goal of qualitative analysis, in general. The RADaR technique facilitates this process, alternating between work as individuals and then as team members, over a short period of time.
Step 4 of the rigorous and accelerated data reduction technique: reduce data in the Phase 2 data table to produce more data tables.
The nature of this team-based analysis approach means that it is helpful for each member of the team to spend some time alone with the data tables to generate ideas by interpreting the data within their own context. Then when these individuals hold a larger team meeting to discuss their individual interpretations of the data, they have a basis for how they generated their opinions and they can engage other team members in the process for how they reached their interpretations. During these discussions, and with their project deliverables in mind, the team makes the collective decision to remove some of the data rows and retain others. To share the workload, each team member could be tasked with incorporating the decisions made by the group into the next data table at different phases of the reduction process. This data reduction process moves the team from Phase 1 to Phase 2 to Phase 3, and so on, of the data tables.
The number of data tables needed for the RADaR technique to be completed will vary from study to study and from team to team. Largely, the decision regarding whether a team has reached their final phase of the data table is contingent upon (1) how sufficient they think the remaining data in the table is for helping them address the overarching research question they placed in the page header of the Phase 1 data table and (2) how ready they feel to decide on which chunks of data (e.g., results, sometimes in the form of quotes) and subsequent notes should be included in their final project deliverables. Depending on the team, and the nature of the study, four or five different phases of the data tables may be appropriate, whereas for other studies, and with other teams, six or seven phases of the data tables may be necessary. Since each phase of the data table represents a more concise and concerted presentation of the data to answer each study’s research question, working through the phases without any predetermined number of data tables in mind is recommended. Rigor for the RADaR technique is achieved by mapping the information in each data table phase between the individual team members and across the different data table phases throughout the RADaR process. The adjoining columns of data in the tables can be reviewed and triangulated based on a series of team meetings used to rate how well the qualitative concepts from one team members’ data tables map onto the quantitative concepts from the other team members’ tables. This process can be performed iteratively and will involve close assessments of each analysts’ reviewing, reducing, and coding styles. Disagreements among the team should be thoroughly discussed and resolved.
Step 5: Draft the project deliverables using the final phase of the data table
The information streamlined to create the last phase of the data table (which again, will vary from project to project) can be used to begin drafting language to include in the final project deliverables. These project deliverables can range from a final project report to a conference presentation, thesis/dissertation, or peer-reviewed manuscript. It is during this final step of the RADaR technique that relevant quotes are selected to help support the final themes that will be presented (Figure 6). Similarly, accompanying notes (recorded in both the actual tables and during individual and team discussions about the data tables) can be revisited and incorporated into the project deliverables. The final phase of the data table may be anywhere from 3 pages to 10 pages in length and include the final quotes or data findings that will be included in the project deliverables (the actual number of quotes or textual data can be determined by the team). When preparing to incorporate qualitative data into the project deliverables, some teams may find it useful to return to the overarching research question, then underscore the final themes of the analysis, and then identify the major codes and/or quotes from the final phase of the data table that helped them to define, refine, and illustrate those themes. Also noteworthy to consider is that the all-inclusive, Phase 1 table may be the starting point for multiple project deliverables. For example, if there are three different overarching research questions, the team could begin by focusing on the first question, seeing the RADaR process through to the end to address that question, and then producing a project deliverable that addresses that question. Once the first research question is addressed, the team could return to the all-inclusive Phase 1 data table to implement the full RADaR technique again for the second, then third research question, creating a new set of data tables to address each research question in sequence.

Step 5 of the rigorous and accelerated data reduction technique: draft project deliverables using the final phase of the data table.
Limitations of the RADaR Technique
Despite the advantages of using the RADaR technique, like other data analysis techniques, it is not without its limitations. First, while the RADaR technique simplifies the qualitative data analysis process because it does not require analysts to learn complicated and potentially intimidating QDAS, it also means that analysts will need to do many of the automated copying, cutting, pasting, highlighting, and sorting features manually. Given this, the RADaR technique may be more appropriate for managing smaller, pilot projects (e.g., 15 individual interviews or 10 focus groups) that utilize grounded theory or phenomenology. For large projects (e.g., 200 or more transcripts), as well as projects that include document reviews and existing client files, analysts should consider using QDAS packages that offer more automated features.
Next, with more extensive qualitative data, the effort and time it would take to complete the manual tasks of the RADaR technique could commensurate with the learning curve associated with new QDAS. Therefore, the reader is cautioned to assess how much data need to be analyzed before using the RADaR technique because the efficiency of RADaR would be lost at a certain point of complexity and quantity of data pages. Finally, as Step 5 of the RADaR technique suggests, the RADaR technique is most useful when the analysts are analyzing the data to produce some sort of project deliverable. For example, a final project report, conference presentation, thesis/dissertation, or peer-reviewed manuscript can be easily and rapidly produced if the RADaR technique is used properly. Knowing that the aim of the RADaR technique is to work toward a project deliverable (or two) can also relieve the potential anxiety over removing rows of data from the data tables. The analysts can remind one another that removing data from the tables is only a temporary procedure to obtain answers to the research question in the data page header and that they can revisit the data that they removed later. The use of the RADaR technique for the sole purpose of developing a codebook has not been fully tested and users should proceed with caution if the overall aim of their qualitative data analysis when using the RADaR technique is to produce a codebook, rather than a report, or other project deliverable. Despite its limitations, the RADaR technique is a useful strategy for moving rapidly through qualitative data. An example for how one could progress through the RADaR phases using a row of actual data is presented in Figure 7.
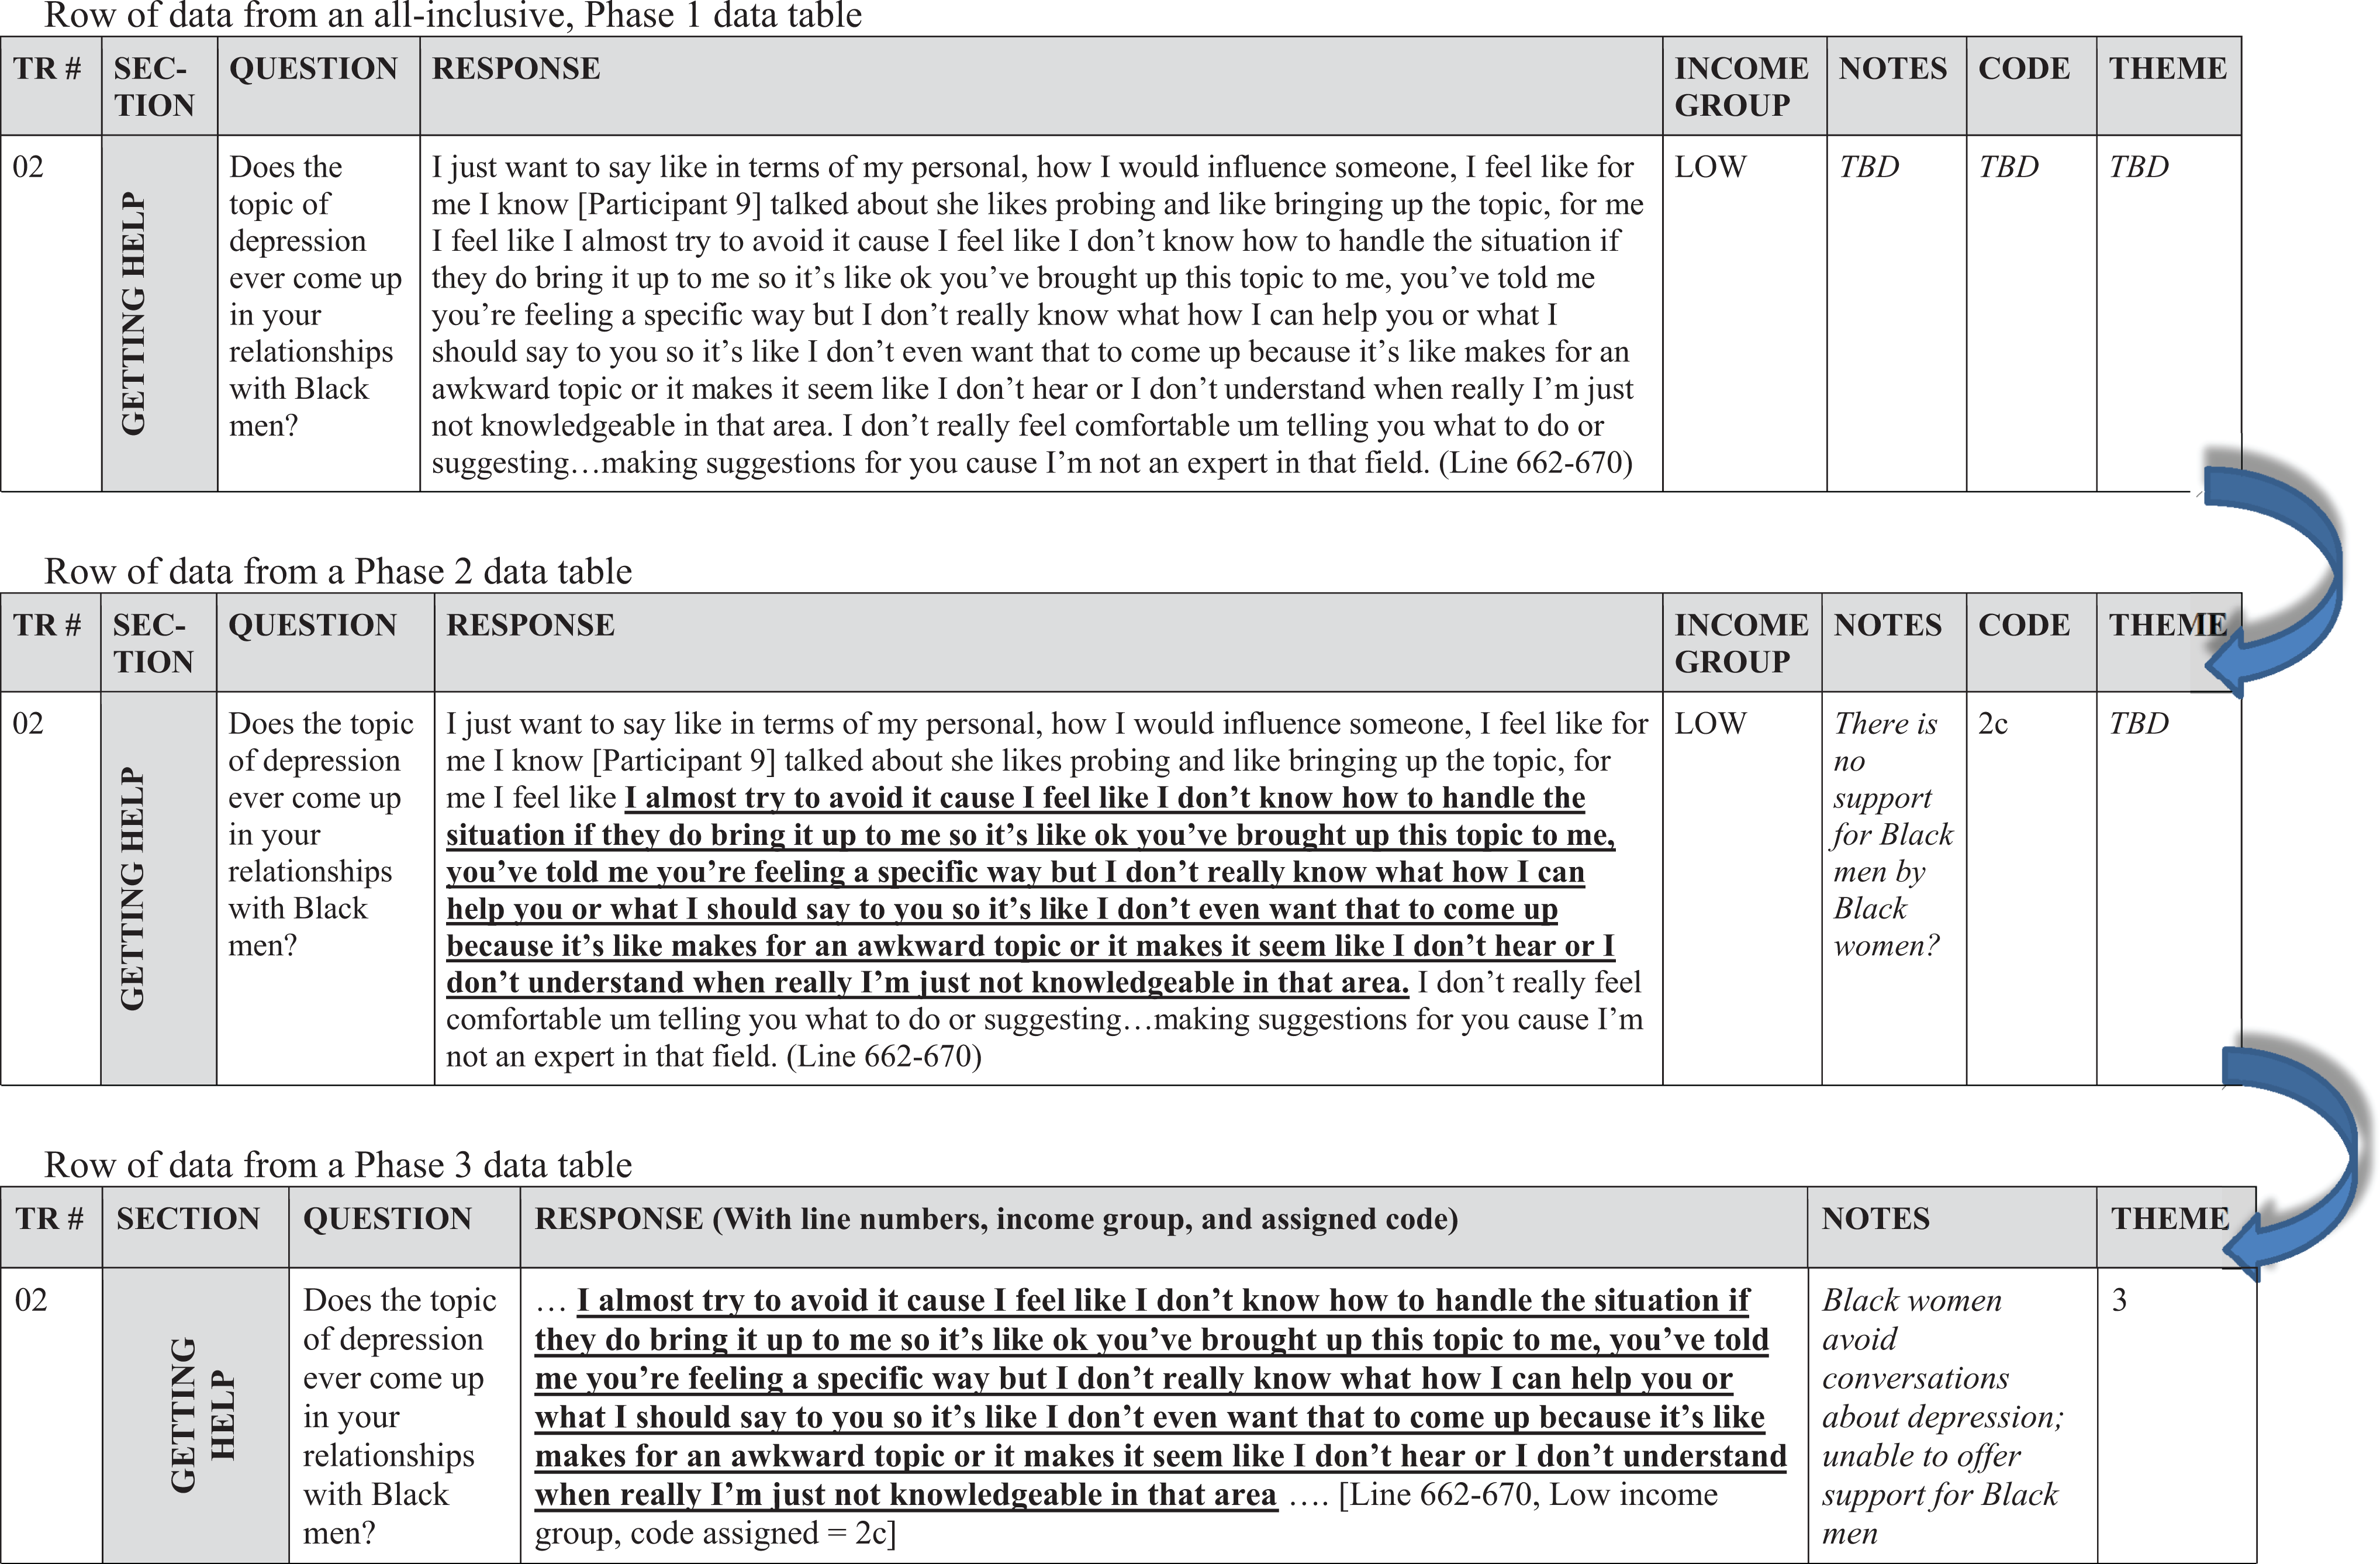
An example of a row of data undergoing rigorous and accelerated data reduction Phases 1, 2, and 3.
Conclusion
The purpose of this article is to describe the RADaR technique for organizing, reducing, and analyzing qualitative data. For applied researchers, the ability to organize, analyze, and incorporate qualitative findings into program efforts is essential to performance success (Grinnell & Unrau, 2011; Padgett, 2008). Despite their familiarity with collecting qualitative data, the steps associated with analyzing qualitative data for use in evidence-based program efforts may be intimidating for some applied researchers. The RADaR technique is a compromise between using QDAS and a more grounded approach to parsing through piles of qualitative data. The lack of user-friendly data analysis software and the time it takes to learn a new software package may prevent applied researchers from translating evidence-based qualitative research into practice efforts efficiently. One way to streamline the process of qualitative data analysis is to organize, reduce, and analyze the data using more general-purpose software packages such as Microsoft Word and Excel. These programs can help applied researchers have a clear and more organized presentation of the data, use their coding and sorting capabilities, and share files remotely. Applied researchers who use the features of Microsoft Word and Excel to implement the RADaR technique will benefit from its ability to produce qualitative results quickly and thoroughly.
Footnotes
Acknowledgments
I would like to acknowledge Jamie M. Abelson for her review of earlier versions of this article and the colleagues and students who, over the years, have found the RADaR technique helpful in moving them closer to their final project deliverables.
Declaration of Conflicting Interests
The author(s) declared no potential conflicts of interest with respect to the research, authorship, and/or publication of this article.
Funding
The author(s) disclosed receipt of the following financial support for the research, authorship, and/or publication of this article: The author has used the RADaR technique in projects funded by the National Institutes of Health, 5P30 AG015281 Michigan Center for Urban African American Aging Research; the Program for Positive Aging in the Department of Psychiatry at the University of Michigan (U-M); the U-M Depression Center’s Phil Jenkins Award for Innovation in Depression Treatment; the Vivian A. and James L. Curtis Research and Training Center at the U-M School of Social Work; and the U-M Institute for Research on Women and Gender.