
Abstract
Over the last decades, scholars and practitioners have focused their attention on the use of data for improving public action, with a renewed interest in the emergence of big data and artificial intelligence. The potential of data is particularly salient in cities, where vast amounts of data are being generated from traditional and novel sources. Despite this growing interest, there is a need for a conceptual and operational understanding of the beneficial uses of data. This article presents a comprehensive and precise account of how cities can use data to address problems more effectively, efficiently, equitably, and in a more accountable manner. It does so by synthesizing and augmenting current research with empirical evidence derived from original research and learnings from a program designed to strengthen city governments’ data capacity. The framework can be used to support longitudinal and comparative analyses as well as explore questions such as how different uses of data employed at various levels of maturity can yield disparate outcomes. Practitioners can use the framework to identify and prioritize areas in which building data capacity might further the goals of their teams and organizations.
Introduction
In recent decades, governments, philanthropic foundations, and international organizations have advocated for the increased use of data in government (OECD, 2019; Pew Charitable Trusts, 2018; U.S. Office of Management and Budget, 2014; World Bank, 2021). Public administration scholars have also identified data use as a core capability for working across silos to tackle complex problems (Dawes et al., 2009; Kettl, 2016; Mayne et al., 2020), with particular interest in the promises of big data and artificial intelligence as well as the technological, ethical, and security challenges that this massive amount of granular data present for governments (Desouza & Jacob, 2017; Grimmelikhuijsen & Meijer, 2022; Maciejewski, 2017; Mergel et al., 2016). While important, focusing on big data provides only a partial account of the debate on the use of data by governments, particularly local ones, who often have difficulty using basic data, let alone big data (OECD, 2021).
We define a data-informed government as one that incorporates data as a core lever to perform its functions and address public problems. This definition is aligned with the concept of data-driven government advanced by organizations such as the OECD (2019). Importantly, we use the term data-informed instead of data-driven, to acknowledge that decisions are made with reference not only to data, but also with awareness of the context in which data are collected and used, and therefore incorporating other considerations for making decisions based on data (van der Voort et al., 2019).
Attention to and interest in data have run parallel to the “‘evidence-based policy’ movement that developed early momentum in the 1970s and enjoyed renewed strength beginning in the late 1990s” (Head, 2016, p. 472), which promoted the improvement of public policy and practice through the use of scientific evidence (Newman et al., 2016) as well as the application of specific methodologies (i.e., randomized controlled trials) to generate evidence on the causal impact of particular policies or programs upon which policymakers can act (Coalition for Evidence-Based Policy, 2015; Nussle & Orszag, 2014). Public organizations, however, use different types of information (Jennings & Hall, 2012) and can use data to improve government services “without explicitly requiring causal inference” (Glaeser et al., 2018, p. 3). Thus, the literature and practice on evidence-based policymaking is related but distinct from that of data-informed government.
In cities, the explosion in the amount of available data has been accompained by a growing scholarly interest in smart city governance models, such as those studied or advanced by Gil-Garcia et al., (2015), Rodriguez Bolivar and Meijer (2016), Pereira et al., (2018), Ruhlandt (2018), or Tomor et al., (2019), among others. These models focus on a wide range of actors and technological applications, offering a comprehensive overview of the governace of smart cities at a high level of abstraction. While valuable, a more detailed conceptualization of the beneficial uses of data by governments, and in particular by local governments, is still needed.
There are at least three reasons why this need has not yet been addressed by existing academic scholarship. First, much of the existing research focuses on understanding the enablers and barriers to adopting specific data-related practices, such as open data (Zhao & Fan, 2018; Zuiderwijk & Janssen, 2014) or data sharing (Fusi, 2021; Chen & Lee, 2018). While this narrower focus advances the frontiers of academic knowledge, it often does not directly address the broader question of how data is currently used and what outcomes it generates. Second, a segment of the literature does examine specific applications of data, such as 311 systems (Chatfield & Reddick, 2018), precision governance (Hondula et al., 2018), or integrated data systems (Fischer et al., 2019). These studies provide valuable, in-depth insights into particular cases. However, they lack the broader, more comprehensive perspective necessary to “see the forest for the trees” and understand overarching patterns of data use in local governments. Lastly, an increasingly relevant strand of research — drawing from critical data studies as well as public management and governance literatures — has explored the ethical (Kitchin, 2014), political (Meijer, 2018), and governance (Löfgren & Webster, 2020) challenges associated with big data, particularly in urban contexts.
Collectively, these strands of the literature have significantly advanced our understanding of the potential and limitations of data use in local government. However, they have yet to produce a comprehensive, granular account of how data is used and the tangible benefits it delivers — an understanding that could guide future research and provide practical insights for practitioners. This gap is underscored by findings from recent empirical research, which reveal that many city officials still lack a clear understanding of “what data is and how it can be applied to achieve meaningful outcomes” (Puttick et al., 2022, p. 53). Similarly, an OECD study of 147 cities worldwide found that the majority (61 percent) continue to struggle with using data as a decision-making tool (OECD, 2021, p. 71). These findings align with our experience strengthening the data capacity of over 275 cities since 2017, as well as with our academic and practitioner research on how local governments use data to address diverse challenges.
To advance the field of data-informed government, in this article we present a conceptual framework of how city governments can use data to achieve positive outcomes. The conceptual framework is the result of the following process. Building on the existing literature on data uses and the literature on public value, we reviewed 132 pieces on data in the public sector as well as academic and practitioner work on data maturity models. Combined with our own experience from our original empirical research and practice, we iteratively and inductively derived a framework on data uses that we then proof-tested through an additional round of thematic-coding of the 132 pieces of academic scholarship. The result of this hybrid and iterative analytical approach resulted in a framework illustrated with examples directly derived from our work with local governments. In the next sections we describe our theoretical and methodological approaches. We then proceed to present the findings of our research as well as the conceptual framework. In the discussion section we elaborate on the potential applications of the conceptual framework as well as its limitations.
Theoretical Approach
Given the emerging nature of the field of data-informed government, the degree of theorizing in field can be categorized as nascent (Edmondson & McManus, 2007). As a result, rather than empirically testing existing theories, a more suitable approach to study this topic is to inductively explore questions and articulate concepts that can contribute to future theory development.
There is, however, existing research that can help inform our exploration of the question around how local governments use data. For example, practitioner-oriented pieces have offered some conceptualizations of data uses (Santiso and Roseth, 2017; Ubaldi et al., 2019). Academic articles have also started to articulate the objectives of big data usage (Maciejewski, 2017), and to identify when big data can be used in the policy cycle or public service delivery process (Glaeser et al., 2018; Höchtl et al., 2016). Lastly, several works have studied the levels of organizational maturity or development in the use of data (Klievink et al., 2017).
To explore the question around why local governments use data, we build on the literature on public value. The seminal work by Mark Moore (1995), showed that public value can variously be created by improving the efficacy of responses to citizens’ needs (effectiveness gains), increasing the level of activity per resource spent or reducing costs to achieve current levels of production with the same resources (efficiency gains), enhancing fairness in the way public organizations operate (equity gains), and augmenting the ability to understand and respond to citizens’ demands and aspirations (accountability gains). More recent applications of the insights from public value theory to digital government such as Bannister and Connolly (2015) provide a more granular list of outcomes that they then group in three categories: Duty, Service and Socially-oriented values. The original articulation by Moore maps accurately onto these three broad categories: accountability to duty-oriented values, efficiency and effectiveness to service-oriented values, and equity to socially-oriented values. This shorter articulation is also aligned with recent conceptual investigations of public value in digital government (Panagiotopoulos et al., 2019).
We therefore take the existing literature on data uses and public value theory as starting point. Yet, and as further described in the methodology section, we do not follow a strictly deductive coding approach to test any existing theory. Instead, we followed the advice by Edmondson and McManus (2007, p.1164) and were “guided by and open to emergent themes and issues in their data. Iterating between data collection and analysis provides the flexibility needed to follow up on promising leads and to abandon lines of inquiry that prove fruitless.”
In so doing, the goal of this research is to contribute to future theorizing by developing a conceptual framework that can serve as “the main building blocks for constructing theoretical propositions” (Goertz, 2012, p.1–2). Our conceptual framework thus seeks to provide the language required to build and discuss theories (Ostrom, 2010, p. 646) by providing a “comprehensive understanding of a phenomenon or phenomena” (Jabareen, 2009, p. 51). It also seeks to be useful for organizing large bodies of findings, identifying underlying structures in current literature, suggesting avenues for future research, and assessing situations in practice (Schwarz et al., 2007, p. 32) as well as for classifying information based on similarity (Bailey, 1994, p. 1).
Methodology
Review of the Academic Literature and Data Maturity Models
To develop our framework, we drew from three sources of information: a literature review, the review of practitioner and academic work on data maturity models, and our own research and practice working with more than 275 cities since 2017 as well as with our academic and practitioner research on local governments’ use of data to tackle a wide range of problems.
For our literature review, we conducted a comprehensive search in the Web of Science database using the search term “data” together with one or more of the following terms: “government,” “public,” “public sector,” or “public-sector.” This resulted in 6,974 records, which we narrowed down to 252 by selecting only academic articles published in English and in journals in the Public Administration, Political Science, and Management subject area categories. We also screened titles and abstracts, excluding those, for example, in which “public” did not refer to public organizations or governments (e.g., publicly listed corporations) or “data” referred only to what was being used in the study (e.g., “data” from a survey). 1 The result of this process yielded 45 articles for full-text review.
Additionally, to add comprehensiveness to the search and fill potential gaps, we used Google Scholar to conduct a snowball search of relevant materials, including books and practitioner-oriented work, as well as articles not identified in the prior search but that were referenced in some of the reviewed pieces. Through this strategy we also identified other articles that did not necessarily include our search terms because they use “city” (Ruhlandt et al., 2020) or “municipality” (Ranchod, 2020) instead of “government,” or “information” (Dawes et al., 2009) instead of “data.” This process yielded 87 additional publications, resulting in a total of 132 pieces published between 2000 and 2022. Figure 1, which plots the number of reviewed publications over time, clearly shows growing scholarly interest in the topic over the past decade.
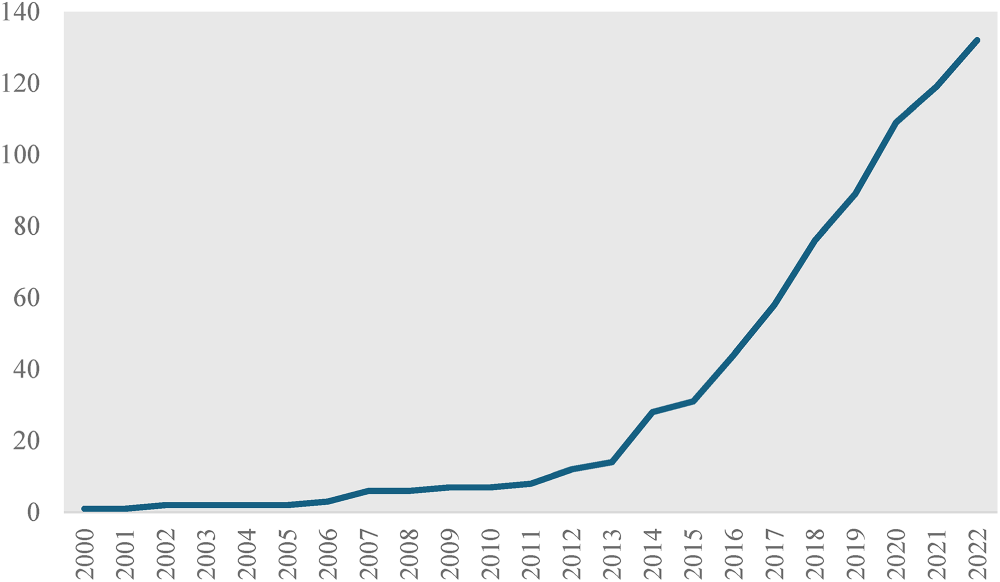
Number of Cumulative Publications (2000–2022).
Methodologically, 48 publications were theoretical (which include articles reviewing previous publications) and 96 empirical. Of the latter, 71 employed qualitative and 25 quantitative methods. Because some publications combined empirical and theoretical approaches, for example, studies that developed a conceptual framework tested via an empirical approach (e.g., Chen and Lee, 2018), the sum of these two categories (N = 144) is higher than the total reviewed publications (N = 132). Figure 2 breaks down the reviewed literature by government level and region investigated. This figure excludes papers not focused on a particular level of government but rather on the public sector more broadly, and those without a particular regional approach (e.g., theoretical papers).
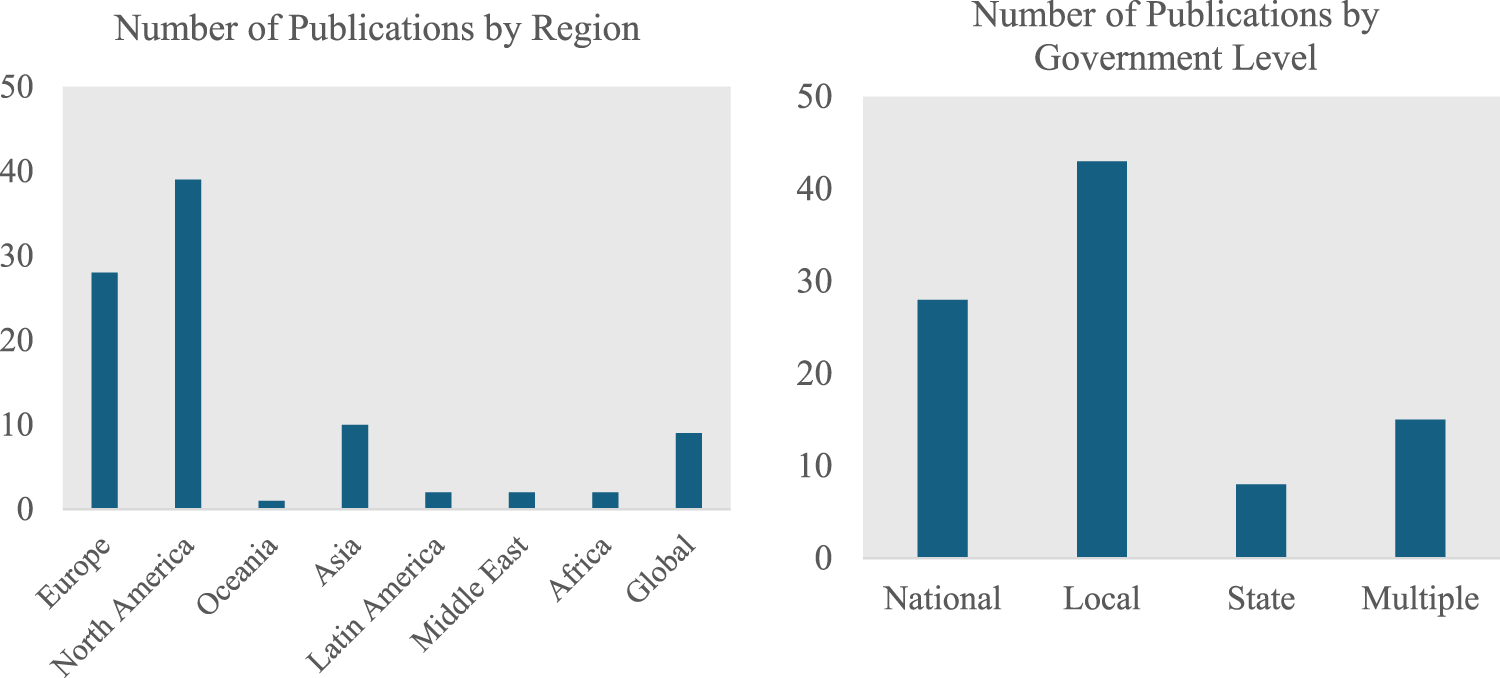
Number of Publications by Region and Government Level (2000–2022).
In addition to the literature review, we drew on two other sources of information to build our framework: a set of data maturity models from academic and practitioner literatures, and our own research and practice.
Our interest in analyzing data maturity frameworks, developed mainly by practitioners to assess maturity with respect to data capabilities, lies in their focus on identifying and measuring relevant variables. These models describe a sequence of stages in the progression towards data maturity across a set of dimensions. We treated this work on data maturity separately because its self-stated goal– to produce encompassing models of data maturity – is similar to our own goal for this paper – namely, to develop a comprehensive and granular framework of data uses. Another reason for treating this body of work separately lies in the fact that many of these models are designed to help practitioners carry out multidimensional assessments of their home organizations’ level of data maturity.
We identified 18 practitioner-focused models and frameworks related to data maturity in the public and private sectors using the following search terms in Google and Google scholar: “data,” “maturity,” “model,” “framework,” “capabilities” (see Appendix A for more information). Of these 18 models, half were designed for public organizations, but only five focused exclusively on data (see the first five in Appendix A), as opposed to broader topics such as digital government or a narrower topic area, such as open data. These are the ones we used to inform our framework.
We also reviewed academic work on data maturity. While the use of maturity models has a long tradition in academic work on e-government (Bannister & Connolly 2015; Iannacci et al., 2019), very few exclusively focus on data. Searches via Web of Science and Google Scholar for academic papers focused on data maturity in government and the public sector yielded only four articles. 2
Lastly, we drew on our own research: six articles published in peer-reviewed journals, two working papers, and practitioner-oriented materials like reports, guides, and cases published by our institution. 3 More difficult to reference with documentary evidence, but nevertheless essential to the development of the framework, were the hundreds of conversations and observations that occurred in the course of our daily work with cities and interactions with city leaders working with data.
Our coding approach was hybrid (Boyatzis, 1998) and iterative (Gioia et al., 2013). We derived an initial set of categories from the existing work by Allard et al. (2018), Ubaldi et al. (2019), Santiso and Roseth (2017), Glaeser et al. (2018) and Maciejewski (2017), and complemented it with our own empirical research, which resulted in the – still broadly defined – categories of data uses to predict situations, inform operations, evaluate decisions, and collaborate with data.
This approach was complemented and refined iteratively. We read – without doing any thematic coding at this stage – the literature identified through our literature review process. In a series of meetings, we discussed some of the additional categories identified in the literature review, contrasting them with the insights derived from our own direct practical engagement with city practitioners. This provided an additional rich source of experiences from which to derive common patterns through discussions among the research team. This more interpretative process of concept construction, integration, and synthesis (Jabareen, 2009, p. 54), resulted in the identification of additional uses of data and the refinement of each of the uses. For example, we identified “understanding problems” and “communicating information” as uses not precisely covered by our initial list. In addition, we changed “collaborating with data” to “align efforts” because we realized that such framing better articulated the use of the data, rather than an action conducted “with” data.
At the end of this stage, we identified the eight main uses of data described in the next section. We then proceeded to conduct a thematic coding of the 132 reviewed pieces to identify the occurrence of these eight uses of data. We approached this task as a mainly closed and deductive coding exercise, but still open to the possible identification of uses not covered in our initial categorization. In this thematic coding phase we also analyzed whether the reviewed pieces identified efficiency, effectiveness, accountability, and equity as outcomes of the different uses of data.
A last step in our process to develop an integrated conceptual framework involved synthesing the abovementioned sources of information and findings, to unify attributes and find coherence in otherwise disparate phenomena (Gerring, 2012, p. 143). Hence, based on our reading of the literature and our work experience, we clustered the eight uses according to temporal dimensions following the work by Ubaldi et al. (2019) and Glaeser et al. (2018), as well as the developmental dimensions inspired by existing work on data maturity models (Klievink et al., 2017). Finally, we leveraged our research and knowledge from practice to provide illustrations and examples of the data-use categories included in the conceptual framework.
An Integrated Framework of Data-Informed Government
In this section we first describe the results of our review of the literature and the data maturity models, and then present the framework of data-informed government that we developed following the process described in the previous section.
Findings of the Review of the Academic Literature and Data Maturity Models
During the review process it became clear that many of the selected publications focused on topics adjacent but not directly related to how governments use data. Examples include studies that analyzed challenges to data-sharing practices among government entities (Bigdeil et al., 2013; McGuirk et al., 2015; Chen and Lee, 2018; Fusi, 2021) and between governments and other actors (Welch et al., 2016; Susha et al., 2017), the development of data capabilities in the public sector (Weitzman et al., 2006; Ranchod, 2020), and the difficulties faced by governments adopting data practices (Allard et al., 2018; Haneem et al., 2019; Broomfield and Reutter, 2021; Bark, 2022; Puttick et al., 2022). A particularly interesting set of articles has also started to articulate a research agenda around the governance challenges posed by big data in cities (Kitchin 2014; Löfgren & Webster, 2020; Meijer, 2018), but their goal is not to parse out what the uses of such data are for achieving positive outcomes. They provide, however, important insights into the potential pitfalls associated with data that can compromise the achievement of societal benefits, and we reflect on these risks and limitations of data-informed government in the discussion section.
Other articles, such as case-based studies analyzing particular or small numbers of data uses by local governments (van Veenstra et al., 2021) or on specific applications, such as the management of environmental hazards through precision governance (Hondula et al., 2018) or customs administration using data analytics (Rukanova et al., 2020), offer great empirical, and nuanced, illustrations of data uses, but do not provide, nor is it their research goal to provide, a systematic conceptualization of such uses. Other studies examine data use only in relation to smart city applications (Gupta et al., 2020; Ruhlandt et al., 2020) or a particular data type, such as information published in the form of open data (Hardy and Maurushat, 2017; Janssen et al., 2017; Mergel et al., 2018).
Scholarly interest in big data, large volumes of often unstructured data generated from novel sources, and its incorporation into government action, has grown over the past decade (Mergel et al., 2016; Maciejewski, 2017; Merhi & Bregu, 2020), with some focused on the city level (Ali & Titah, 2021; Glaeser et al., 2018; Zhang et al., 2022). Scholars working in this area have explored new applications for as well as barriers to the adoption of big data. Yet, the data that governments, and in particular local governments, regularly use does not always fall in the definition of big data. For example, the use of administrative data collected in the context of service delivery, data from contractors regarding the management of certain city operations, or satisfaction surveys delivered to citizens are important data that do not necessarily fall under the category of “big data.” Most, even large and capable, governments still have difficulties to use existing data to improve the allocation of resources, manage and evaluate programs, and better design services. The literature on big data often focuses on the technological, ethical, and security challenges that massive amounts of granular data present for governments. Yet, these challenges are not the most relevant ones for many governments, particularly local governments. Thus, while relevant and therefore included in our review, for the purposes of our research we were interested in studying not just big data applications, but the uses of all forms of data.
Regarding the four academic articles that develop data maturity frameworks, Okuyucu & Yavuz (2020) is a review article of big data maturity models only two of which relate to the public sector, so it does not develop a novel maturity framework. Jääskeläinen et al. (2020) is more focused on information and knowledge management than data. Thomas et al. (2019) uses the “Data Maturity Model” developed by the CMMI Institute, a reference model widely used in the private sector, to evaluate the data management practices of fifteen U.S. state agencies. This model, however, focused on internal data handling practices rather than the use of data to perform a set of functions or achieve policy goals. Finally, Klievink et al. (2017) develops a multidimensional framework of big data readiness in the public sector to assess 11 Dutch public-sector organizations. This framework identifies three main uses of big data: object evaluation, research, and continuous monitoring (p.17), and then maps organizational capabilities and data needs according to each of these three uses. While useful, this model has three main limitations for our purposes: (i) it is squarely focused on big data, (ii) its uses are not granular enough, and (iii) it tends to assign a main data use category to each type of public organization depending on their statutory task (p.271). It therefore served as an important source of inspiration for our framework, but one that needed to be developed further with a more granular typology of uses that are applicable to city governments, which perform a divese set of functions (from regulatory to service delivery).
In summary, our review of the literature on data in the public sector as well as data maturity models confirmed the need for the articulation of a granular conceptual framework of the beneficial uses of data by city governments.
Conceptual Framework
Following the process described in the previous section, through our hybrid and iterative coding process we were able to distill eight main uses of data that we illustrate with examples from our own empirical research and practitioner-oriented work:
Leveraging these eight uses as codes, we returned to the 132 identified pieces in the literature to proof-test their applicability, identify their occurrence, and explore potential gaps in our categorization. Figure 3 below presents the results of our thematic coding and Table 1 provides some illustrative examples of our coding for each of the eight uses of data. While this process was mainly a deductive coding approach, we remained open to identifying data uses that could not fit any of our categories. Yet we did not find any instance where a particular use case could not fit into one of the proposed eight categories. Although subject to interpretation and further validation, this process gave us a high degree of confidence on the validity of our categories. This coding also yielded some interesting insights. For example, we found that informing policy decisions is the most common use identified by the literature, while the least mentioned one relates to learning lessons.
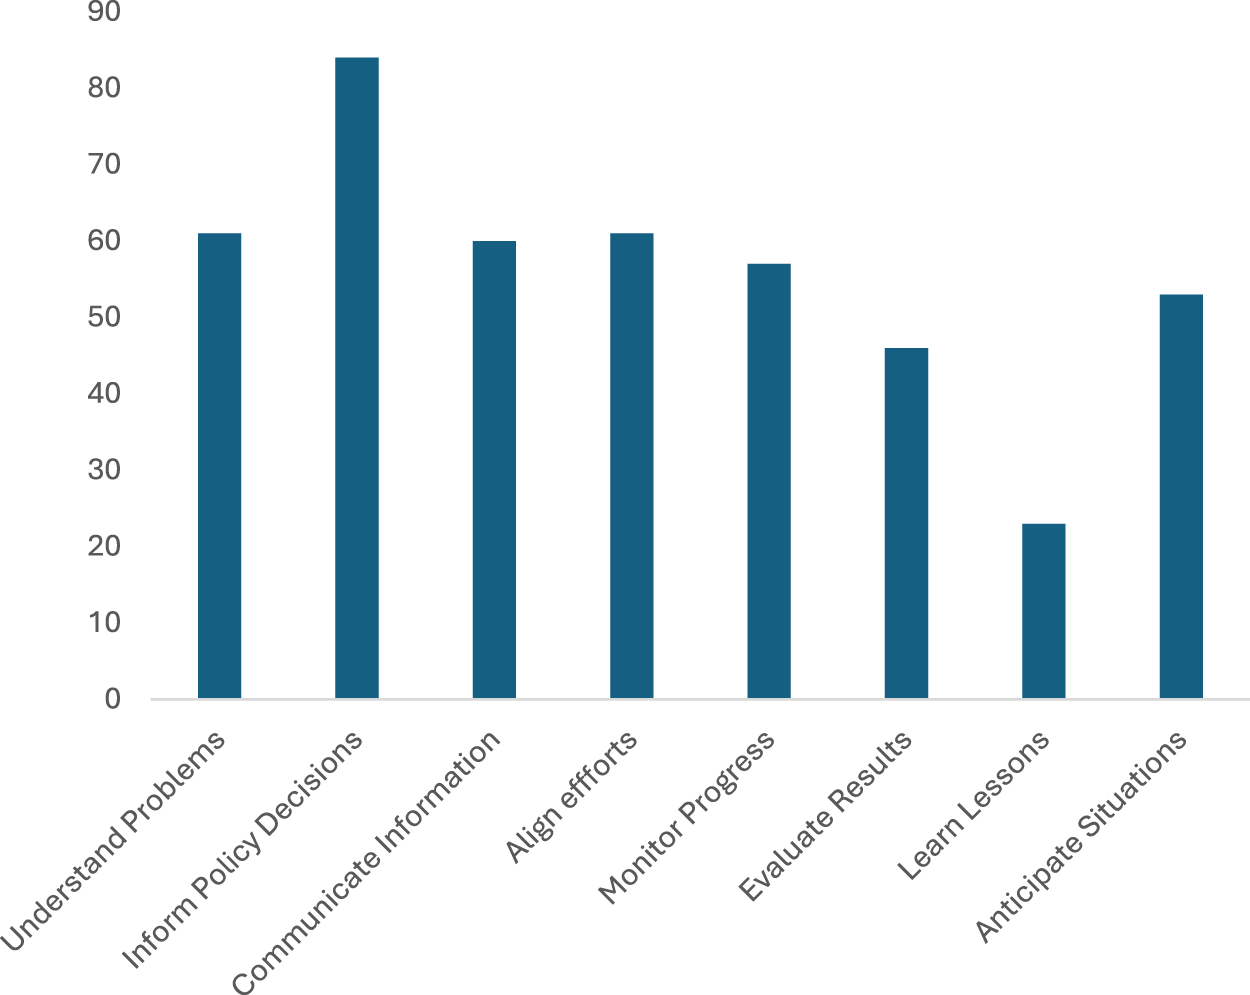
Results of Thematic Coding.
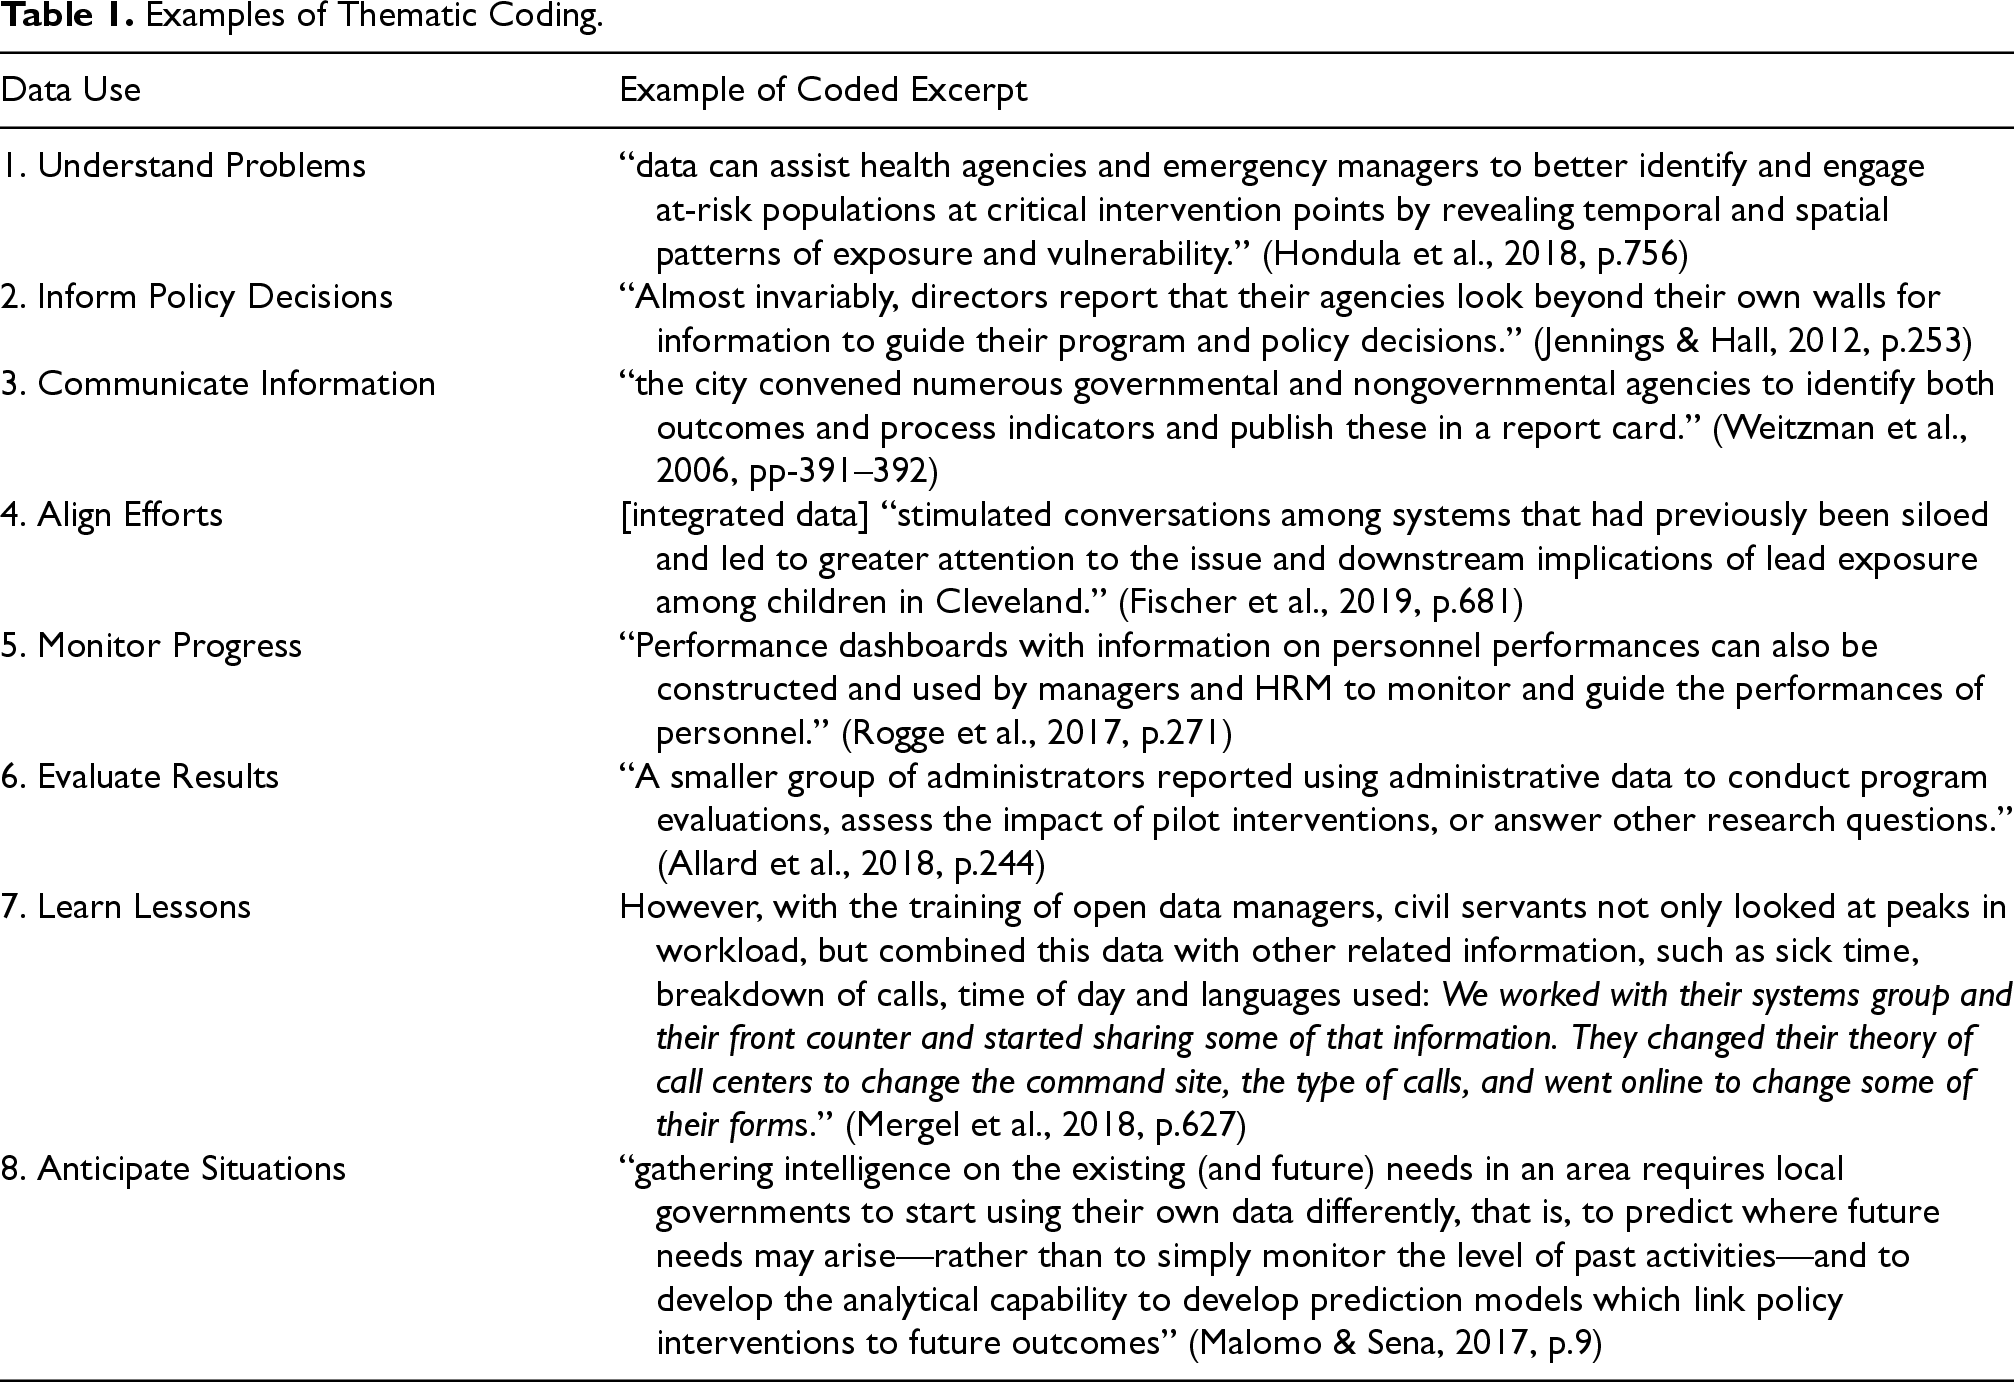
Examples of Thematic Coding.
In an effort to provide greater conceptual strength to our framework, we built on existing literature to integrate a temporal dimension, which is concerned with the stage of government action at which data are employed. Ubaldi et al. (2019) explain that data can be used to anticipate and prepare for events, design and deliver services, and evaluate performance. Glaeser et al. (2018) also develop a similar approach to categorize data uses (forecasting future activity for planning and policymaking, operating public services, and enacting and evaluating policies and regulations), which is helpful for purposes of conceptualization, but still lack granularity with respect to the uses incorporated in each of their categories. By clustering the eight identified data uses along three temporal dimensions, as shown in Figure 4, we leverage the conceptual value of the temporal dimension while maintaining our framework's precision.
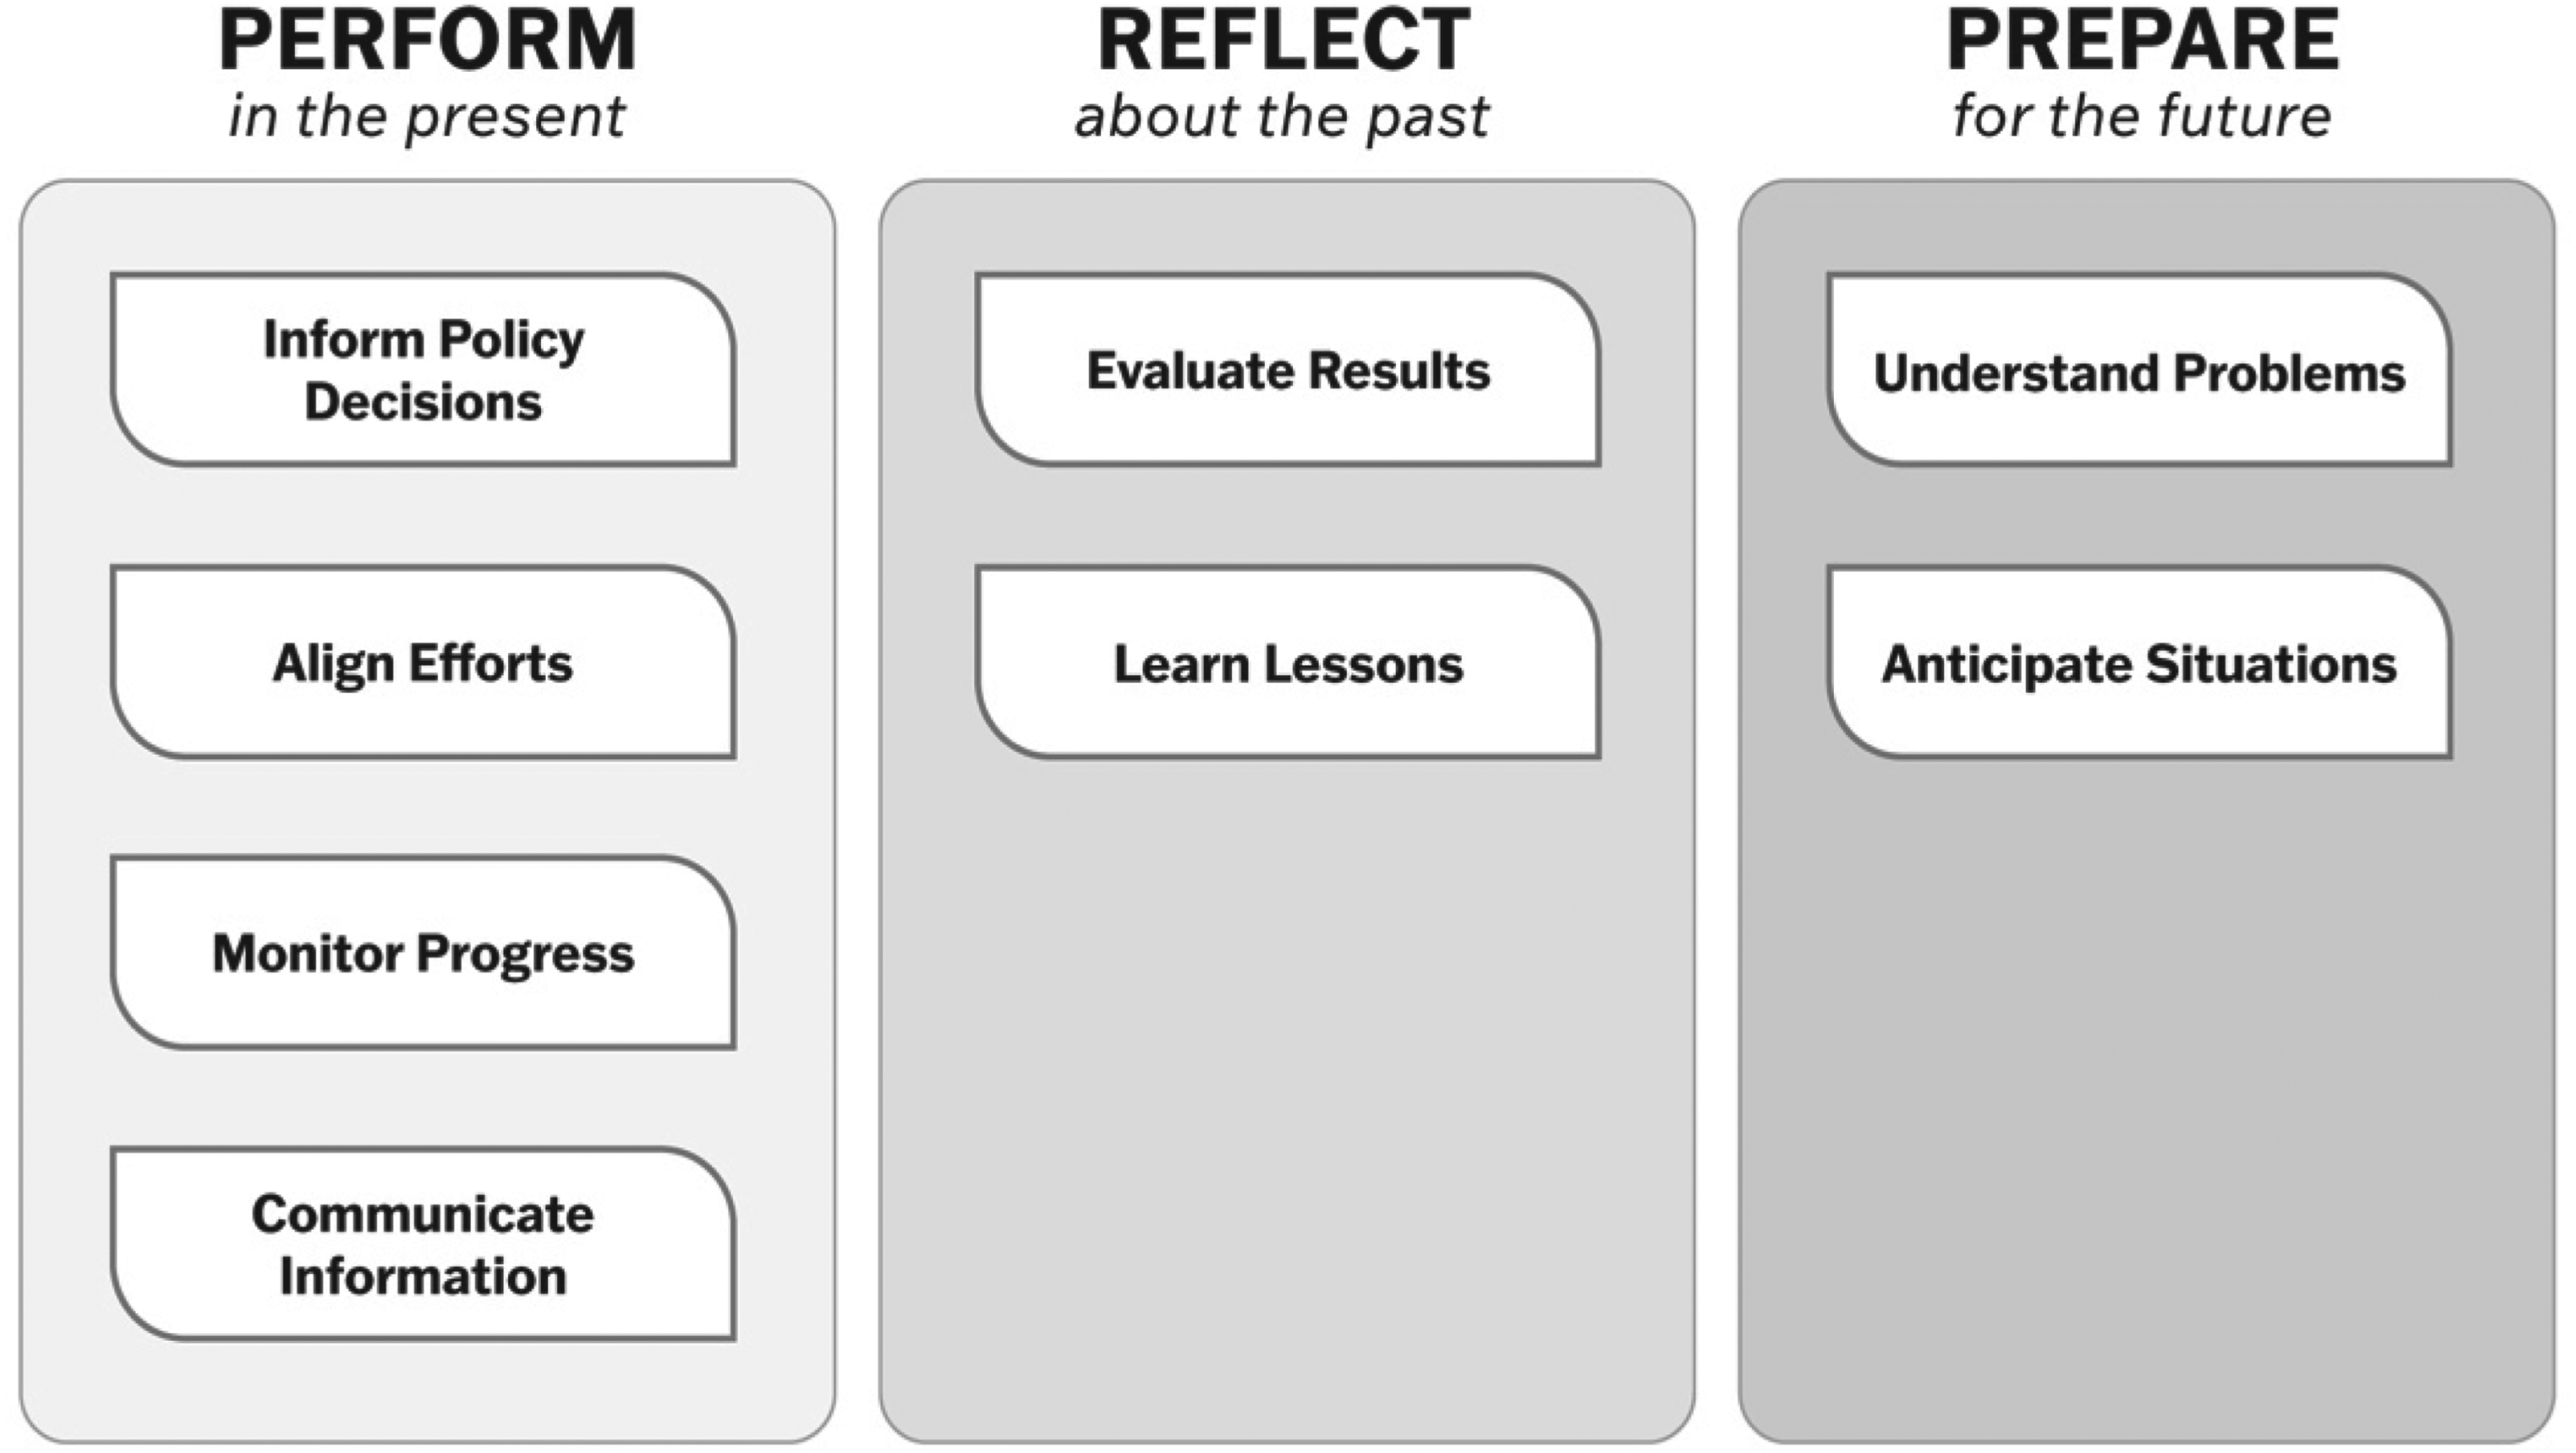
Framework of Data Uses Integrating the Functional and Temporal Dimensions.
Data maturity models provide the most detailed account of a third and final dimension, the developmental dimension, which relates to the level of organizational development required to use data in particular ways. Building on these approaches and recognizing that some data uses are more resource- and process-intensive as well as more technically complex (Klievink et al., 2017 p. 273), we identified three levels of development for each of the eight uses of data: nascent, intermediate, and advanced (see Appendix B). This is based on the diversity of sources and sophistication of requisite skills, tools, and techniques.
Some uses of data are independent of the level of development but others require specific levels of maturity. Monitoring progress, for example, can be done at all levels of development, whereas anticipating situations relies on substantial data collection, processing, and analytic capabilities and cannot be deployed with basic tools or skills. For example, the UK's Local Government Association has assessed local governments’ use of predictive analytics to be still at an early stage (Local Government Association, 2020).
Integrating the developmental dimension underscores that the uses of data most frequently employed by city governments, which typically involve using administrative data to manage services or indicators to communicate relevant information to the public, can be performed at various levels of maturity. Other uses require merging data from different sources to understand the root causes of public problems or using predictive analytics to forecast future scenarios, which presume the ability to pool data from different sources and possession of advanced tools and skills. Figure 5 adds the developmental dimension to the framework presented in Figure 4.
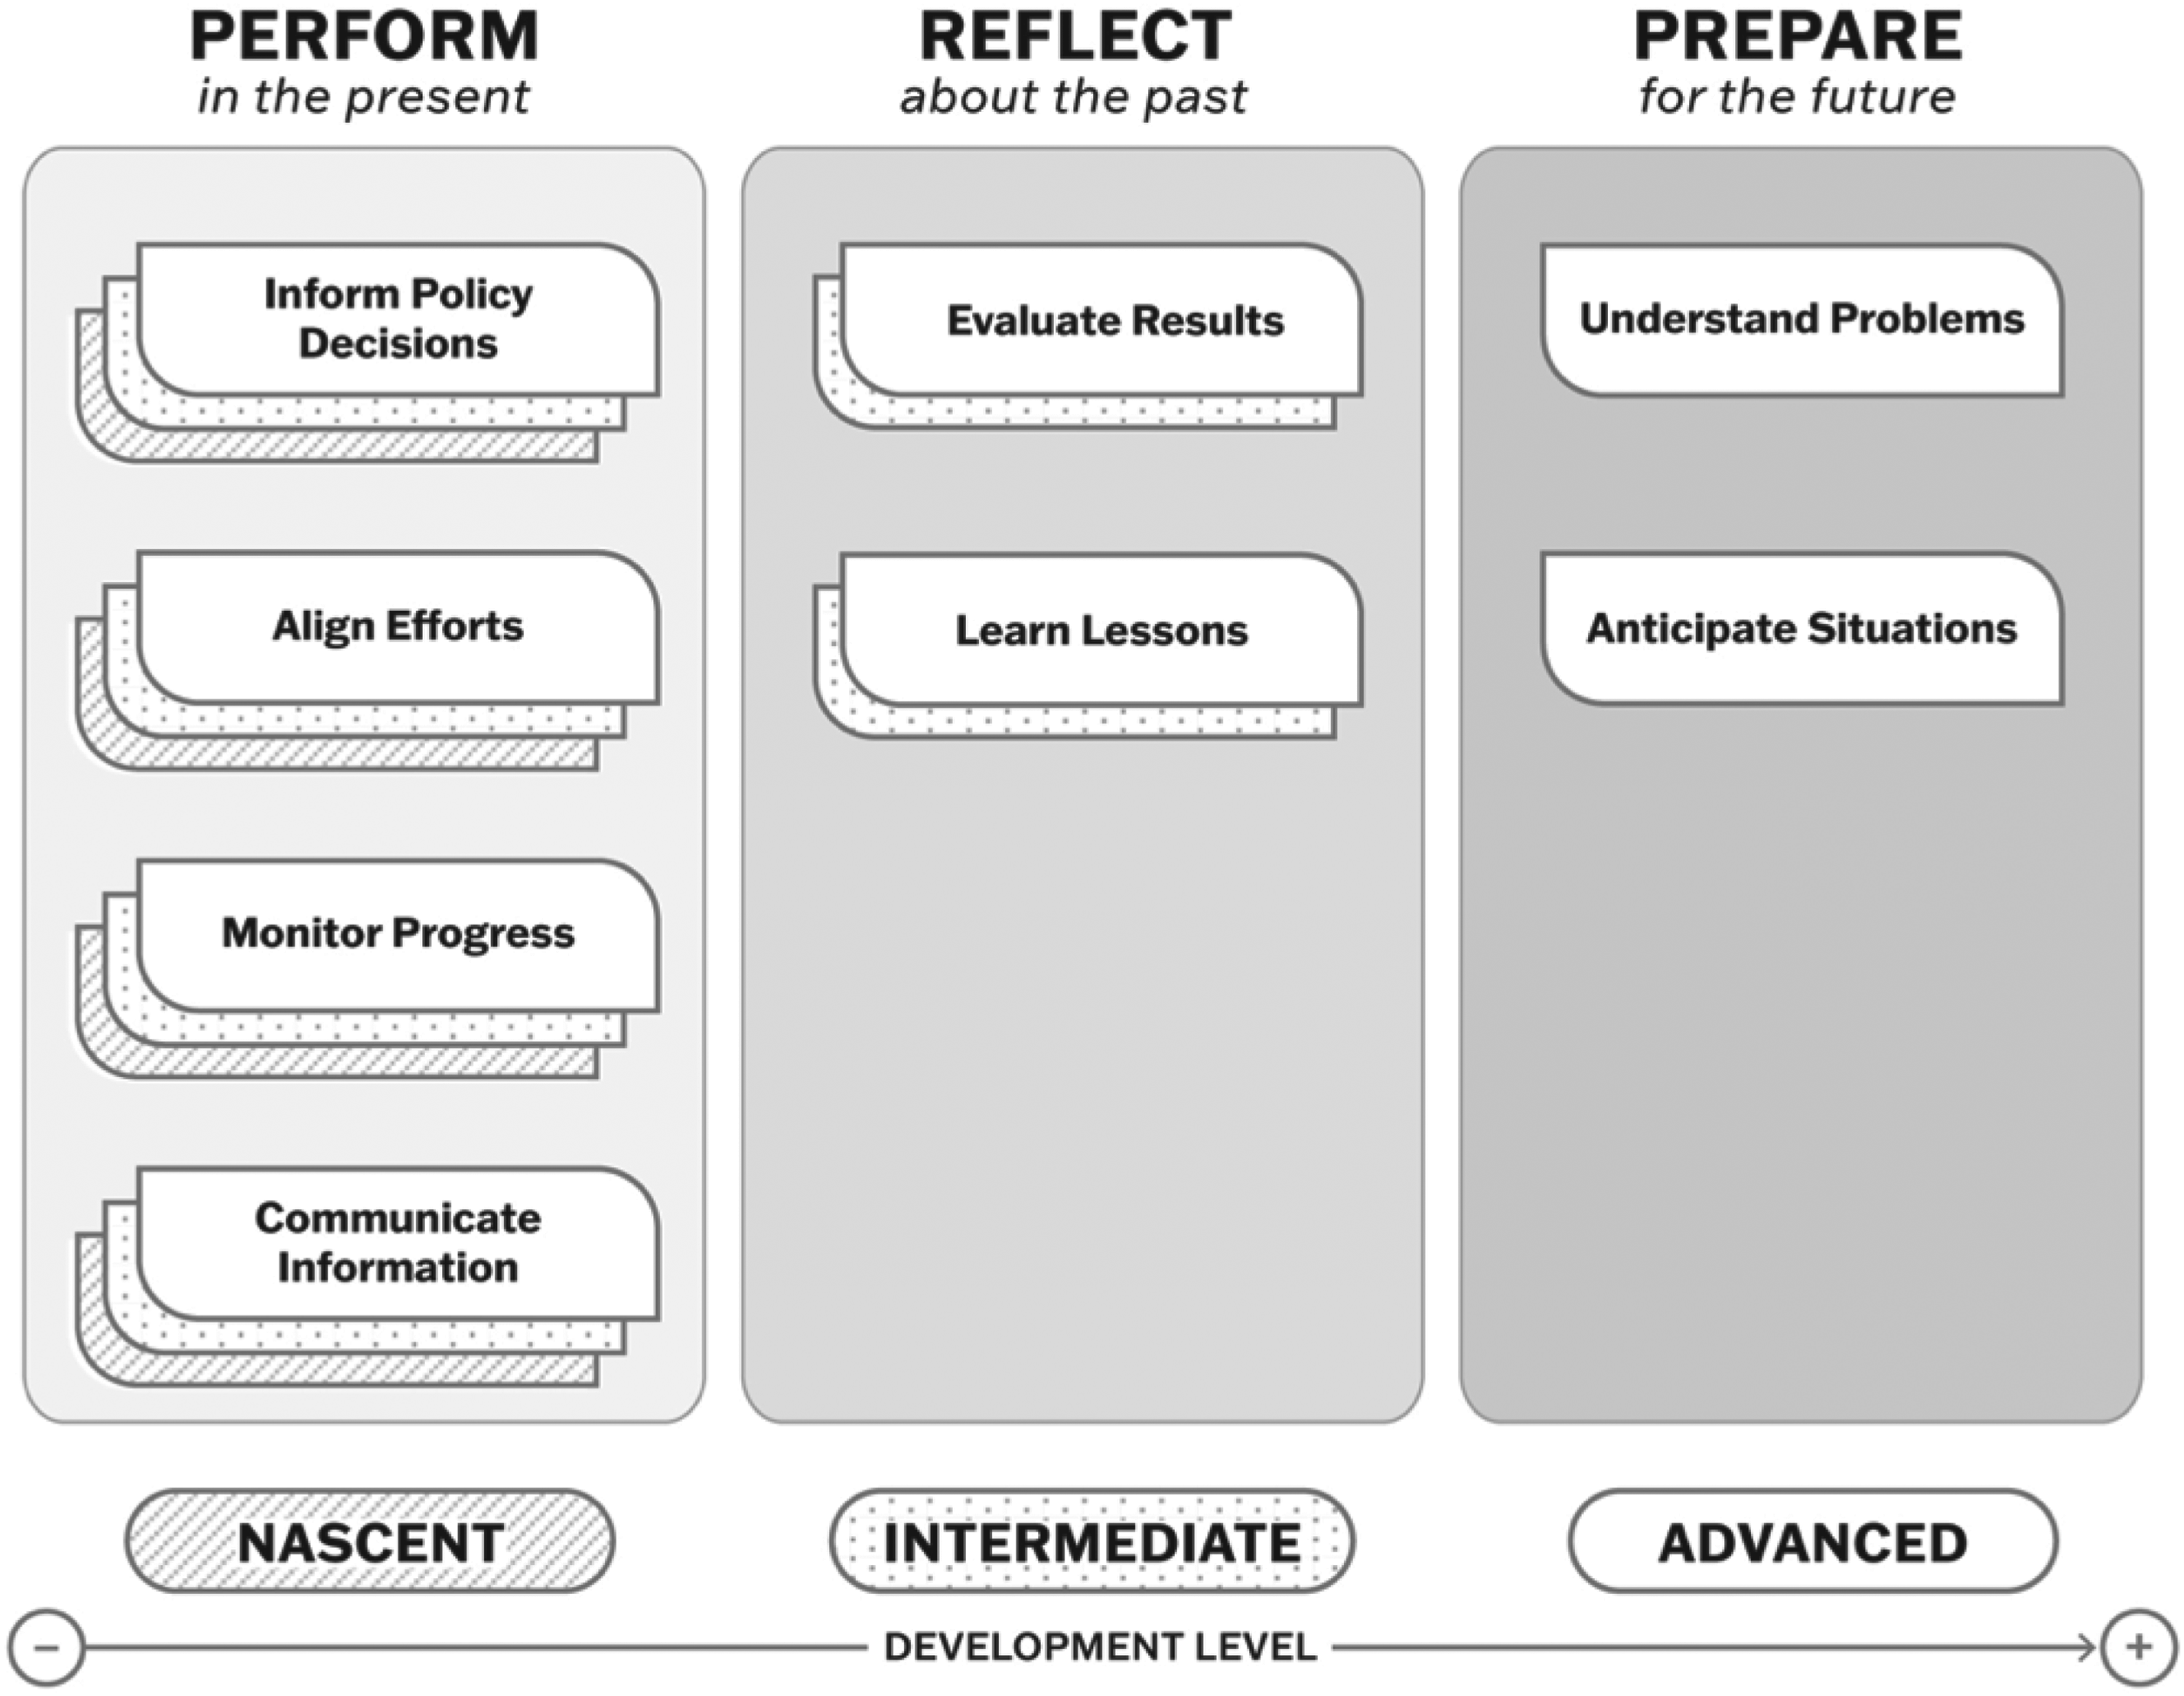
Framework of Data Uses Adding the Developmental Dimension.
Finally, we examined the existing literature to understand how these eight applications of data contribute to enhanced problem-solving within local governments. As revealed by important pieces from the performance management literature (Boyne, 2002; Walker et al., 2018), effectiveness, efficiency, and equity are the most frequently measured outcomes in that field of study. Empirical research on local governments has also found that city officials seek to leverage data to improve the effectiveness, equity, and impact of services (Puttick et al., 2022). This is aligned with broader international reviews by the World Bank, which have also concluded that data can facilitate meeting policymaking and service-delivery targets (effectiveness), inform the prioritization of scarce resources (efficiency), better target resources to marginalized populations and regions (equity), and hold governments accountable and empower individuals (accountability) (World Bank, 2021). Our thematic coding of these four dimensions of public value – displayed in Figure 6 – show that efficiency is the most commonly identified outcome by the literature, followed by accountability and effectiveness. Equity is the least mentioned outcome, showing that, in Bannister and Connolly's terms (2015), service and duty-oriented values seem to dominate over socially-oriented ones in the reviewed literature, something also found in existing research (Meijer 2018; Löfgren & Webster, 2020).
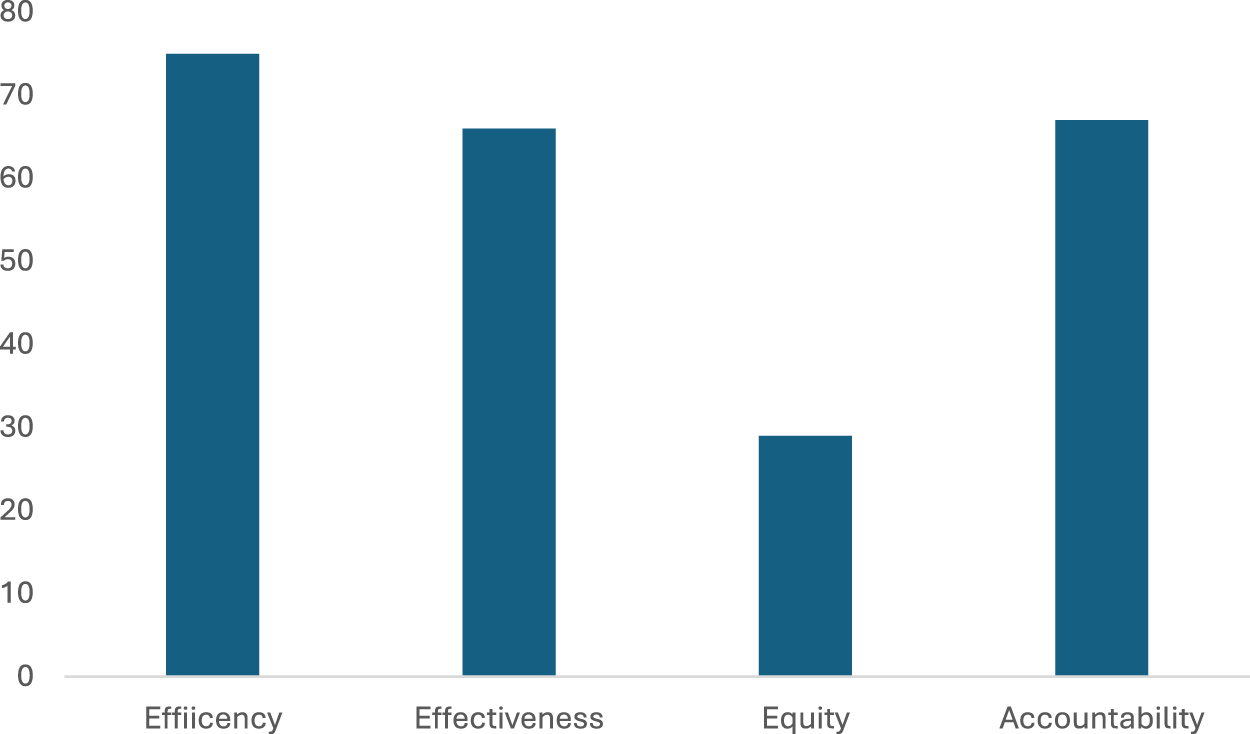
Coding of the Public Value Outcomes Identified by the Literature.
The framework presented in this article allows for a different, broader, and more nuanced conceptualization of data uses in city governments. Its integration of functional, temporal, and developmental lenses makes it particularly actionable for city leaders seeking to make their cities more data-informed and researchers seeking to study how data-informed cities evolve. In particular, it provides the needed conceptual grounding for articulating and testing propositions and research questions such as: What are the main uses of data employed by local governments? How do these uses differ by type of government or geography? Are the uses identified in the framework mainly applicable to certain types of government structures and certain geographic regions? What impediments are presented by different uses of data or level of maturity? How do the enabling conditions identified in the literature affect data uses at different stages of government action? And are particular data uses more or less associated with certain broader public value outcomes?
Academics can employ the framework as a tool for investigating the foregoing research questions by using, for example, the indicators identified in Apppendix B to construct a scoresheet for empirically testing propositions via longitudinal and comparative analyses. The framework could also contribute to qualitative research efforts by providing a conceptual scaffold for developing data collection instruments (e.g., interview protocols) and conducting case studies.
The framework can also serve as a practical tool for public officials. They could use it to prioritize data uses relevant to their contexts and to identify areas in which to build data capacity so that their teams and organizations can deploy these uses. Moreover, the framework could inform investment or government support by helping funders and policymakers evaluate data performance and identify differences across large numbers of jurisdictions. In contexts where limited information and resources make detailed benchmarking across teams difficult, practitioners could leverage the framework to structure conversations about how to improve their efforts to use data.
While we did not conduct an in-depth analysis of the issue, both our own research and the reading of the literature highlighted that the four fundamental criteria of success are not always in sync. Some studies have shown how publishing school scores to improve accountability and generate an incentive for increased effectiveness can negatively affect equity if only wealthier parents move their children out of schools with lower scores (Lavertu, 2016). But data can also be used to relax trade-offs between goals. A local government using data to better understand a voucher program supporting access to education may, after finding that money is not reaching the most vulnerable families, use data to redesign the program and better communicate with target recipients, enhancing equity by reaching those most in need and improving effectiveness and efficiency by assuring that goals are achieved and money is not wasted. Such uses have been documented in the literature, one study finding that data analytics and information dissemination tools can help expand “the set of maximum multiple public values that is achievable given available resources and the constraints among certain values” (Pang et al., 2014, p. 197).
Our close reading of the literature, and particularly those pieces taking a socio-technical perspective on data uses, also suggests a note of caution. While cities can derive important benefits from the uses of data, data alone will not solve cities’ problems. Data are not always available, and when they are, they may not provide “usable knowledge” (Lindblom and Cohen, 1979). Their usability is limited both by the form of the data and the ability of technology and humans to generate knowledge from the data. Even high-quality data may not be enough to eliminate ambiguity (Kettl, 2016) or, as some scholars argue, they are always ambiguous (Stone, 2012). At the heart of these limitations lies the realization that data are inherently linked to “people who offer up their experience to be counted and analyzed, people who perform that counting and analysis, people who visualize the data and promote the findings of any particular project, and people who use the product in the end” (D’Ignazio & Klein, 2020, p. 10, italics from the original source).
It is important to recognize that data can also result in harm. Enthusiasm about the promises of data has increasingly given way to more critical accounts of the risks posed by data beyond the well-documented privacy concerns (Löfgren & Webster, 2020). Government practitioners and scholars looking at the uses of data need to understand and be aware of these risks that can be clustered around two main issues: bias and power asymmetries. As Catherine D’Ignazio and Lauren Klein write, “The process of converting life experience into data always necessarily entails a reduction of that experience” (D’Ignazio & Klein, 2020, p. 10). As a result, data have several problems such as lack of representativeness, need for contextual information for interpretation, lack of objectivity, digital divide or potential manipulation of data (boyd & Crawford, 2012; Desouza & Jacob, 2017). Biases do not happen just at the point of data collection but at every other step in the data lifecycle. This is particularly evident when deploying predictive analytics algorithms and risk scores that contain cognitive or social biases and further entrench social and racial discrimination (Grimmelikhuijsen & Meijer, 2022). Similarly, excessive reliance on a limited number of metrics as well as over-reliance on easier-to-collect (quantitative) data can result in goal displacement as well as in screening and ‘creaming’ practices, which have been well documented in a wide range of policy areas such as employment and workforce development (Bell & Orr, 2002; Rees et al., 2014), education (Lavertu, 2016), or health (Lilford et al., 2004). Certain groups can also use published data without the necessary understanding of the information or focusing on particular indicators to put pressure on governments to respond to their narrower agendas (Lavertu, 2016).
Ideas about how power shapes data can be traced back, at least, to Michel Foucault's development of Jeremy Bentham's concept of the panopticon (Foucault, 1977). Other authors like Scott (1998) have described how, across history, those holding power positions have curtailed individual liberties through classification, quantification, and control techniques. Some scholars have identified three main consequences of power asymmetries with regards to data: increasing discrimination of the less powerful, increasing inequalities in the access to the benefits produced by the data, and increasing surveillance and vulnerabilities to privacy (Taylor, 2017). These risks show that the generation, analysis, and publication of data do not happen in a vacuum. The power relationships that define the reality upon which data are used will influence whether their potential benefits are achieved or not (Meijer, 2018). For example, when property ownership data were published in Bangalore, more educated and richer people used the newly available information to seize land from poorer people with tenuous legal claims on their properties (Benjamin & Raman, 2011). Constant attention to these power dynamics is key to identify and prevent or mitigate these harmful consequences.
Our framework alone is unable to respond to key questions posed by these debates, as well as other dilemmas that the literature on smart governance models or works taking a socio-technical approach have surfaced. Some of these revolve around the applicability of the framework across organizational structures and contexts. Others highlight the need for thinking about what kind of decisions are taken with data and by whom (beyond the local government actors that are the focus of this article). We acknowledge this limitation and recognize that our framework is rooted in particular contextual settings and disciplinary concerns. We leave it for future researchers to explore these puzzles, hopeful that our framework will help open the rich dialogue across multiple disciplines that has been advocated by scholars taking stock of three decades of digital transformation in local governments (Gasco-Hernandez, 2024).
Conclusion
Understanding how to use data to address public problems is crucial for making local governments more effective (in a context of urgent and complex challenges), efficient (in a context of constrained resources), equitable (in a context of social inequality), and accountable (in a context of low public trust). The increasing use of data by local governments notwithstanding, significant untapped potential remains for employing data in ways that could dramatically improve city governments’ problem-solving practices. Investigating this potential through an extensive review of various literatures and research and engagement with local governments has yielded a broader and, at the same time, more granular conceptualization of data uses. This article has also highlighted the substantial risks that more data-informed government presents. Our hope is that public leaders and professionals seeking to make city governments more data-informed, and researchers studying data-informed local governments, will find the proposed framework's integration of functional, temporal, and developmental dimensions an actionable tool for pursuing public goals while remaining attentive to potential harms.
Footnotes
Funding
This work was supported by the Bloomberg Harvard City Leadership Initiative, which is funded by Bloomberg Philanthropies.
Declaration of Conflicting Interests
The author(s) declared no potential conflicts of interest with respect to the research, authorship, and/or publication of this article.
Notes
Author Biographies
Appendix A
Appendix B
Levels of Development of the Eight Data Uses.
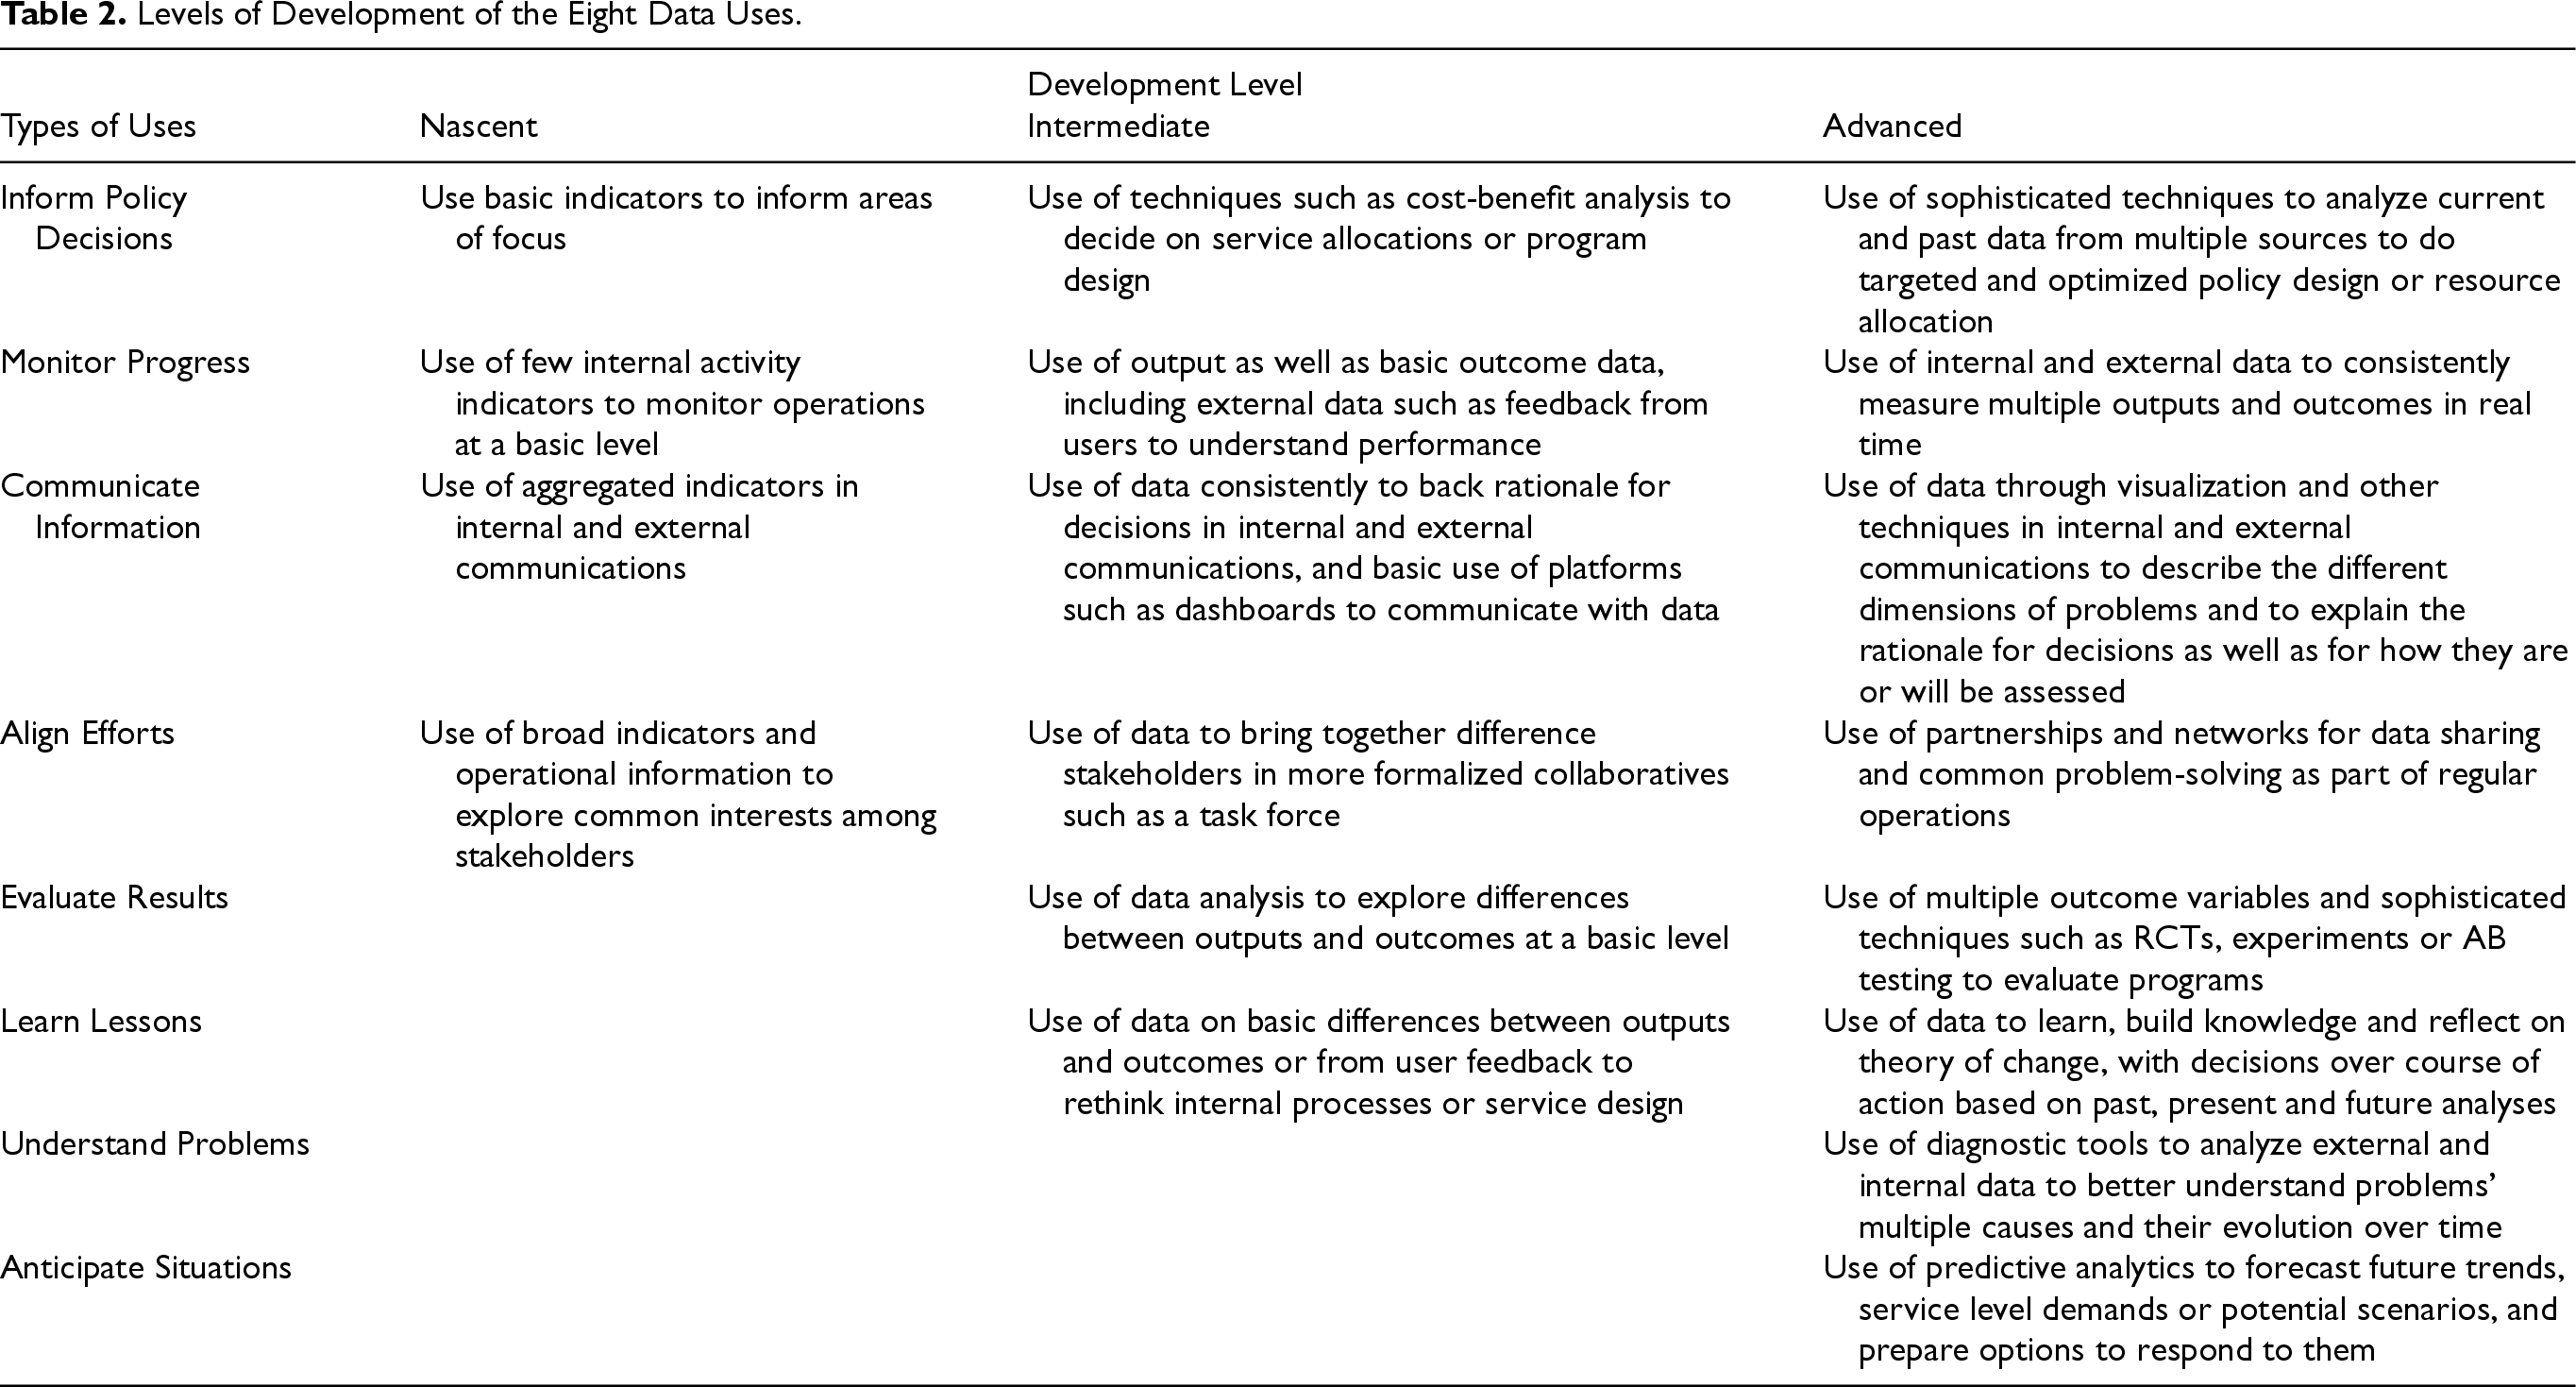
| Development Level | |||
|---|---|---|---|
| Types of Uses | Nascent | Intermediate | Advanced |
| Inform Policy Decisions | Use basic indicators to inform areas of focus | Use of techniques such as cost-benefit analysis to decide on service allocations or program design | Use of sophisticated techniques to analyze current and past data from multiple sources to do targeted and optimized policy design or resource allocation |
| Monitor Progress | Use of few internal activity indicators to monitor operations at a basic level | Use of output as well as basic outcome data, including external data such as feedback from users to understand performance | Use of internal and external data to consistently measure multiple outputs and outcomes in real time |
| Communicate Information | Use of aggregated indicators in internal and external communications | Use of data consistently to back rationale for decisions in internal and external communications, and basic use of platforms such as dashboards to communicate with data | Use of data through visualization and other techniques in internal and external communications to describe the different dimensions of problems and to explain the rationale for decisions as well as for how they are or will be assessed |
| Align Efforts | Use of broad indicators and operational information to explore common interests among stakeholders | Use of data to bring together difference stakeholders in more formalized collaboratives such as a task force | Use of partnerships and networks for data sharing and common problem-solving as part of regular operations |
| Evaluate Results | Use of data analysis to explore differences between outputs and outcomes at a basic level | Use of multiple outcome variables and sophisticated techniques such as RCTs, experiments or AB testing to evaluate programs | |
| Learn Lessons | Use of data on basic differences between outputs and outcomes or from user feedback to rethink internal processes or service design | Use of data to learn, build knowledge and reflect on theory of change, with decisions over course of action based on past, present and future analyses | |
| Understand Problems | Use of diagnostic tools to analyze external and internal data to better understand problems’ multiple causes and their evolution over time | ||
| Anticipate Situations | Use of predictive analytics to forecast future trends, service level demands or potential scenarios, and prepare options to respond to them |