
Abstract
Adolescence has been identified as a critical developmental period predicting adult health. Despite this knowledge, few studies have examined the relationship between parenting/family variables occurring during adolescence and future food consumption patterns. The present study examined the predictive nature of family dinners and parent control over food in relation to longitudinal fast-food consumption beginning in adolescence and across the transition into adulthood. Data came from The National Longitudinal Study of Adolescent to Adult Health. A group-based modeling technique identified distinct participant groups with similar trajectories of fast-food consumption across waves II-IV (1994-2008). Parent control over food and family dinner frequency were used as predictors of group membership in the final models. Four separate trajectories of fast-food consumption frequency emerged. Both parent control over food and family dinner frequency during adolescence were related to trajectory group membership, acting as protective factors against spikes in fast-food consumption. The observed relationships highlight key areas for positive change in parental involvement in children’s food choices and future health interventions to decrease fast-food consumption during this critical developmental period.
“Greater control decreased the odds of a participant having a spike in fast-food consumption during the ages of 18-26 by 33%.”
Despite promising trends of improvement, fast-food’s overall nutritional content remains poor 1 and frequency of consumption is associated with both poorer diet quality as well as many common health impairments including cardiovascular disease, metabolic syndrome, diabetes, and overweight and obesity.2-4 Neighborhood features play a significant role in predicting fast-food consumption5,6 and individuals living in areas with higher density of fast-food outlets and higher depravation are more likely to have heightened fast-food consumption than those living in other areas.5,6 Other known risk factors related to fast-food consumption frequency include family consumption of fast-food, targeted fast-food advertising towards children, social pressures, and low socioeconomic status.7,8 Preliminary longitudinal research also suggests familial influences, such as changes in the home food environment and parental report of serving vegetables at dinner, predict changes in fast-food consumption and dietary intake, respectively.9,10 However, additional longitudinal research regarding family environmental factors and adolescent fast-food consumption is needed.
Understanding familial influences on childhood diet and weight gain is important in identifying adolescents at risk for negative health outcomes.11,12 Often, parent exercise and diet have great influence on the family environment, significantly impacting immediate and future health behaviors in children.13-15 In nuclear families, having working parents is associated with increased fast-food consumption as parents have less time to meal prep. 16 Other specific family factors implicated in predicting adolescent diet behaviors include family meal frequency (i.e., frequency of meals in which the parent and adolescent eat together) and parent control over food. For example, greater family meal frequency is significantly correlated with improved diet quality (i.e., increased consumption of fruits and vegetables) and may also serve as a protective factor against binge eating and excessive weight loss.17-20
Conversely, while parents often seek to control adolescent food consumption in an effort to protect their children, this behavior may not always have the desired effect. 21 Parent control over food can predict better nutritional choices and increased nutritional knowledge in children.22,23 For example, more frequent monitoring of junk food consumption is associated with higher vegetable intake. 24 However, excess parental control may predict increased eating despite the absence of hunger, engagement in disinhibited eating, and poorer dietary choices.21,25 For example, higher overall parental control over eating is associated with lesser fruit and vegetable intake. 26 Notably, the overall effects of parent control on child eating behaviors may also vary based on the level of control, child gender, parent weight status, and the quality of the parent–child relationship.21,27,28 However, while these effects have been observed in many cross-sectional studies and research in children and adolescents, few studies have looked at the longitudinal impacts of family meal frequency and parent control over food in the transition from adolescence into adulthood.17,19,21
The present study sought to assess trajectories of fast-food consumption frequency across the transition from adolescence into adulthood as they relate to family dinner frequency and parent control over food during adolescence. We predicted that lower parent control over food during adolescence would lead to more consistent trends in fast-food consumption while heightened control may lead to greater fluctuations in consumption across the transition from adolescence to adulthood. In regard to family dinner frequency, we predicted that increased family dinner frequency in adolescence would predict lower longitudinal fast-food consumption frequency across the transition from adolescence to adulthood. Covariates of interest for these analyses included age, gender, neighborhood type, family health history, socioeconomic status (SES), BMI-for-age percentile, and parent–child relationship quality.
Materials and Methods
The data for this project were retrieved from the National Longitudinal Study of Adolescent to Adult Health (ADD Health) database, a nationally representative dataset collected with the goal of furthering our understanding of U.S. adolescent health. 29 Initial data collection for this study involved in-home and in-school interviews administered to U.S. students at over 80 different high schools throughout the country. In-home interviews were continued in subsequent waves of data collection. This study focuses on ADD Health data from the first 4 waves of data collection, which spanned from 1995 to 2008. All analyses excluded participants who were 21 or older at wave I. All data were weighted to be nationally representative based on U.S. Census Bureau population estimates. 30
Measures
Demographics
At wave I, adolescent participants provided self-reports of gender, birth date, and ethnicity. Parents provided self-reports of their total household income before taxes. Income was coded on a 12-point Likert scale ranging from “less than US$5000” to “US$150,000 or more” and used as a proxy for SES.
Fast-Food Consumption Frequency
In waves II–IV, participants provided self-report of fast-food consumption frequency. In waves II and III participants responded to the following item: “In the last 7 days, on how many days did you eat at a fast-food type place—McDonald’s, Kentucky Fried Chicken, Pizza Hut, Taco Bell, etc.?” In wave IV, participants were asked how many “times in the past week did you eat at a fast-food type place?” For the trajectory analyses, fast-food consumption at wave IV was capped at 21, allowing for the possibility of 3 fast-food meals each day. Overall, this impacted scores for .21% of our sample. Although the wave IV fast-food consumption question was measured on a larger scale than other waves, the inclusion of fast-food consumption frequency at wave IV in the trajectories allowed for an extension of the longitudinal models, increasing our understanding of how fast-food consumption changes across the transition from adolescence to adulthood. Further, the differing scales had no effect on the relative patterns of fast-food consumption between trajectory groups at each wave, which is the primary characteristic of interest regarding fast-food consumption for this study.
BMI-for-Age Percentile
In wave I, participants provided self-reports of height and weight. BMI-for-age percentile was calculated using the Centers for Disease Control and Prevention’s Children’s BMI Group Calculator—U.S. Version. 31
Family Dinners
The number of weekly family dinners was assessed in the adolescent questionnaire at wave I with the following self-report item: “On how many of the past 7 days was at least one of your parents in the room with you while you ate your evening meal?” Responses were coded based on a 0-7 count.
Parent Control Over Food
Parent control over food was assessed in the adolescent questionnaire at wave I with the following self-report item: “Do your parents let you make your own decisions about what you eat?” to which adolescents provided “yes/no” responses.
Family Health History
In wave I, adolescent participants provided self-reports of general health using the following item: “In general, how is your health?” This item was scored on a 1-5 scale which was reverse scored resulting in a range from 1 (poor) to 5 (excellent). Parents in wave I provided information regarding mother, father, and adolescent diabetes status with dichotomous “yes/no” responses.
Parent–Child Relationship Quality
Eight total questions (five for mom and three for dad) including items such as, “Do you agree or disagree with the following statement? You are satisfied with the way your mother and you communicate with each other?” and “Do you agree or disagree with the following statement? Most of the time, your father is warm and loving toward you?” were used in data collection at wave I to assess parent–child relationship quality. These items were scored using a 5-point Likert scale, reverse coded for 1 (strongly disagree) through 5 (strongly agree). Separate averages for maternal and paternal relationship quality were calculated from these items and then averaged to compute overall parent–child relationship quality.
Neighborhood Type
In wave I, interviewers were asked to categorize the “immediate area or street (one block, both sides)” where the participant lived. Category options were as follows: rural, suburban, urban—residential only, 3 or more commercial properties—mostly retail, 3 or more commercial properties—mostly wholesale or industrial, or other.
Data Analysis
A group-based modeling technique estimated regression models for each participant’s trajectory of fast-food consumption frequency over waves II, III, and IV.32,33 Based on these models, maximum likelihood estimations were used to determine distinct, homogenous participant groups with similar trajectories across the three waves. These estimates accounted for both the probability of an individual’s group membership and the probability of the observed data given this group membership. 34 The planned number of groups was initially unrestricted and stepwise procedures considering linear and quadratic trajectory components were used to determine the best-fit model for the data. Individuals who had complete data for fast-food consumption at all time points were investigated as the primary subsample of interest; however, all individuals within the sample were included in the analyses to allow for use of survey weights. Only data for the primary analyses of interest are reported. All analyses were conducted using software, Version 9.4 of the SAS System for Windows, Copyright © 2016 SAS Institute Inc. Cary, NC, USA. Trajectory analyses were conducted in SAS using PROC TRAJ.32,33
Multicollinearity between predictor variables and the final outcome variables was assessed prior to final analyses. No issues with normality were found. As it was necessary to use the full sample of participants when applying survey weights within the analyses, the data was divided into two subsamples which were analyzed in a parallel fashion. The first subsample included individuals with complete data while individuals with missing data for categorical variables were treated as members of a separate, non-missing subsample. This allowed for the application of nationally representative sample weights, designed for use on the whole sample, in final analyses, while allowing researchers to look only at outcomes of individuals with complete data for the variables of interest.
The fast-food consumption frequency groups were used as outcomes in two separate multinomial survey weighted logistic regressions assessing the impacts of wave I family dinner frequency and parent control over fast-food consumption frequency in waves II-IV. Covariates for these analyses included wave I age, gender, neighborhood type, family health history, SES, BMI-for-age percentile, and parent–child relationship quality as these factors had the potential to impact the relationship between family factors and child/adolescent eating behaviors.
Results
Data collection began with 20,745 adolescents (grades 7-12 and ages 11-21) and their parents. The study followed these students through their transition into adulthood with response rates greater than 77% at each wave. In wave II there were 14,783 respondents ages 11-23 and in wave III there were 15,197 respondents ages 18-28. In wave IV, study respondents ranged in age from 24-34 years old and included 15,701 of the original respondents. The present study focuses on the sample of 9421 participants (45.42% male; 63.43% White, 21.00% Black, and 6.61% Asian or Pacific Islander) who provided data regarding fast-food consumption frequency in all of waves II-IV.
Stepwise procedures identified 4 statistically unique trajectory groups of fast-food consumption for waves II-IV (Figure 1). A majority of respondents (73.8%) fell into group one, “low,” exhibiting the overall lowest consumption across all waves with slight decreases in fast-food consumption from wave II to wave IV. The next largest group, “spike,” comprised 15.2% of our sample and was characterized by a spike in fast-food consumption at wave III, followed by reduced consumption at wave IV. The third group, “raised,” included 9.8% of our sample and exhibited a mild increase in fast-food consumption from wave II to wave III, but ended with the second highest fast-food consumption at wave IV as compared to other groups. The final group, “max” (1.3% of the sample), followed a similar trajectory as group 3 from wave II to wave III. However, the fast-food consumption frequency of individuals in “max” at wave IV was markedly higher than that of the individuals in other groups. Due to the change in wording for the wave IV fast-food consumption question, it is unclear if increases in consumption from wave III to IV are due to actual increases in fast-food consumption frequency. However, it is clear that groups 3 and 4 had greater consumption at wave IV as compared to the other groups. Further, group 2’s decrease in fast-food consumption frequency can be interpreted as a true decline, as this group moved from an average fast-food consumption frequency of nearly 6 days per week to an average of approximately only 3 times per week. See Table 1 for group-based descriptive information. Group-based fast-food consumption trends. **Note: Wave II and III fast-food consumption is represented as days per week. Wave IV fast-food consumption is represented as times per week. Participant Characteristics by Group.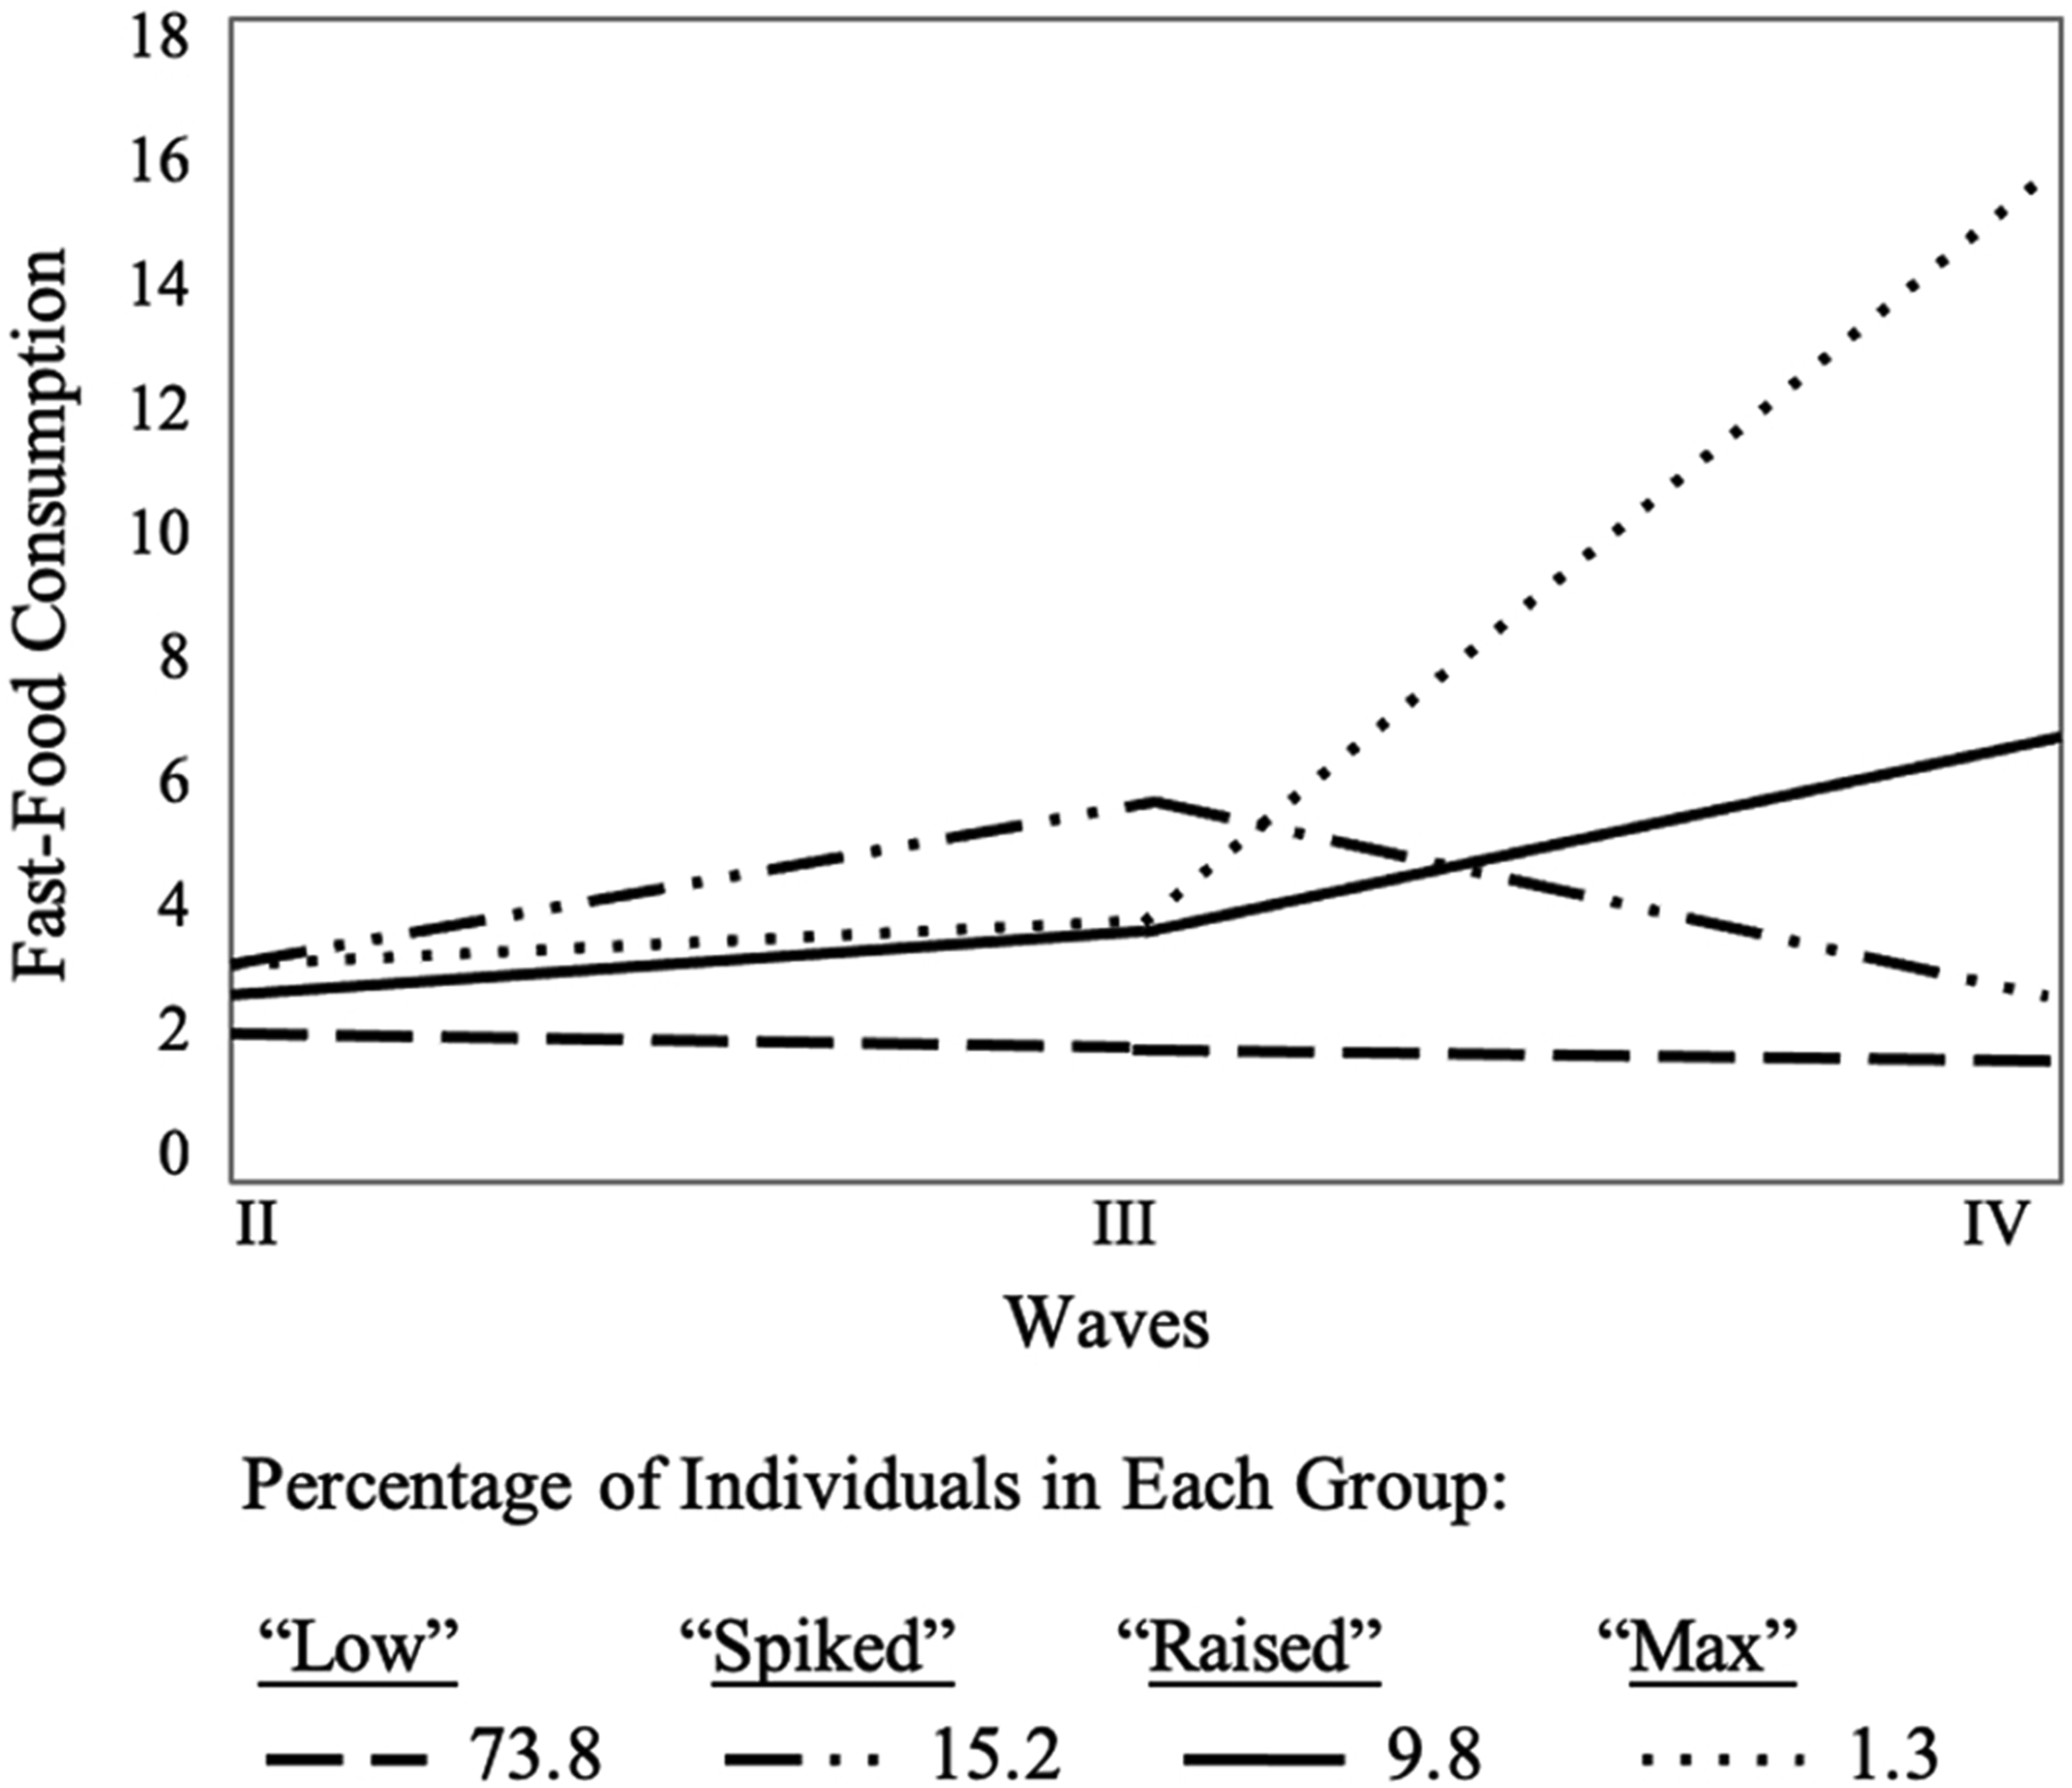

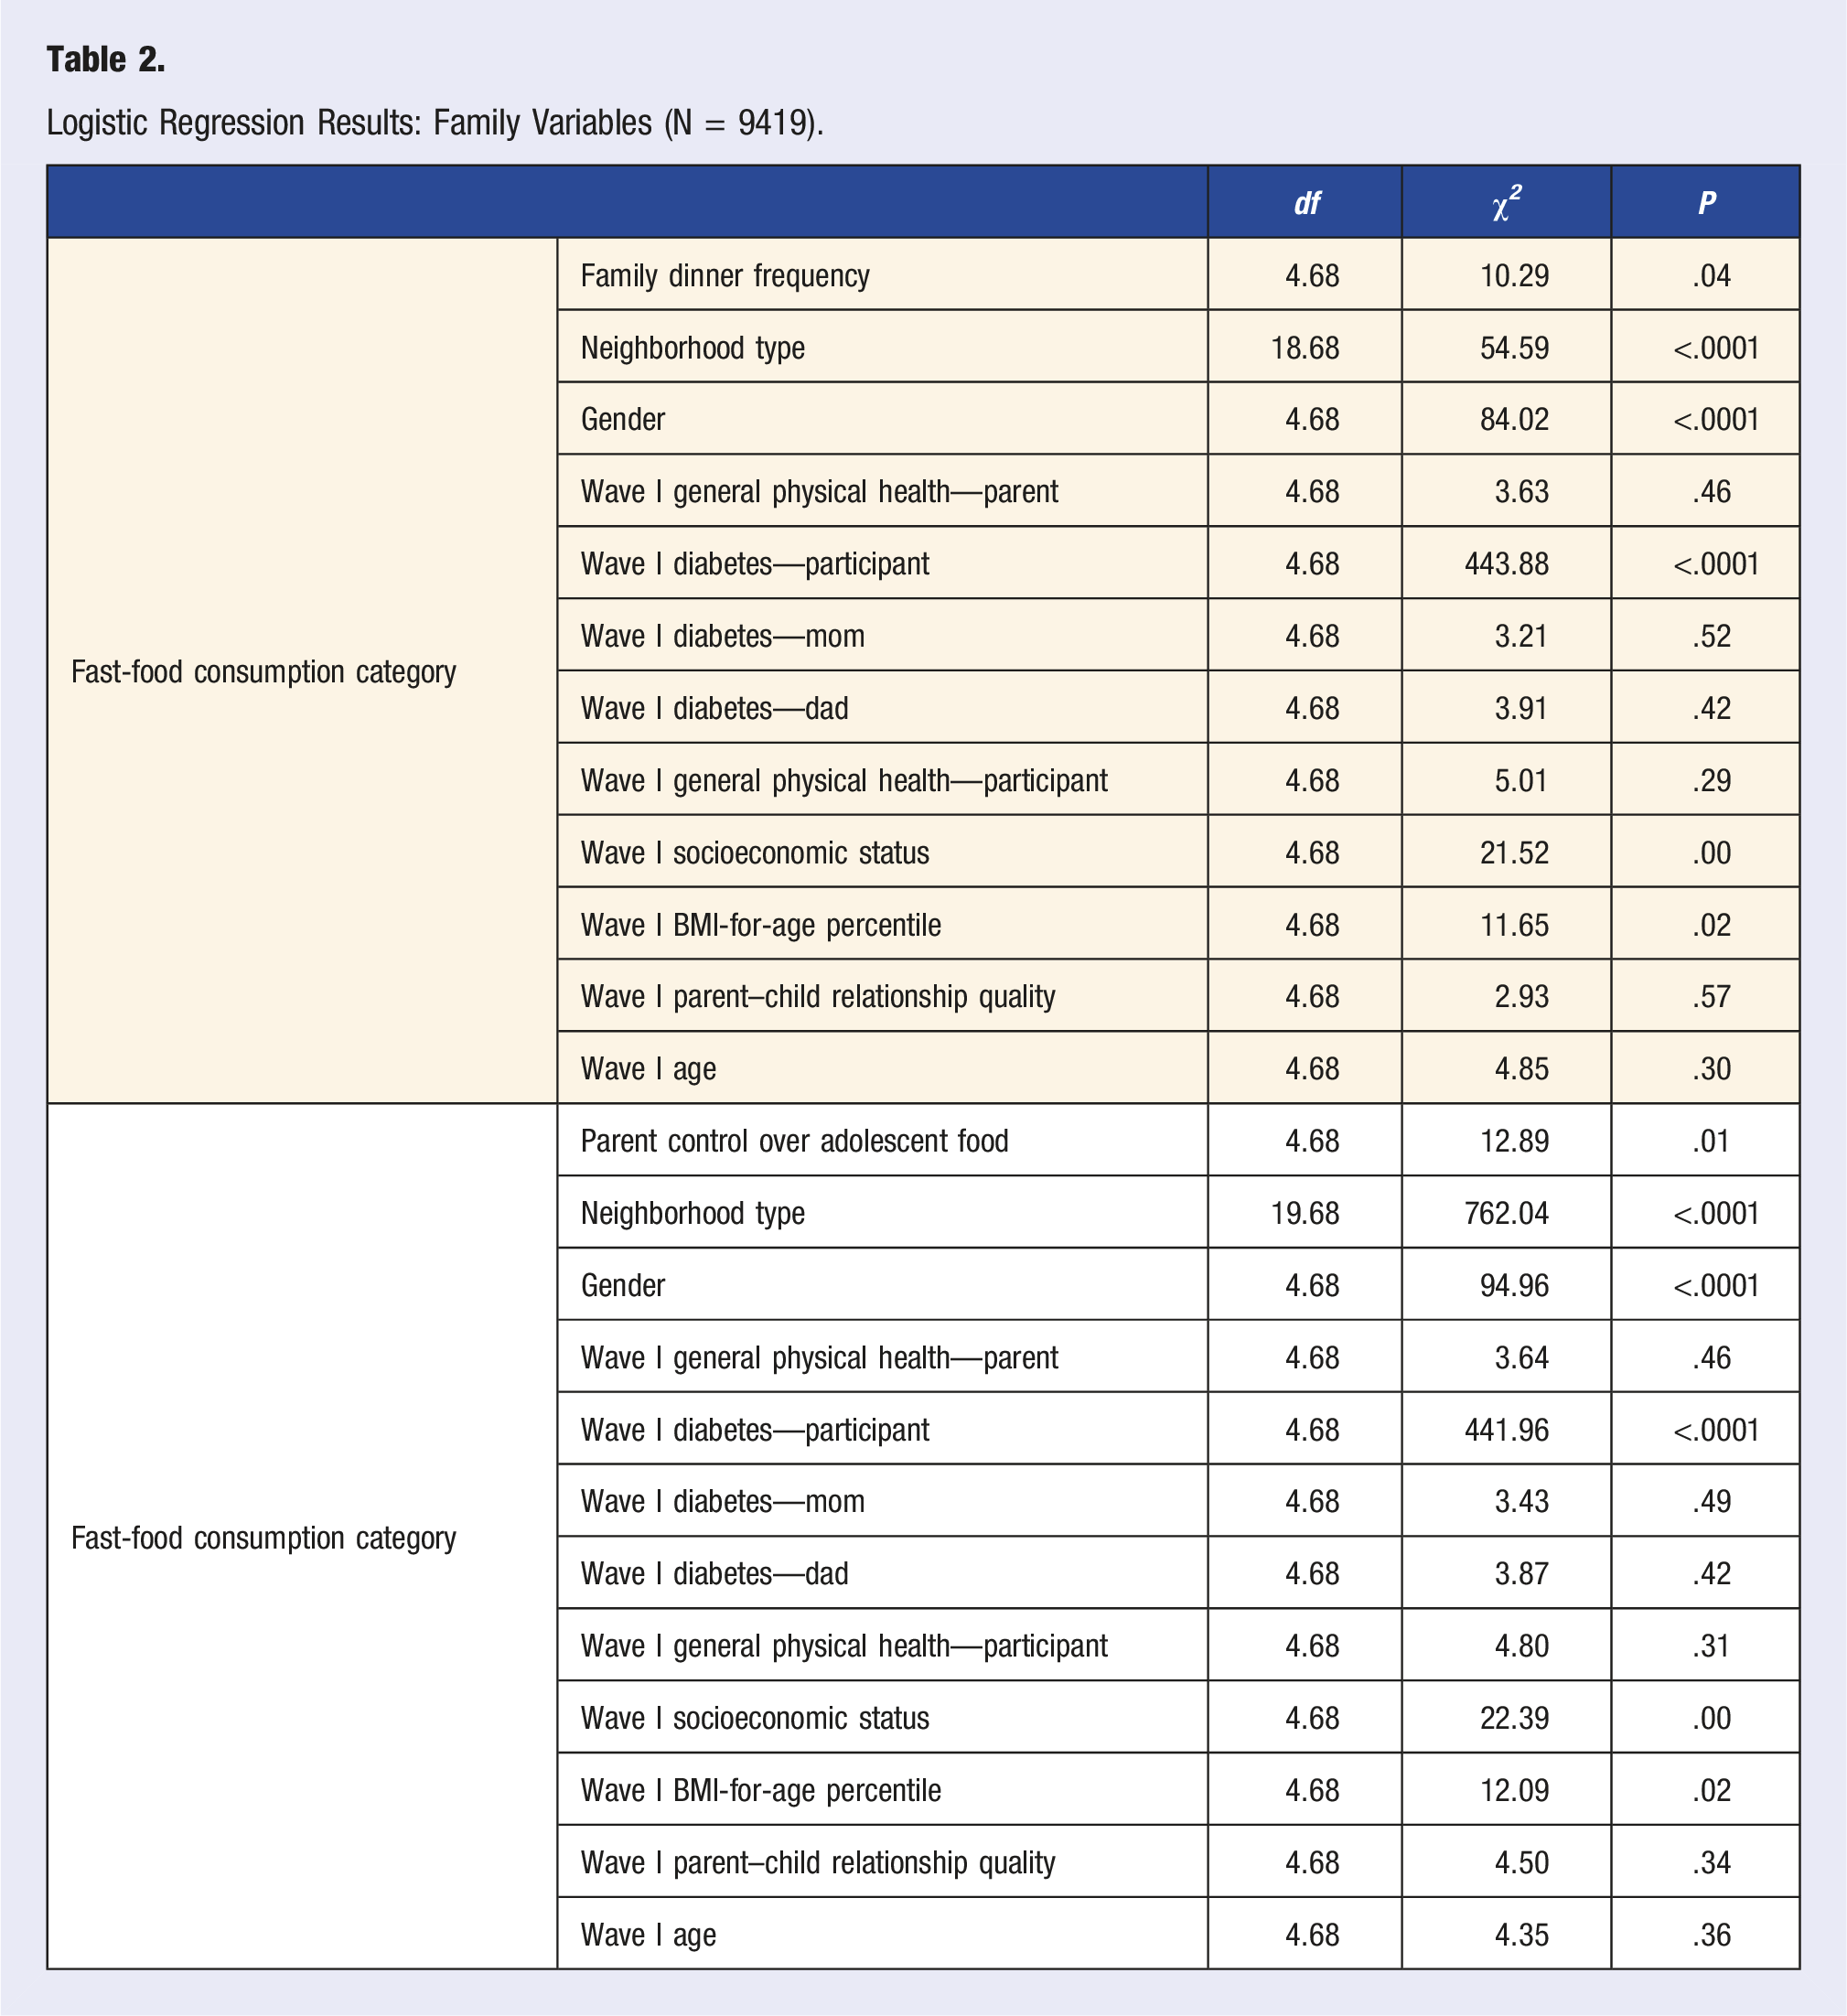
Logistic Regression Results: Family Variables (N = 9419).
Family Dinner Frequency Follow-Up Tests (N = 9419).
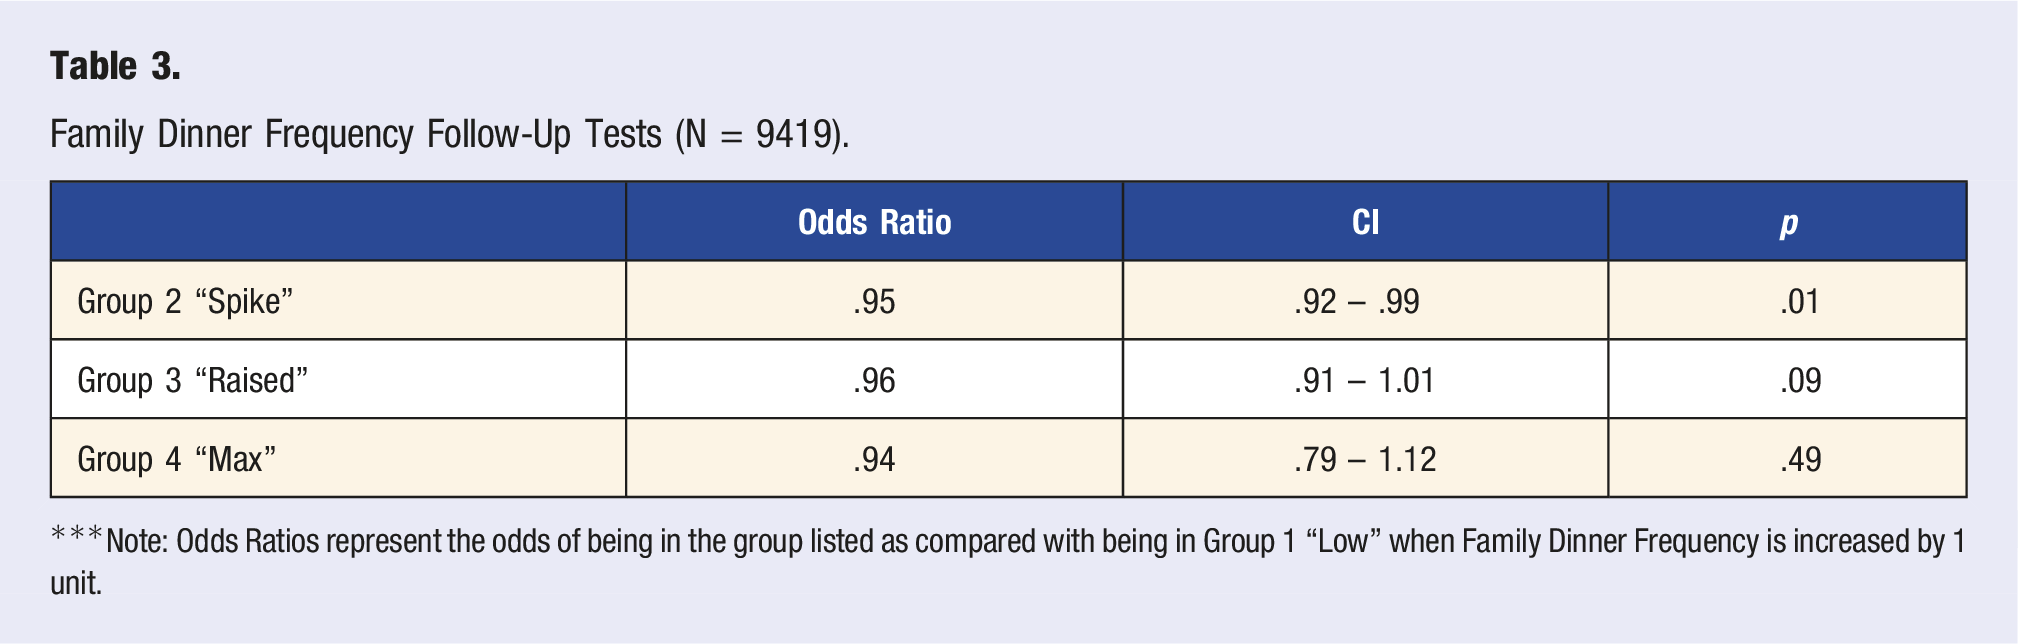
***Note: Odds Ratios represent the odds of being in the group listed as compared with being in Group 1 “Low” when Family Dinner Frequency is increased by 1 unit.
Parent Control Over Food Choice Follow-Up Tests (N = 9419).
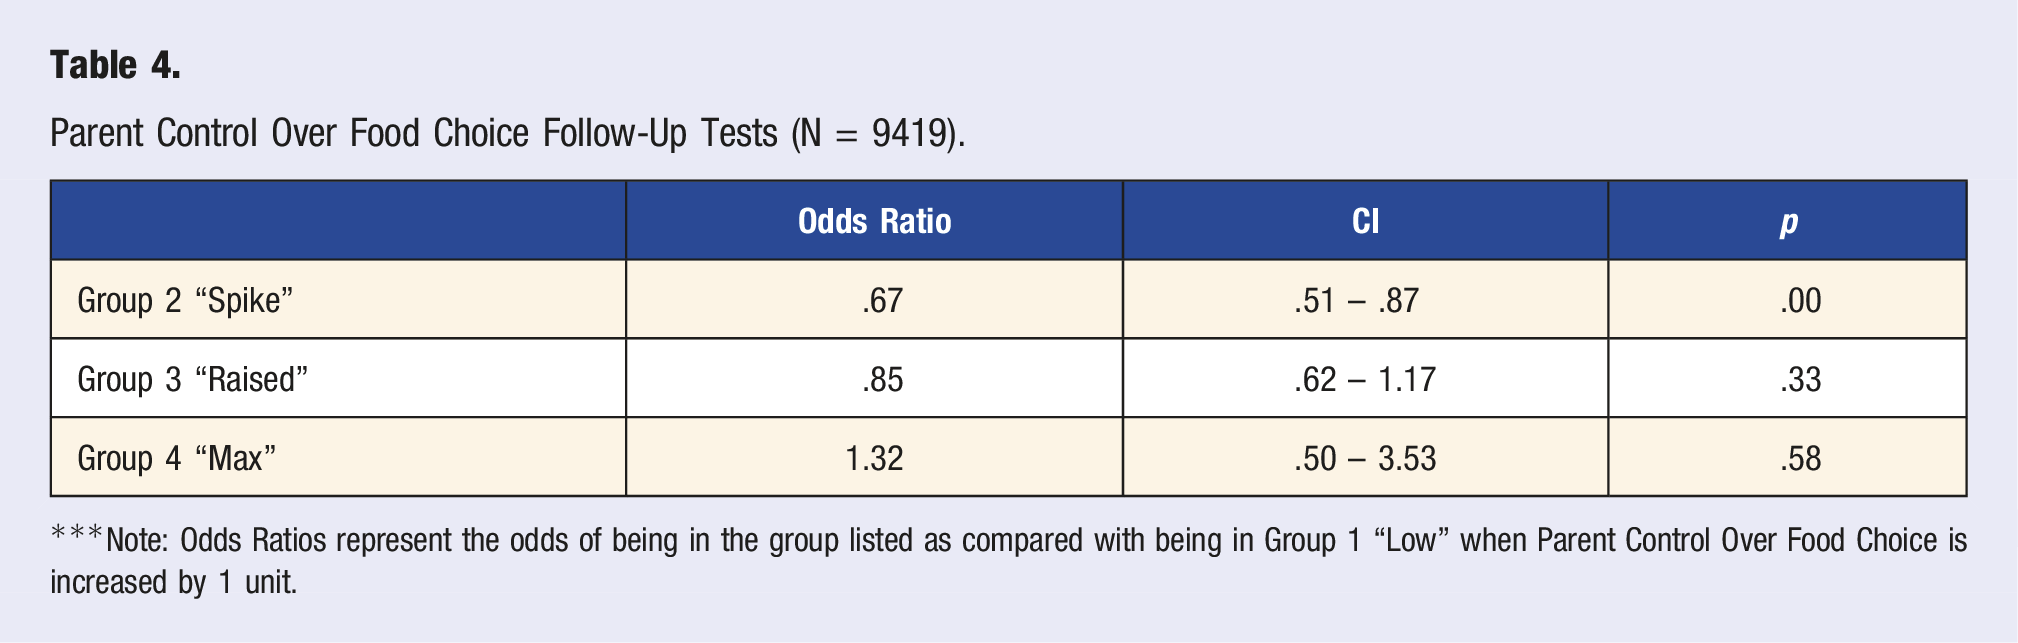
***Note: Odds Ratios represent the odds of being in the group listed as compared with being in Group 1 “Low” when Parent Control Over Food Choice is increased by 1 unit.
Variance inflation factors indicated no issues with multicollinearity in any of the analyses (VIFmax = 1.19). In regards to missingness, 36 or .004% of cases had missing data for parent control over food choice. There were no cases with missing data for family dinner frequency. Notably, across both models (parent control over food choice and family dinner frequency), neighborhood type emerged as a highly significant predictor of trajectory group membership (parent control over food model: χ2 = 762.04, P < .0001; family dinner frequency model: F = 54.59, P < .0001; Table 2). However, removal of this variable from the models of interest did not alter the outcomes.
Discussion
As predicted, increased family dinner frequency at wave I was a protective factor against spikes in unhealthy fast-food consumption at wave III, a critical developmental period when many participants would be transitioning out of their parents’ homes and establishing their own independent eating patterns (ages 18-26). These results carry strong clinical meaningfulness due to the 5% decrease in odds for membership in group 2, “spike,” verses group 1, “low,” per each additional family dinner. This difference in odds indicated that if a family increased weekly dinners from 1 to 4 at wave I, there would be a 15% decrease in odds that their adolescent would exhibit a spike in fast-food intake frequency at wave III. Thus, this finding expands upon past cross-sectional research, which has shown the positive effects of increased family dinner frequency (e.g., improved consumption of fruits, vegetables, dairy products, energy, protein, iron, fiber, and calcium) during childhood and adolescence, demonstrating these effects continue in the transition into adulthood.19,20 Unfortunately, these effects may be weakened over time. This is evidenced by the lack of significant differences between groups 1, 3, and 4, which had more similar consumption at wave III and did not become strongly differentiated until wave IV. Notably, as individuals age, there are several other factors which may gain stronger influence over food choices including increased variation in housing characteristics (i.e., living with roommates, spouses), work schedules, etc. Thus, while family dinner frequency is an important factor in understanding adolescent dietary patterns, additional factors must be considered as individuals mature into young adulthood.
Our results also demonstrate a protective effect of parent control over adolescent food choice. Greater control decreased the odds of a participant having a spike in fast-food consumption during the ages of 18-26 by 33%. This supports many parents’ underlying motivation to exert control over their children’s food choices, as parent control over food is often driven by parents’ desire to protect their child. 21 While past research in this area is mixed, several factors may have influenced our results.21-23,25 Parents who are viewed by their children as strict but also warm, responsive, and involved often have children and adolescents who report better overall diet quality. 27 Thus, controlling for parent–child relationship quality may partially explain the protective effects found in our study. Further, while past research demonstrating the negative effects of parent control over food has focused primarily on younger children, the older age of participants in this study and related advancements in cognitive development, may have allowed for better understanding of the benefits associated with limiting certain foods.
Notably, across all models, neighborhood type emerged as a highly significant predictor of trajectory group membership. This supports past research demonstrating an association between an individual’s broader environment (i.e., neighborhood features) and their fast-food consumption.5,6 Overall, past research has shown that individuals living in areas with higher density of fast-food outlets and higher depravation (e.g., lower SES and income) are more likely to have heightened fast-food consumption than those living in other areas.5,6
There are several implications of these results, which build on past cross-sectional studies and research in children and adolescents, highlighting the longitudinal and protective effects of increased family meal frequency and parent control over food choices across the transition from adolescence to adulthood.17,19,21 Past studies have highlighted parenting interventions through primary care providers as a cost effective and efficient means to impact parent knowledge and child outcomes.35,36 Thus, it may be valuable for pediatricians to discuss the benefits of parent control over adolescent food choice and family dinner frequency with parents. Dissemination of this information through parenting classes, family, or school-based counseling and nutritional interventions, pamphlets, and other strategies may also serve as effective intervention tactics to improve adolescents’ overall diet quality and decrease fast-food consumption frequency in the transition into adulthood.37-39 While several family characteristics may make it difficult for parents to independently enact increases in family dinner frequency or parent control over food, investigation of additional strategies (i.e., family dinners with grandparents, an alternating schedule of family dinners at friends’ houses, etc.) may allow for wider dissemination. Additionally, the association between neighborhood type and fast-food consumption highlights another potential area for intervention. Increasing access to more diverse food options through programs such as the WIC program or community meal programs may substantially reduce fast-food consumption and improve long term health outcomes. However, as neighborhood characteristics remain influential in predicting fast-food consumption trends, they are important to consider when studying fast-food consumption and developing nutrition interventions targeting fast-food consumption. Notably, the findings related to family diner frequency, parent control over adolescent food choices, and fast-food consumption should be replicated and expanded upon to assess possible moderators within these relationships and further tailor interventions.
Our study has several strengths. First, the study uses family variables to predict trajectories of fast-food consumption frequency across a novel period of development, the transition from adolescence into adulthood. Overall, past research regarding parent control over food has focused primarily on younger children, and the majority of research regarding family meal or dinner frequency has been cross-sectional.17,19,21 Thus, our study is important as it assesses the longitudinal effects of these variables as adolescents transition out of the home and begin more autonomous food consumption. Other strengths include the use of a longitudinal data set and a nationally representative sample, which allow for increased generalizability of the results.
There are limitations that should also be considered when interpreting our findings. While the importance of understanding the relationship between family factors and fast-food consumption frequency is underscored by past research demonstrating relationships between fast-food consumption frequency and many negative health outcomes including metabolic syndrome, diabetes, and overweight and obesity, this study was unable to expand on the type of fast-food consumed or nutritional value of what was ordered due to the phrasing of the fast-food consumption questions. 2 Further, while any decrease from waves III-IV can be interpreted as a true decline in fast-food consumption frequency, increases between these waves must be interpreted with caution, as they may not represent a true increase in consumption if participants in waves II and III ate multiple fast-food meals per day. However, relative consumption trends between groups at each wave are well-defined, allowing for clear comparisons of group consumption at each wave. Another study limitation is that a majority of the study, including wave I BMI-for-age percentile, relied on self-report data, which may be subject to response bias. 34 Notably, the reliability of wave I BMI-for-age percentile was supported by its close correlation with BMI at wave III, which was calculated based on objective measurements. Regarding measurement validity, the family dinner frequency question only provided information regarding the presence or absence of a parent in the same room during the participants’ evening meal, not their level of involvement in the adolescents’ meal, which parent was present, or the type of food that was consumed. Similarly, parent control over food was assessed using a single dichotomous, self-report variable and did not consider specific information about parent food rules (e.g., limits for type, quantity, timing). While more research into these areas is needed, the above results are an important first step in understanding the longitudinal effects of family dinner frequency and parent control over food on adolescent food choices during the transition into adulthood. It should also be noted that data collection was completed 14 years ago and thus may not consider family factors unique to present day. However, the annual growth of the fast-food industry makes research and intervention related to the factors in this study even more critical for adolescent health. It is also important to note that while consumption of fast-food is linked to negative health outcomes including overweight and obesity, declines in fast-food consumption have not yet been linked to reductions in BMI. However, interventions related to the above findings would promote stable healthy eating patterns beyond weight-based goal setting and support overall nutritional goals for adolescents transitioning to adulthood.
This study outlines multiple pathways for future research. Overall, additional research addressing the above limitations is necessary to clarify the relationships between the family environment during adolescence and fast-food consumption across the transition from adolescence into adulthood. Research in this area should assess the possible moderating effects of child age and the parent–child relationship when assessing parent control over food. Additionally, research should evaluate the underlying factors that may impact the relationship between family dinner frequency and future fast-food consumption. Further research is also needed to investigate the efficacy of parenting interventions focused on parent control over food and family dinner frequency in predicting improved longitudinal health.
Overall, this study demonstrates how specific parenting practices (including family dinner frequency and parent control over food) may impact adolescents’ future fast-food consumption patterns. Replication of these findings and subsequent dissemination of this knowledge through intervention or other means could be important in reducing future health risks.
Footnotes
Acknowledgments
The authors thank the participants, the University of North Carolina’s Carolina Population Center, and the Eunice Kennedy Shriver National Institute of Child Health and Human Development for their support and efforts on behalf of data collection for this project. The views expressed are solely those of the authors and do not reflect the official positions of the outside funding or research agencies.
Declaration of Conflicting Interests
The author(s) declared no potential conflicts of interest with respect to the research, authorship, and/or publication of this article.
Funding
The author(s) disclosed receipt of the following financial support for the research, authorship, and/or publication of this article: This work was supported by the Division of Diabetes, Endocrinology, and Metabolic Diseases (K23DK106570).