
Abstract
The COVID pandemic provides a natural experiment examining how a 50–60% reduction in pedestrian activity might lead to a reduction in pedestrian deaths. We assessed whether the reduction in pedestrian deaths was proportional to a one-to-one matching presumed in statistics correlating mobility with fatality. The primary analysis examined New York (largest city in US), and the validation analysis examined Toronto (largest city in Canada). We identified pedestrian activity in each location from the Apple Mobility database, normalized to the baseline in January 2020. We calculated monthly pedestrian deaths from the Vision Zero database in each city with baseline data from 3 prior years. We found a large initial reduction in pedestrian deaths during the lockdown in New York that was transient and not statistically significant during the summer and autumn despite sustained reductions in pedestrian activity. Similarly, we found a large initial reduction in pedestrian deaths during the lockdown in Toronto that was transient and not sustained. Together, these data suggest the substantial reductions in pedestrian activity during the COVID pandemic have no simple correlation with pedestrian fatality counts in the same locations. An awareness of this finding emphasizes the role of unmeasured modifiable individual factors beyond pedestrian infrastructure or other structural contributors.
“...pedestrians should walk attentively as if their lives depend on it...”
What is Already Known
(1) traffic injuries are a global cause of death and disability; (2) these incidents reflect system factors and individual actions; (3) the COVID pandemic led to lockdowns marked by stay-at-home orders.
What this Study Adds
(1) widespread sustained reductions in pedestrian activity during the COVID pandemic can be measured with mobility tracking databases; (2) reductions in pedestrian activity can be quantified and analyzed for the largest city in the United States and in Canada; (3) reductions in pedestrian activity correlate with modest and inconsistent reductions in pedestrian deaths for each city.
Introduction
Pedestrian deaths are an important cause of worldwide mortality.1,2 For example, New York is the largest city in the US and accounts for ten pedestrian deaths during a typical month, equal to 14 per million population annually (below the national average of 20 per million annually). 3 For each pedestrian who dies, many others survive with major disabilities. 4 However, health gains from physical exercise are indisputable and walking is one of the most affordable, popular, versatile, and practical ways available. 5 Nearly all pedestrian deaths can be prevented by safety actions based on risk factors. 6
Risk factors for pedestrian deaths are difficult to study due to ambiguities in measuring fluctuating asynchronous community activity. Past studies tend to focus on stable infrastructure such as street layout, vehicle design, or roadside infractions (e.g., alcohol-impaired drivers or pedestrians). 7 Additional structural factors include population demographics, vehicle speeds, adverse weather, poor visibility, and personal distraction. 8 We tested whether the COVID lockdown (March 1 to June 30, 2020) contributed to decreased pedestrian deaths despite unchanged infrastructure and structural factors. 9
Methods
We identified pedestrian activity from the Apple Mobility database, normalized to the baseline in January 2020. 10 This database was introduced in January 2020 and made available worldwide to scientists interested in community mobility. 11 A strength of the database is the real-time, population-wide, non-intrusive surveillance information for estimating pedestrian activity. 12 Weaknesses of the database are that data track map requests (not direct activity) are not available for remote years (before 2020), do not include alternative search engines (e.g., Google), and have uncertain validity.13,14
We calculated monthly pedestrian deaths from the Vision Zero databases with baseline data from 3 prior years.15,16 These databases are available worldwide to scientists studying traffic injury. 17 A strength of the databases is in providing comprehensive data on individual pedestrian deaths (including all ages and genders). 18 Weaknesses of these databases are a lack of individual characteristics (thereby precluding detailed multivariable analysis), the infrequency of deaths at specific places (thereby requiring aggregation to large geographic units), and untested validity (reflecting police reports). 19
Results
As expected, we found a large 50–60% decline in pedestrian activity during the initial COVID lockdown. The decreased activity was abrupt in onset, profound in magnitude, and sustained in duration for New York city (Figure 1). In addition, the decreased pedestrian activity could also be replicated in a validation analysis of Canada’s largest city (Toronto). Interestingly, both cities returned to baseline activity during the summer of 2020 and showed a modest reduction of pedestrian activity during the autumn of 2020 (second wave of the COVID pandemic in both). Pedestrian activity and pedestrian deaths. Line graph of pedestrian activity and bar graph of pedestrian deaths for largest US city (New York) and largest Canadian city (Toronto). X-axis shows consecutive time in 2020 year. Y-axis shows pedestrian activity (measured as % relative to baseline) and pedestrian deaths (measured as monthly counts). Light blue denotes New York and dark red denotes Toronto (each measured as daily activity and monthly counts). Green line denotes 100% baseline activity in each city, and solid navy bar shows COVID lockdown from March through June. Results for pedestrian activity show decrease during lockdown, partial return during summer, and greater reductions in New York compared to Toronto. Results for pedestrian deaths show reduction in both cities during initial lockdown only.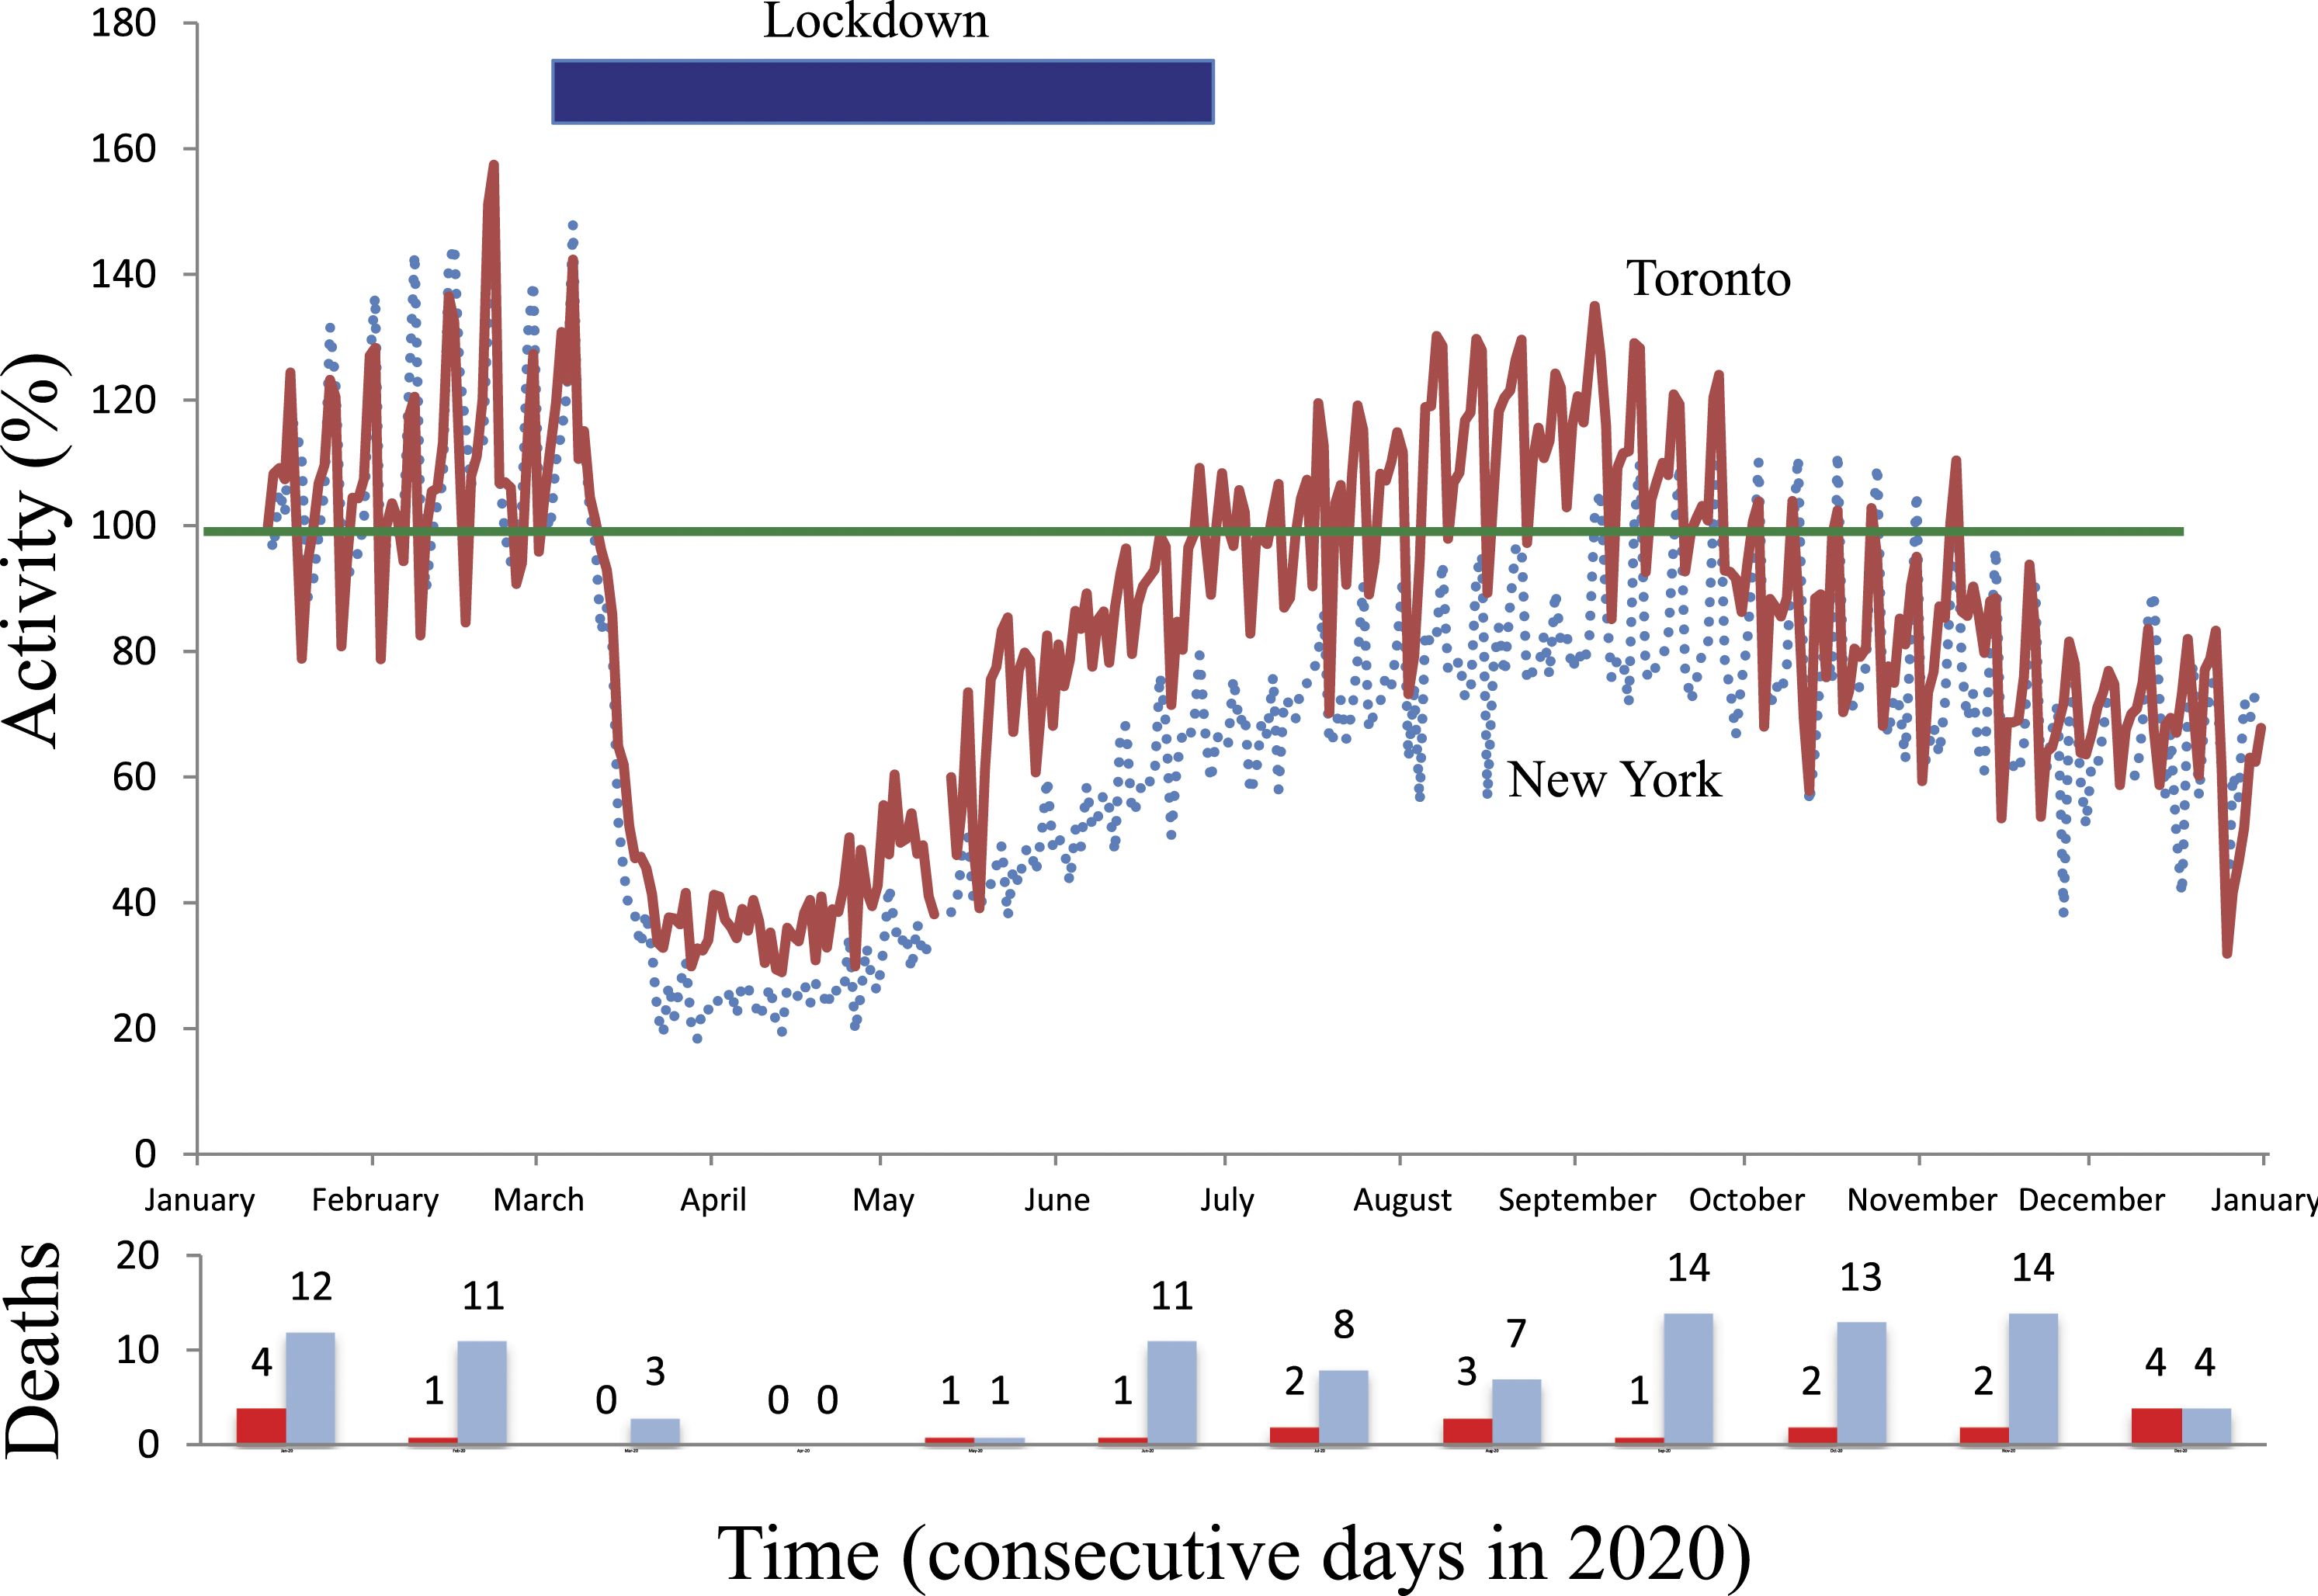
A total of 350 pedestrian deaths occurred in New York during the 3 baseline years, equal to 9.7 per month. A total of 15 deaths occurred during the lockdown, equal to 3.8 per month. The discrepancy suggested a 60% relative reduction in total pedestrian deaths (95% confidence interval 34 to 76, P < .001). The summer, however, was associated with ongoing reductions in activity and a marginal 1% increase in deaths (95% confidence interval −31 to 47). Similarly, the autumn was associated with further reductions in activity and a marginal 8% increase in deaths (95% confidence interval −25 to 55).
Analysis of Toronto confirmed the mismatch between pedestrian activity and pedestrian deaths. A total of 112 pedestrian deaths occurred in Toronto during the baseline years, equal to 3.1 per month. A total of 2 pedestrian deaths occurred during the lockdown, equal to .5 per month. The discrepancy suggested a 84% relative reduction in total pedestrian deaths despite relatively more modest reductions in pedestrian activity (95% confidence interval 30 to 94, P < .001). The summer and autumn were again associated with changes in pedestrian activity and no significant reductions in pedestrian deaths.
Discussion
These findings highlight the feasibility of measuring, quantifying, and misinterpreting pedestrian activity and deaths in large cities. In particular, the mismatch between mobility and mortality challenges the statistical fallacy of correlating traffic deaths with travel distances. 20 Instead, the contrast underscores that other unmeasured modifiable factors contribute substantially to pedestrian deaths. 21 Traffic enforcement, segregated pedestrian space, and other structural elements could contribute, yet a large off-setting increase in structural hazards during the summer and autumn of 2020 is implausible.
A limitation of our study is that results may be confined to the infrastructure and lockdown policies of New York and Toronto. Both cities are safety leaders with active public safety campaigns, modified stop signals for more pedestrian crossing time, high visibility pavement markings at crosswalks, and automatic traffic enforcement by red light cameras or photoradar. Both cities had prohibitions against large gatherings and stay-at-home policies for non-essential workers in the spring of 2020.22,23 Both cities also introduced selective road closures to promote social distancing and outdoor recreation in the summer of 2020. Future studies are needed to test for replication elsewhere.
A second limitation of our research is the unknown amount of traffic prevailing at each specific crash location. Aggregated data for the entire US, for example, suggest a 13% relative reduction comparing 2019 to 2020 in total vehicle miles traveled throughout the nation (3.259 trillion vs 2.829 trillion, respectively). 24 Aggregated US data also indicate a marginal increase comparing 2019 to 2020 in total pedestrian deaths (6205 vs 6,235, respectively). 25 These findings again exemplify the mismatch of activity with mortality and further suggest that a simple analysis of crude traffic data provides an insufficient explanation for real pedestrian risks.
A different explanation for the mismatch of pedestrian activity with mortality may be unmeasured elements of psychology. The COVID pandemic, in particular, was associated with widespread fear and safety messages. 26 In turn, heightened attention may have temporally spilled-over to staying vigilant at street crossings, avoiding public intoxication, selecting safe routes, following road rules, and countless other unmeasured actions. Pedestrian trepidation is a counterpoint to aggressive driving and an intriguing idea for more research (instead of limiting activity). 27 Public health guidelines advise regular exercise, and pedestrians should walk attentively as if their lives depend on it. 28
Footnotes
Acknowledgments
We thank Cindy Kao and Deva Thiruchelvam for helpful suggestions on specific points.
Declaration of Conflicting Interests
The author(s) declared the following potential conflicts of interest with respect to the research, authorship, and/or publication of this article: The funding organizations had no role in the design and conduct of the study; collection, management, analysis, and interpretation of the data; and preparation, review, or approval of the manuscript. All authors have no financial or personal relationships or affiliations that could influence the decisions and work on this manuscript.
Funding
The author(s) disclosed receipt of the following financial support for the research, authorship, and/or publication of this article: This project was supported by a Canada Research Chair in Medical Decision Sciences, grant number 001 and the Canadian Institutes of Health Research and Natural Sciences and Engineering Research Council of Canada. The views expressed are those of the authors and do not necessarily reflect the Ontario Ministry of Health.
Accountability
The lead author had full access to all the data in the study, takes responsibility for the integrity of the data, and is accountable for the accuracy of the analysis.