
Abstract
The aim was to examine the hydration status of adults working in different jobs at the beginning and end of a shift and their reported water intake. One hundred and fifty-six subjects (89 males, 67 females) were recruited from workplaces within the local area (students, teachers, security, office, firefighters, catering). A urine sample was obtained at the start and end of the shift and was analyzed for osmolality (Uosm), specific gravity (USG), and sodium and potassium concentrations. Euhydration was considered Uosm <700 mOsmol/kg or USG <1.020. At the end of the shift, subjects were asked to report all water intake from beverages during the shift. Females had lower Uosm than males at the start (656 [range, 85-970] vs 738 [range, 164-1090] mOsmol/kg) and end (461 [range, 105-1014] vs 642 [range, 130-1056] mOsmol/kg; P < .05) of their working day. Fifty-two percent of individuals who appeared hypohydrated at the start of the shift were also hypohydrated at the end. Reported water intake from beverages was greater in males compared with females (1.2 [range, 0.0-3.3] vs 0.7 [range, 0.0-2.0] L, respectively; P < .0001). In conclusion, a large proportion of subjects exhibited urine values indicating hypohydration, and many remained in a state of hypohydration at the end of the shift.
‘Increasing awareness of drinking and hydration status helped increase water consumption during the observed shift.’
Monitoring hydration in the workplace is important in terms of health and function and provides an indication of drinking behaviors. Previous studies examining hydration status in the workplace have focused on workers in hot and humid conditions performing physical activity1,2 and those wearing personal protective equipment.3,4 These studies have tended to focus on extreme situations and environmental conditions that may not be applicable to those who work in temperate conditions performing less strenuous activity without protective equipment. In many workplaces, environmental conditions are often controlled by air conditioning and heating systems, and many workers are seated at a desk for a large portion of the shift.
When hydration status has been examined in the workplace, many workers have arrived already dehydrated. 2 Brake and Bates 2 found that around 60% of underground miners reported to work in a dehydrated state and that hydration status did not improve over the course of the shift. With the majority of workers arriving already dehydrated, they would be required to consume extra water in addition to normal consumption to achieve a euhydrated state.
The reasons why individuals choose to drink or not to drink in certain scenarios can be assessed by considering drinking influences and access to beverages. Understanding this may help prevent hypohydration and possible subsequent impairment of performance. For example, anecdotal evidence from questionnaires has shown that individuals restrict water intake if toilet facilities are not available. 5 Limited access to toilet facilities (eg, when driving or when teaching a class) may affect the amount of water consumed during the shift and may contribute to dehydration.
Typically, euhydration is considered when urine specific gravity (USG) values are below 1.020 and urine osmolality (Uosm) is below 700 mOsmol/kg. 6 These values, outlined by Sawka et al 6 in the American College of Sports Medicine (ACSM) position stand, provide a guideline for self-assessment and were derived from previous studies.7,8 The guidelines provide an approximate classification of whether an individual is euhydrated but do not provide an indication of hyperhydration or the severity of dehydration.
Reduced habitual water intake has been associated with colon cancer 9 and cancer of the bladder. 10 In the workplace, particularly if water intake or access to beverages is restricted because of the type of work or facilities, workers may be at risk of experiencing these health issues.
In addition to maintenance of health, one of the main reasons for examining hydration status in the workplace is the decline in cognitive function that is associated with dehydration. The effect of dehydration on cognitive performance has been studied in a variety of situations; however, the conclusions vary.11,12 As part of a review, Lieberman 11 assessed the effect of water restriction alone on cognitive performance and decided that there was not enough evidence to provide a definitive conclusion. However, Grandjean and Grandjean 12 concluded that a body mass loss of greater than 2% caused by dehydration through water restriction, exercise, and/or heat can have a negative impact on cognitive performance. In the workplace, a reduction in cognitive performance may reduce quality of work, productivity, and decision making, thereby making workers ineffectual. Dehydration of between 2% and 4% body mass loss has been shown to reduce short-term memory, visual motor tracking, arithmetic efficiency, and attention 13 and to decrease perspective discrimination and psychomotor skills. 14 Studies examining the relationship between dehydration and cognitive performance have tended to elicit dehydration through exercise or heat and exercise,13,14 and therefore their results are not directly applicable to situations commonly experienced in many workplaces.
Assessing water intake behaviors during a shift and determining the hydration status of workers at the start and end of their shift may help identify those who are dehydrated and hyperhydrated and may reveal ways to prevent these conditions. Therefore, the primary aim of this study was to examine the hydration status of different work groups at the beginning and end of a shift (approximately 8 hours). A secondary aim was to examine the influences on water intake (eg, access to water, water cooler towers, breaks, access to toilet facilities, etc) and behaviors between the groups monitored and examine whether this could influence the observed hydration status.
Experimental Methods
Subjects
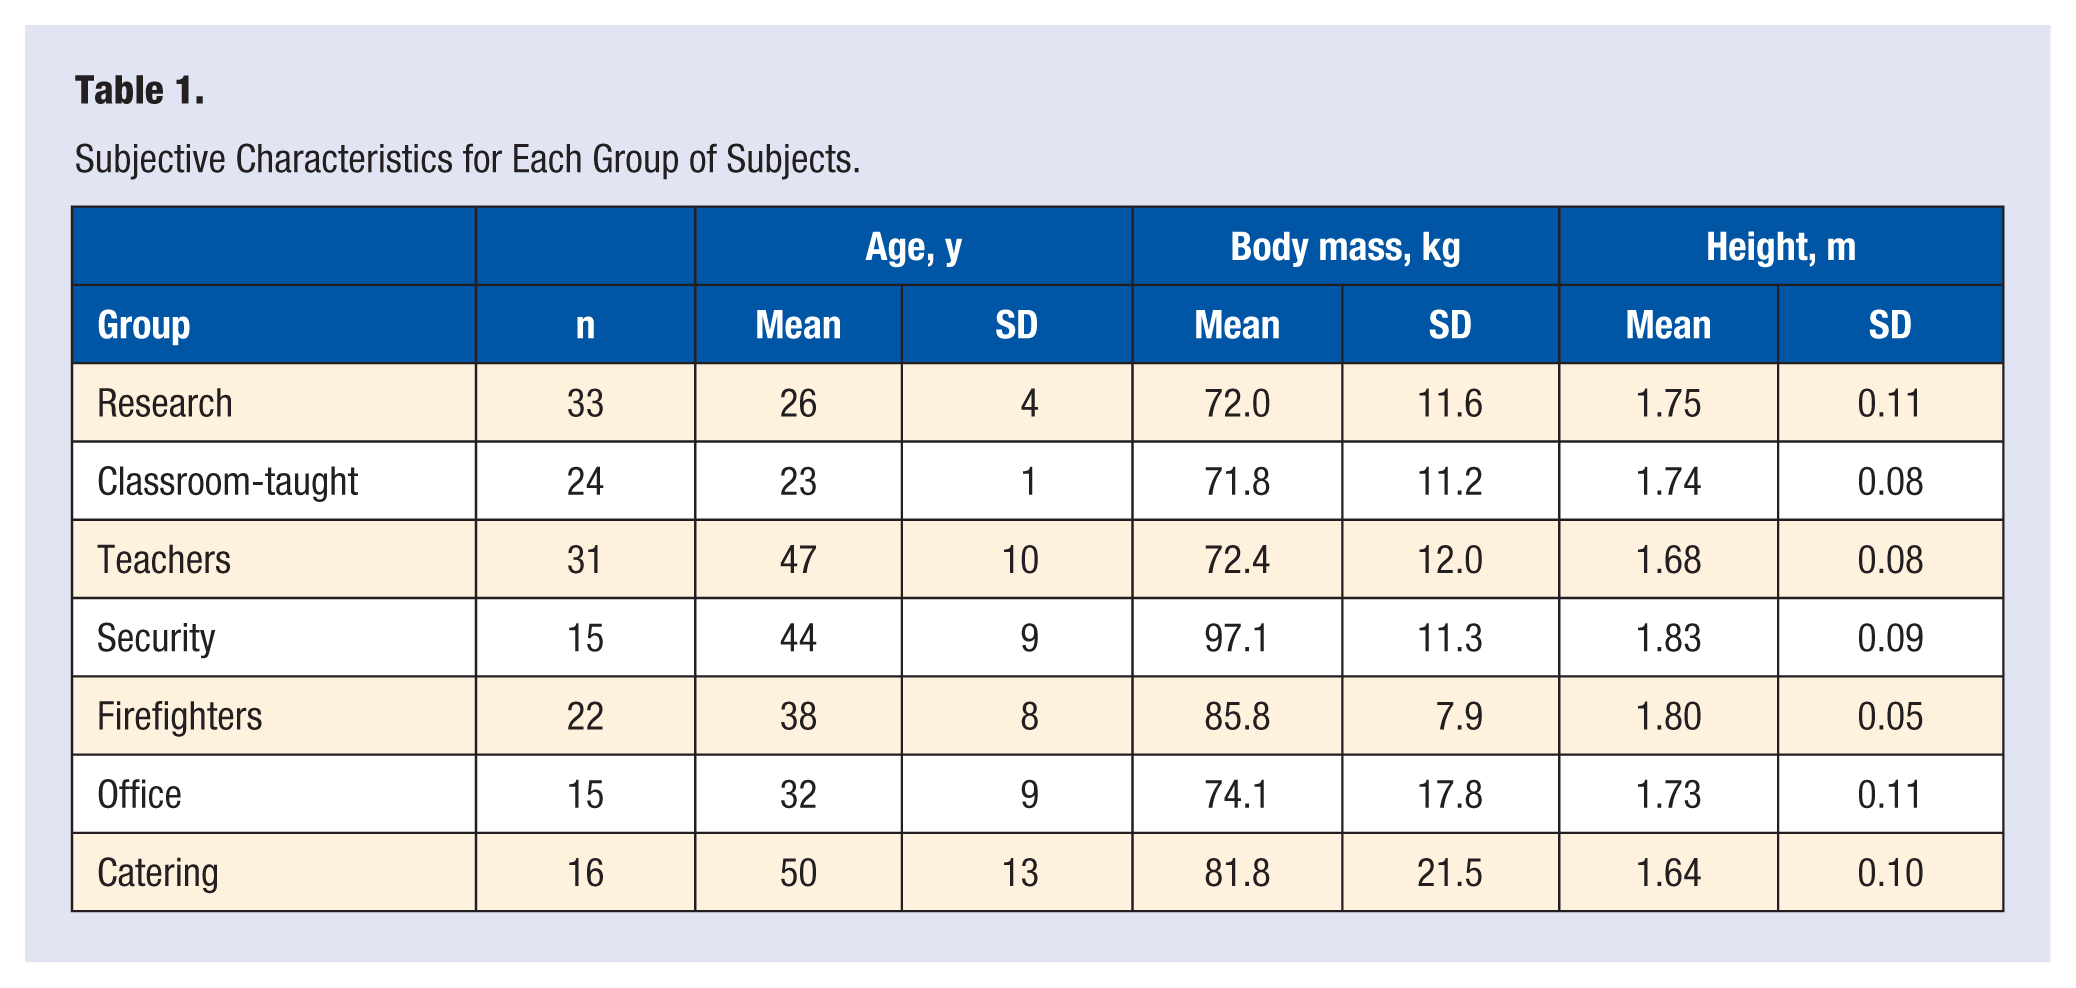
One hundred and fifty-six subjects (age 32 [range, 19-63] years, height 1.74 [SD 0.10] m, mass 77.6 [SD 15.3] kg) consisting of 89 males and 67 females were recruited from the local area. Subjects were research students (n = 33), classroom-taught students (n = 24), teachers (n = 31), security staff (n = 15), firefighters (n = 22), office workers (n = 15), and catering staff (chefs and kitchen assistants) (n = 16). Subjective characteristics for each group are displayed in Table 1. This study was conducted according to the guidelines laid down in the Declaration of Helsinki, and all procedures involving human subjects were approved by the Loughborough University Ethics Committee. Written informed consent was obtained from all subjects.
Subjective Characteristics for Each Group of Subjects.
Each group is described below, with a brief description of a typical working day and any breaks that were allowed for each group of subjects. Any major barriers to water intake were noted.
Research
These were university PhD and research students primarily based in an office environment but with visits to a laboratory for short periods of experimental work. They had no restriction on frequency and duration of break times; they were able to eat and drink freely as they worked.
Classroom-taught students
These were university MSc students who participated in laboratory classes all day and therefore were considered typical of a laboratory worker with restrictions on food and drink access. Food and water intake was banned in the laboratory, so subjects had to leave the laboratory to eat and drink. They had a 1-hour break for lunch.
Teachers
These subjects taught classes (secondary school) for at least 5 hours per day with a small break of approximately 5 minutes after each 1-hour lesson. They had 1 hour for lunch break and a 20-minute break at around 10
Security
These participants were university security staff working a variety of shift patterns including night shifts. They had two 15-minute breaks and a 30-minute lunch or dinner break. Staff patrolled the university on foot, by bike, and in motorized vehicles and were able to drink freely during the shift when time permitted.
Firefighters
Day (n = 17) and night (n = 5) shifts were observed. The firefighters performed maintenance and practice drills throughout the day and had a physical activity session involving strength and aerobic activity in the onsite gym. Physical activity and therefore sweat losses were not recorded so that additional measures did not influence a typical day. The average number of emergency calls was 3 per day. The firefighters were able to eat and drink freely when not performing drills or on calls, when there was limited access to water.
Office
The office staff sat at computers for the duration of the day; they had two 15-minute breaks (in the morning and afternoon) and a 30-minute lunch break. They were able to eat and drink freely while working.
Catering
These were kitchen staff and chefs at a university canteen. They were on their feet throughout the majority of the shift, spending a large portion of work time (exact time unknown) in the kitchen preparing food. They had two 15-minute breaks and a 30-minute lunch break. They were able to drink, outside of scheduled break times, if time permitted.
Procedure
Subjects arrived at their workplace immediately prior to their shift and were asked to sign an informed consent form. Then they were asked to complete a 100-mm visual analogue subjective feelings questionnaire consisting of 6 questions relating to thirst (0 = not at all thirsty, 100 = very thirsty), mouth dryness (0 = not at all dry, 100 = very dry), hunger (0 = not at all hungry, 100 = very hungry), tiredness (0 = not at all tired, 100 = very tired), concentration (0 = not very well, 100 = very well), and energy (0 = no energy, 100 = lots of energy) and a small questionnaire relating to their water intake patterns during a typical shift. The questionnaire asked about access to drinks, any influences on drinking, typical water consumption, and whether subjects experienced thirst and changes in concentration during a shift. They then provided a urine sample, and their height and body mass were measured to the nearest 10 g (Adam CFW-150, Milton Keynes, UK) while they were wearing loose-fitting clothing (1 layer) and without shoes. The urine sample may not have been the first void of the day, but the aim of the study was to examine hydration on arrival at the workplace. Subjects were then asked to complete their work shift as normal. On completion of the shift, subjects provided a urine sample. Body mass was measured but not reported. Changes in body mass could not be accurately related to change in hydration status because food and drink intake, sweat losses, urine output, and excretion losses could not be measured accurately. It was felt that these measures would affect the “typical day.” Subjects were asked to fill in the same subjective feelings questionnaire and a small questionnaire relating to their water intake during the shift. Questions pertained to access to drinks during the shift, how much the subjects consumed, whether they experienced a feeling of thirst, and if so whether they drank to alleviate this. Reported water intake was then presented as the water component of all drinks reportedly consumed. The subjects were asked to rate their concentration at the start, middle, and end of the shift using a 100-mm visual analogue scale and whether they felt they remained hydrated throughout the duration of the shift. Subjects were then free to leave. Ambient temperature and relative humidity were measured at the start and end of each shift both inside and outside the workplace (RH85 Digital Thermo-Hygrometer; Omega, Manchester, UK). The duration of each shift was based on a typical 8-hour working day. To participate, all subjects must have completed a shift of at least 7 hours. All subjects completed this and none were excluded.
Sample Analysis
Urine samples were analyzed for osmolality by freezing point depression (Gonotec Osmomat auto Cryoscopic Osmometer, Gonotec, Berlin, Germany), specific gravity by refractometry (Digit-012, Ceti, Belgium), and color. 7 Urine sodium and potassium concentrations were measured by flame photometry (Corning Clinical Flame Photometer 410C, Corning Ltd, Halstead, Essex, UK). All samples were analyzed in duplicate, and a mean of the duplicate was used.
Statistical Analysis
All data were checked for normality using the Kolmogorov-Smirnov test if the data set was large (n > 30) and the Shapiro-Wilks test if the data set was less than 30. One-way analysis of variance and Kruskal-Wallis tests were used for parametric and nonparametric data, respectively, to identify differences between groups. Independent-sample t tests and Mann-Whitney tests were subsequently performed as post hoc analysis when significant differences were observed and also to compare between start and end values within each population. Linear regression was used to identify relationships. A significance value of P < .05 was used. Parametric data are expressed as mean (SD) and nonparametric data as median (range).
Results
Environmental Conditions
Inside the workplaces at the start of the shift, temperature was 19.6°C (SD 1.6°C) and relative humidity was 41.9% (range, 27.8%-55.5%). At the end of the shift, temperature was 20.5°C (SD 1.0°C) and relative humidity was 41.7% (range, 17.0%-49.5%). Outside conditions were 8.7°C (SD 3.6°C) and 60.1% (SD 14.7%) at the start and 9.5°C (SD 4.1°C) and 56.0% (SD 14.3%) at the end of the shift. Environmental conditions for each group are presented in Table 2.
Environmental Conditions Inside and Outside the Workplace.
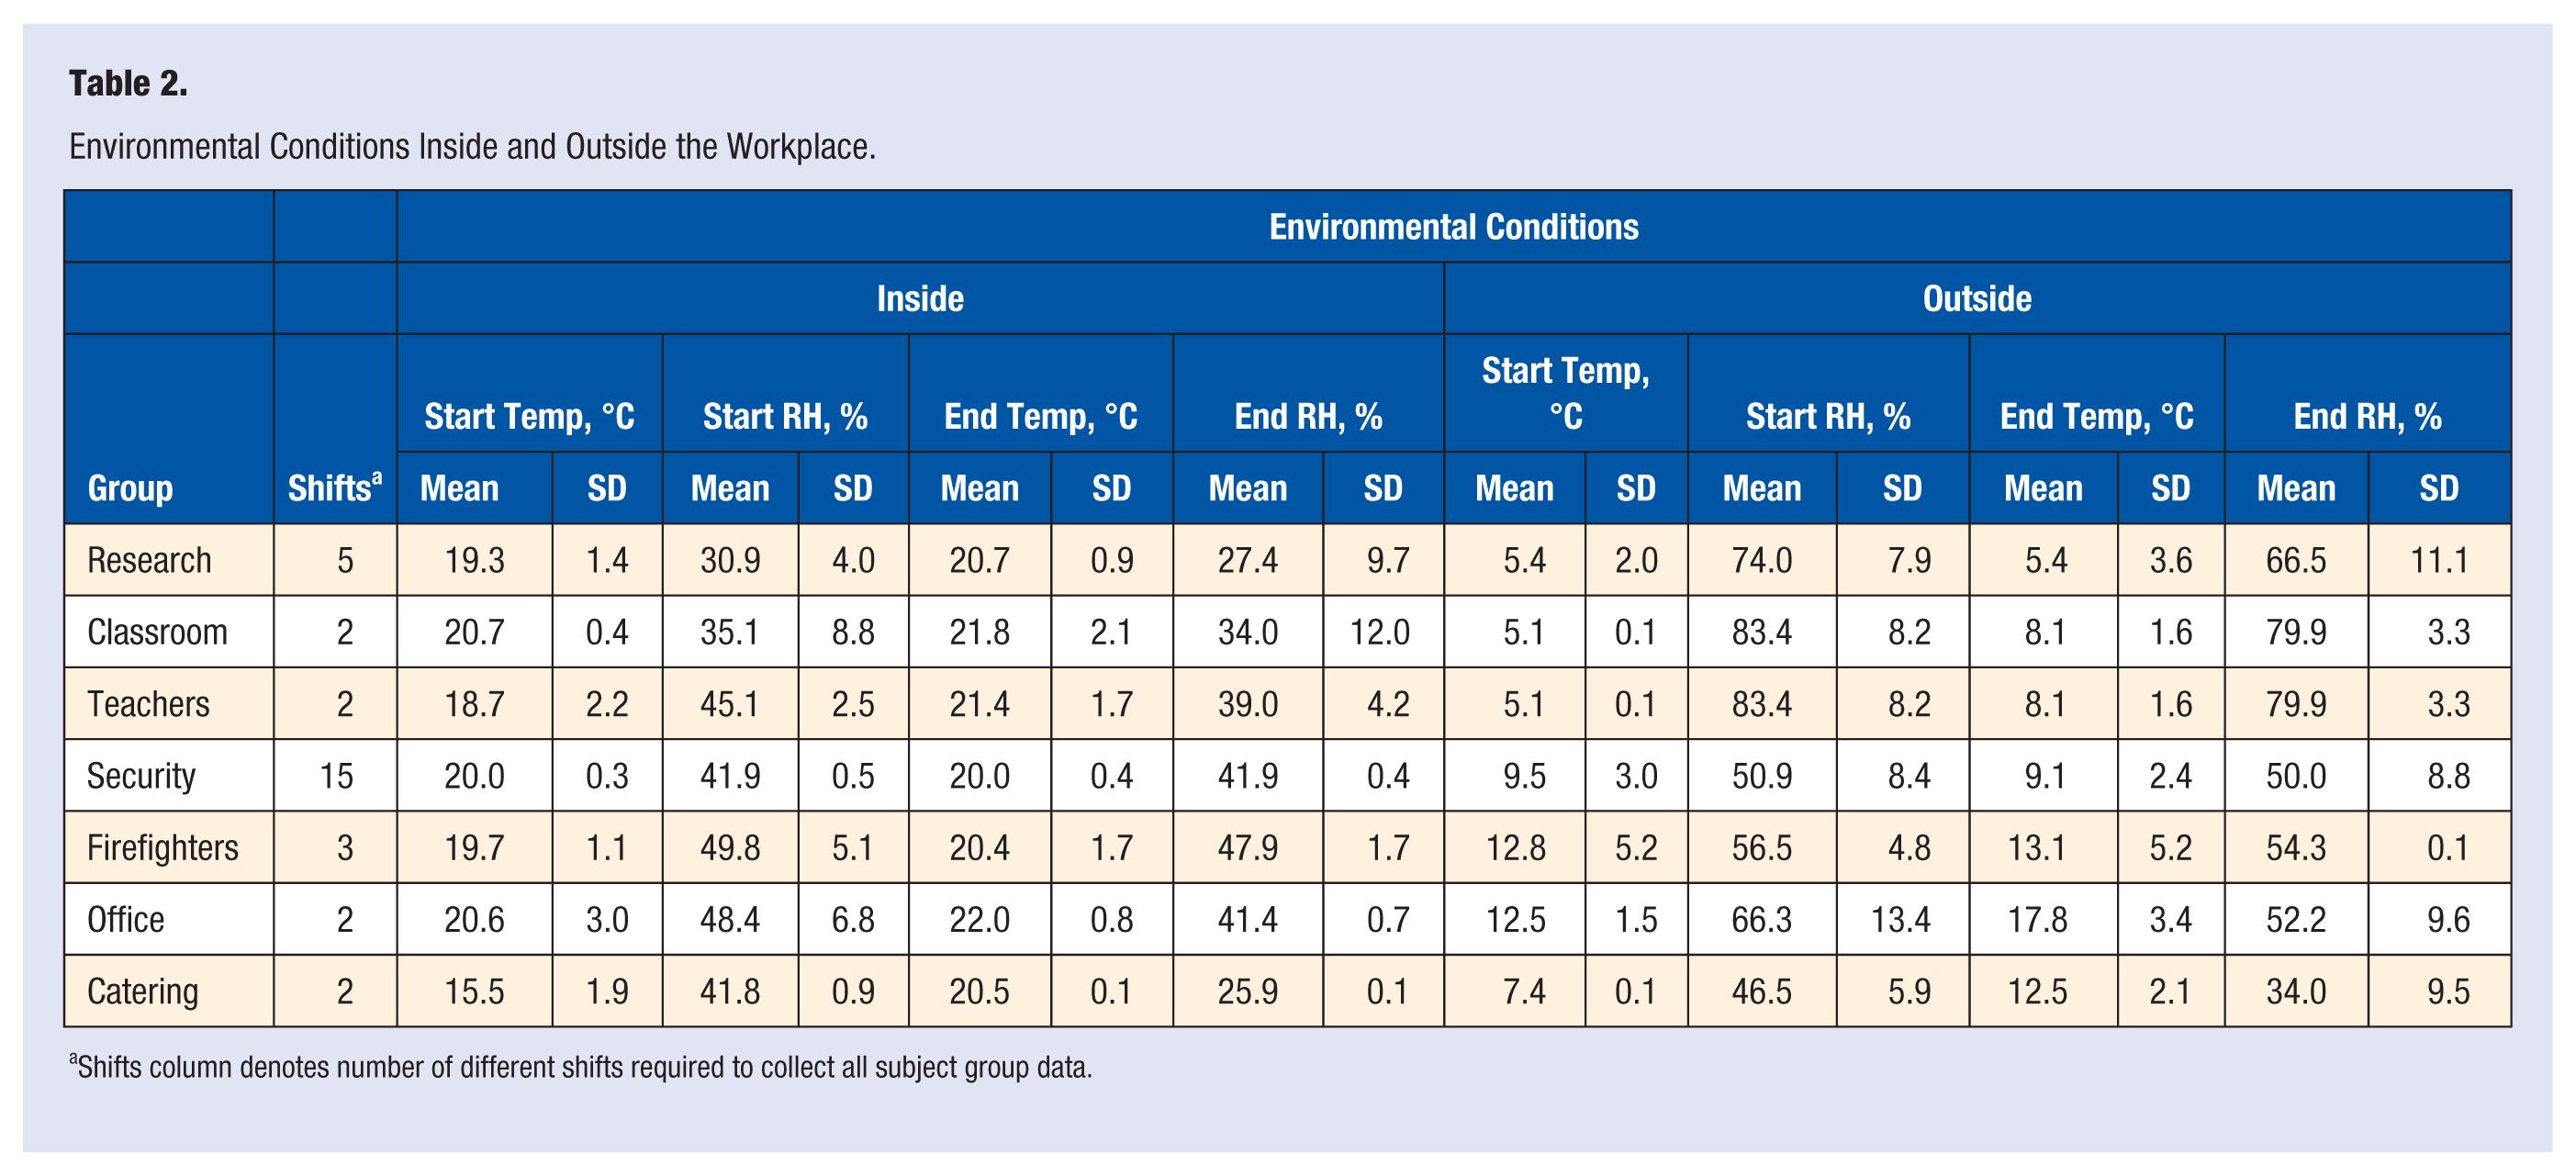
Shifts column denotes number of different shifts required to collect all subject group data.
Preshift Questionnaire
Ninety-eight percent (n = 153) of subjects had access to drinks during the course of their shift. When asked about barriers to drinking during their shift, 67% reported perceived influences on drinking behavior including sensations of thirst and mouth dryness, a lack of toilet facilities, timing of breaks, remembering to drink, and access to drinks in particular environments (eg, while on call or in a laboratory). During a normal shift, males reported (through cups and volumes) consuming more water than did females (1.0 [range, 0.2-4.2] L vs 0.9 [range, 0.1-2.0] L) (P < .0001). Typical reported water intakes by classroom-taught students (0.6 [range, 0.1-1.5] L), teachers (0.6 [range, 0.2-3.0] L), security (1.0 [range, 0.4-1.5] L), catering (1.0 [range, 0.5-2.0] L), and office groups (1.0 [range, 0.3-2.5] L) were similar (P > .05), while greater water intake was typically reported to be consumed in the research group (1.0 [range, 0.4-3.0] L) compared with the teacher group (P < .0001). The firefighters (2.5 [range, 1.0-4.2] L) reported normally consuming more water than all other groups during a typical shift (P < .0001). During a typical shift, 56% of subjects reported that they normally experienced a sensation of thirst and 45% felt that their concentration was affected if they did not drink enough water.
General Results
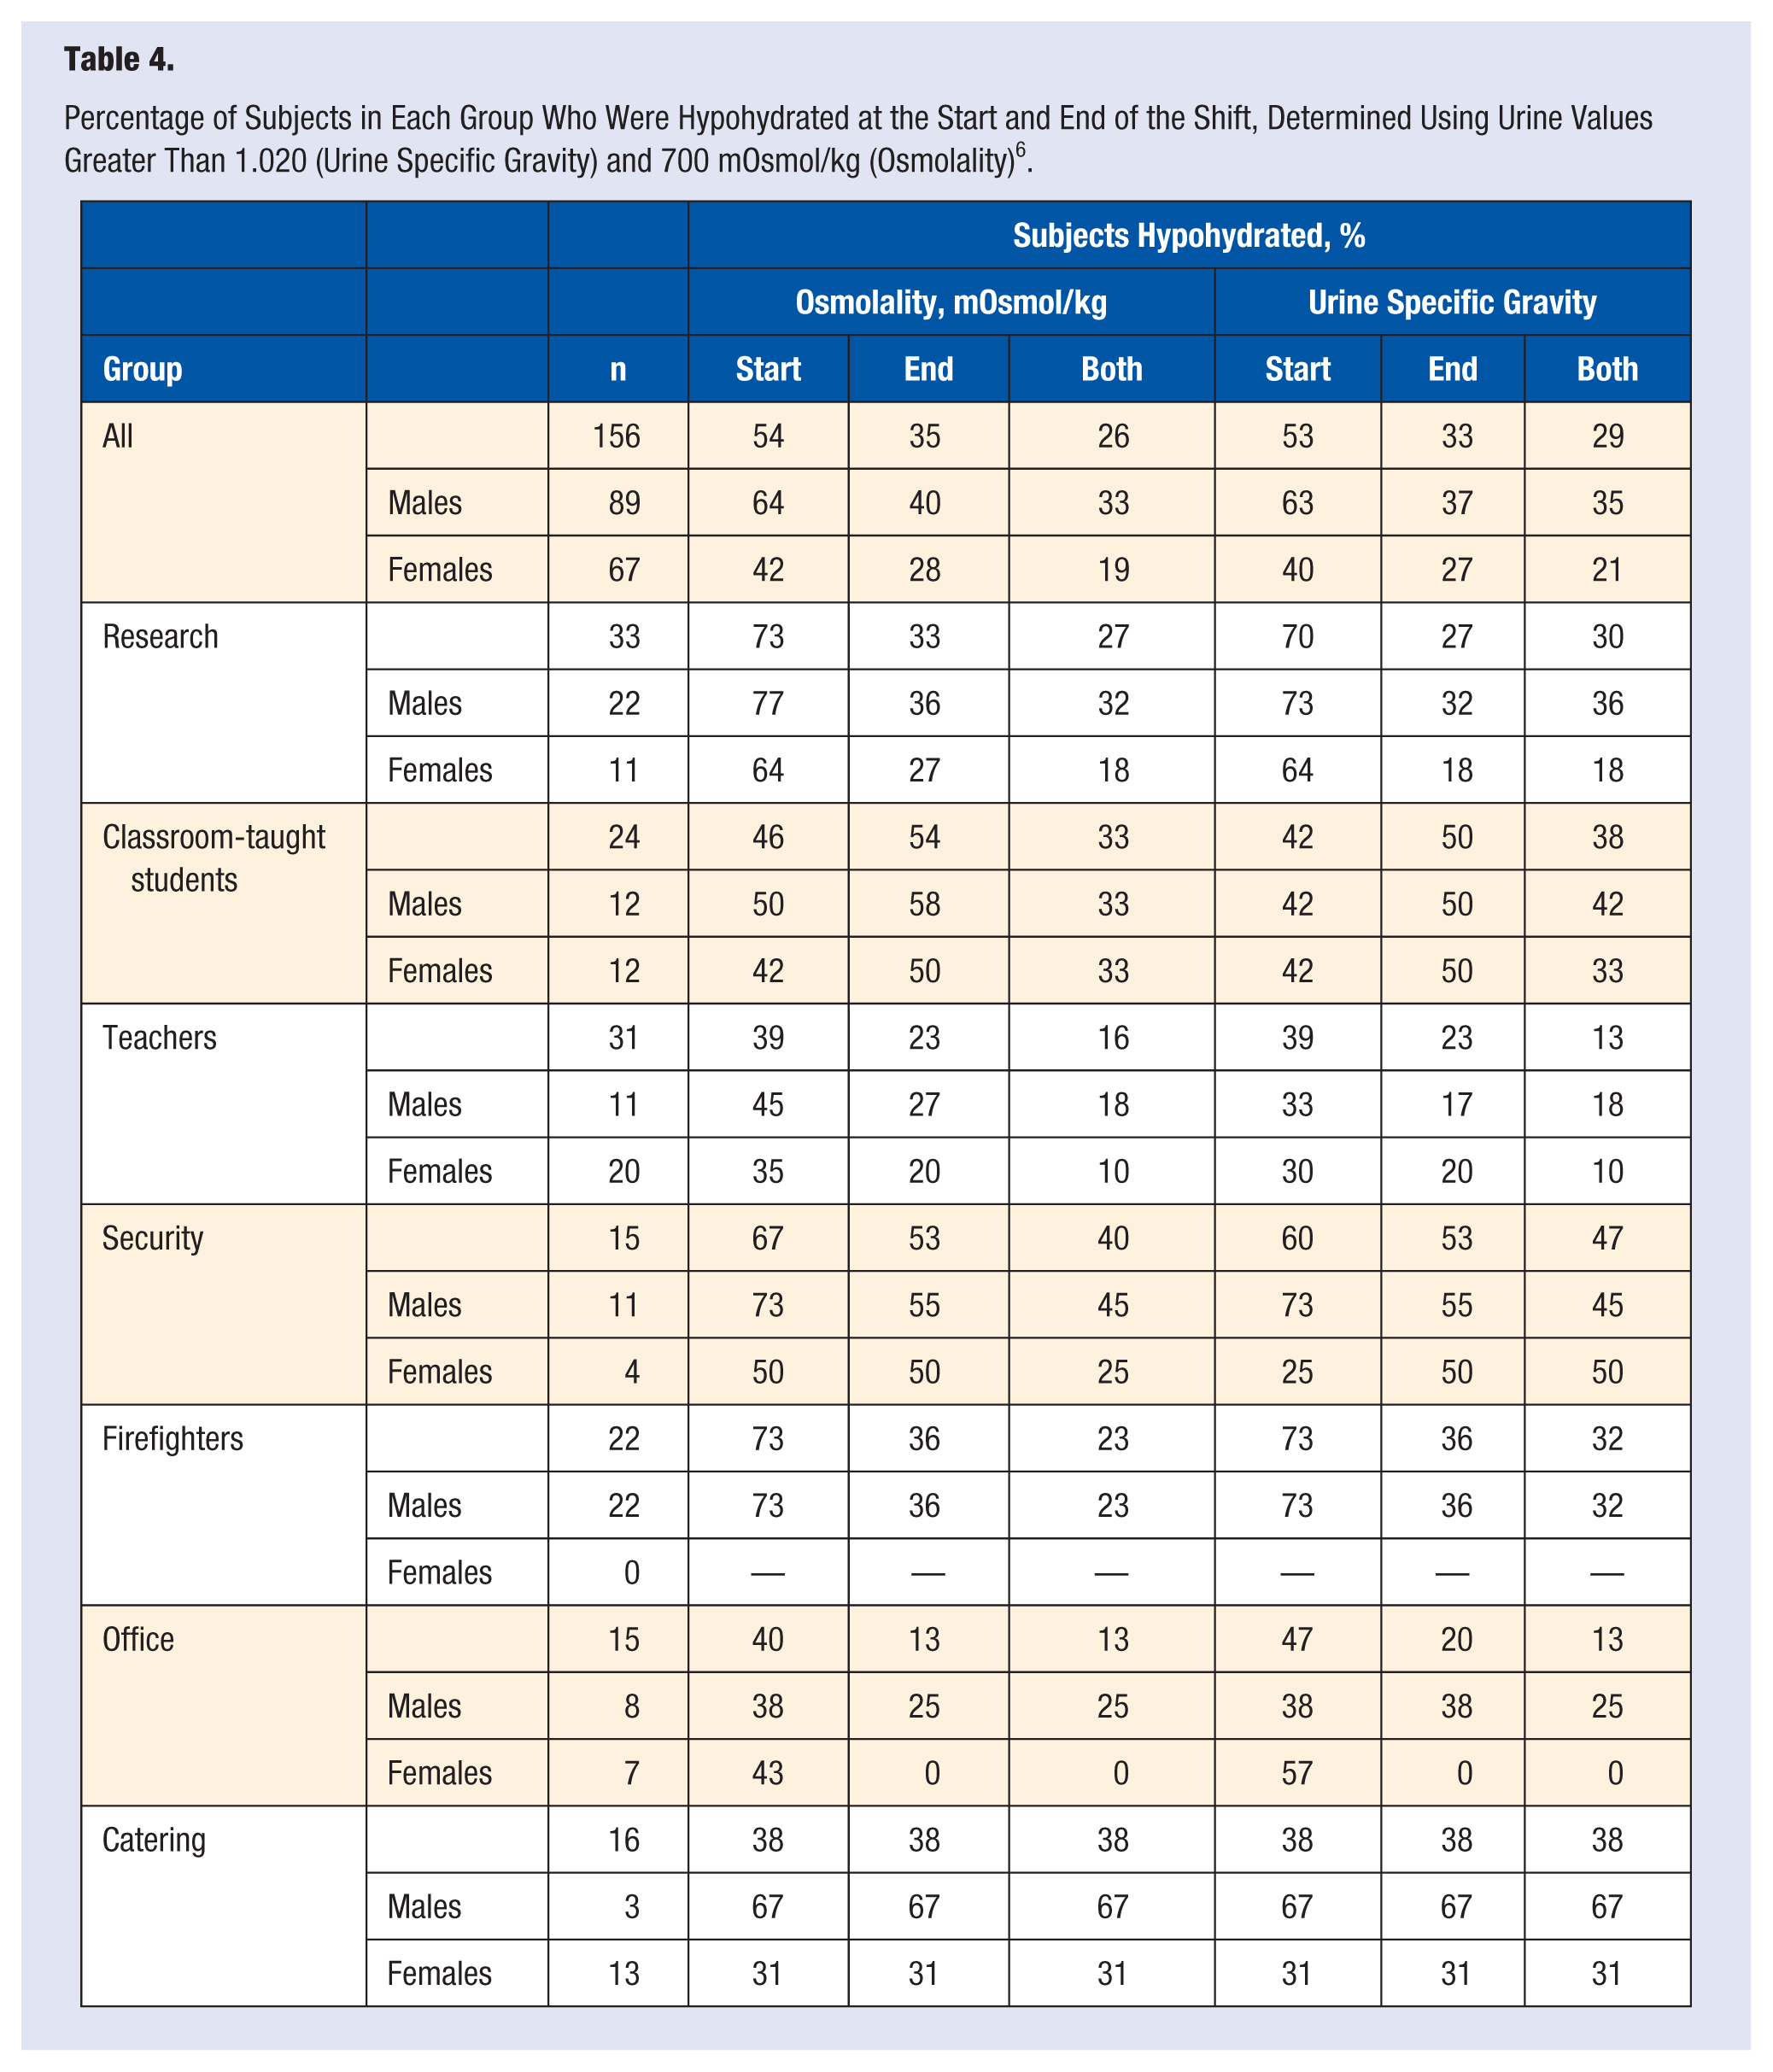
For the population as a whole, lower urine osmolality and specific gravity values were measured at the end of the shift (Table 3), whereas females arrived and left work with lower urine osmolality and specific gravity values (P < .05). Reported sensations of tiredness and hunger were higher at the end of the shift in the whole population, while reported sensations of concentration and energy were lower (P < .05) (Table 3). Sensations of thirst were similar for the whole population (P > .05) but were greater in females at the end of the shift compared with the start (P < .05) (Table 3). There was large variation in individual start and end values of urine osmolality and USG for males and females with no clear patterns or trends emerging from the data (Figure 1). Subjects were classed as euhydrated if urine osmolality was less than 700 mOsmol/kg or USG was less than 1.020. 6 Hypohydration was classed as urine values above these values. Of 156 subjects, 54% started the shift with a urine osmolality indicating hypohydration, and 35% ended the shift with urine osmolality values indicating hypohydration (Table 4). Sixty-four percent of males started the shift hypohydrated compared with 42% of females. The research and firefighter groups had the greatest proportion of subjects starting the shift in a hypohydrated state.
Start and End Values of Urine Parameters and Subjective Feelings Questionnaires for All Subjects and for Males and Females Separately.
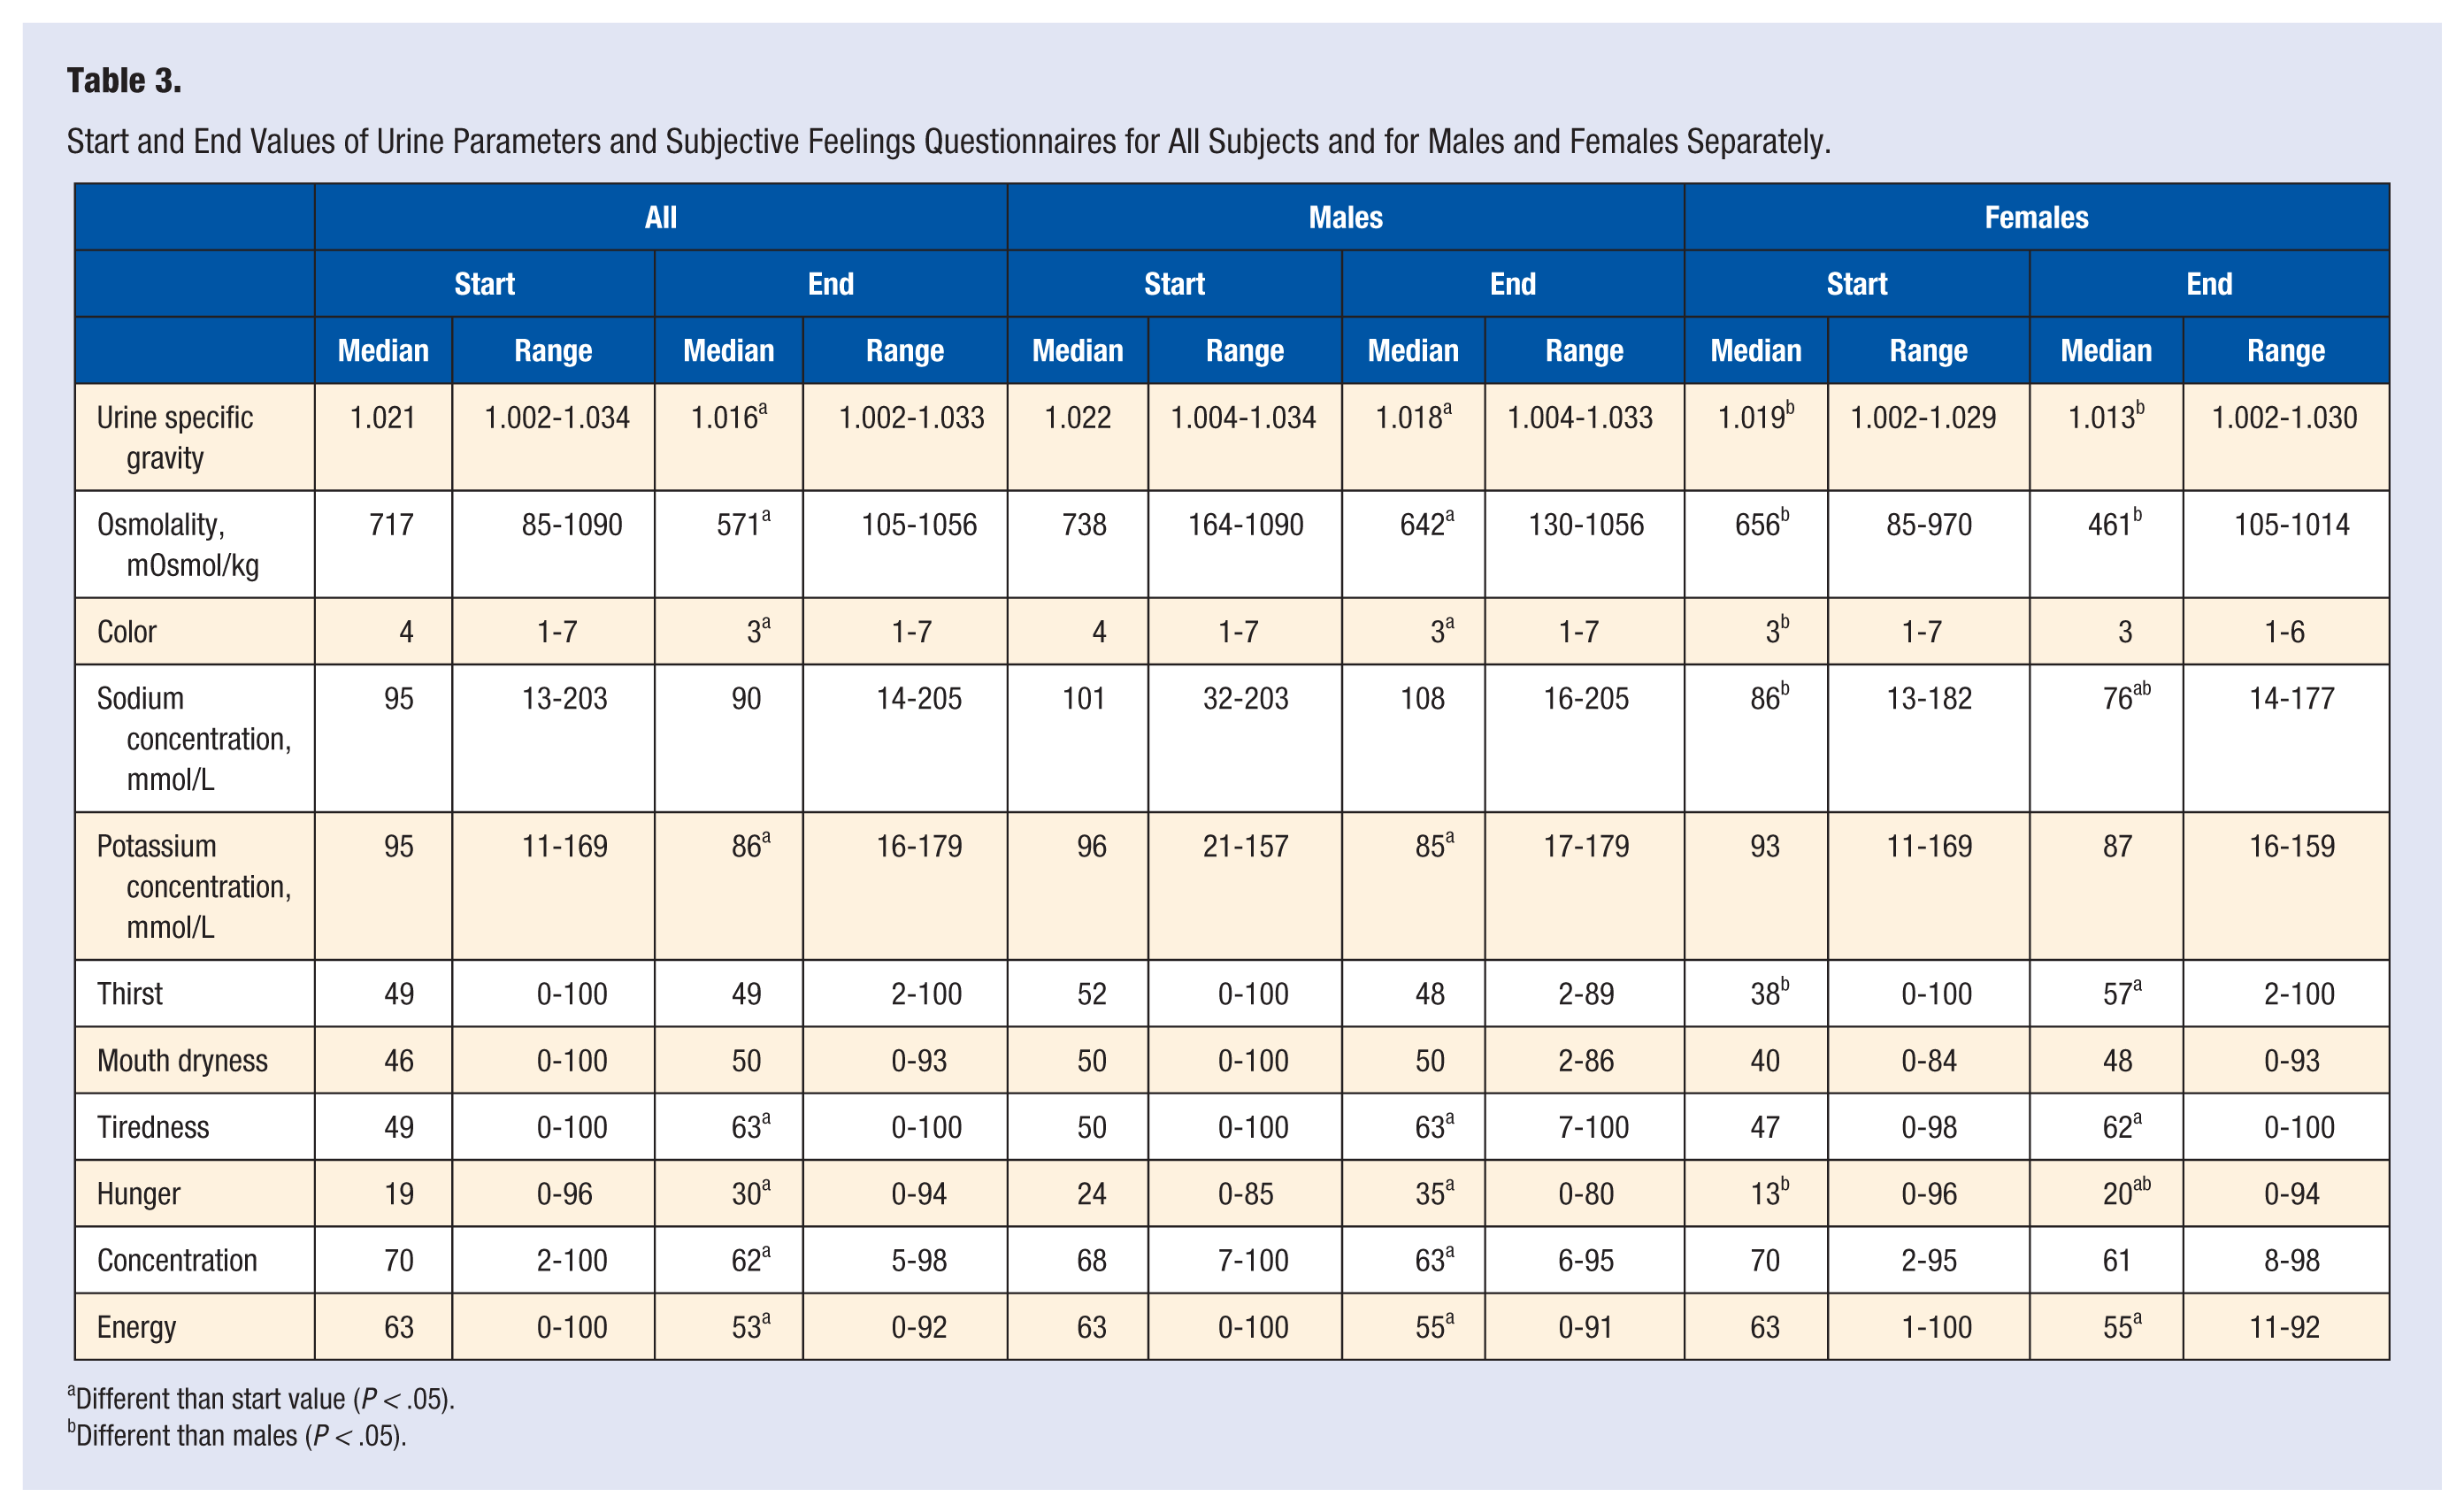
Different than start value (P < .05).
Different than males (P < .05).
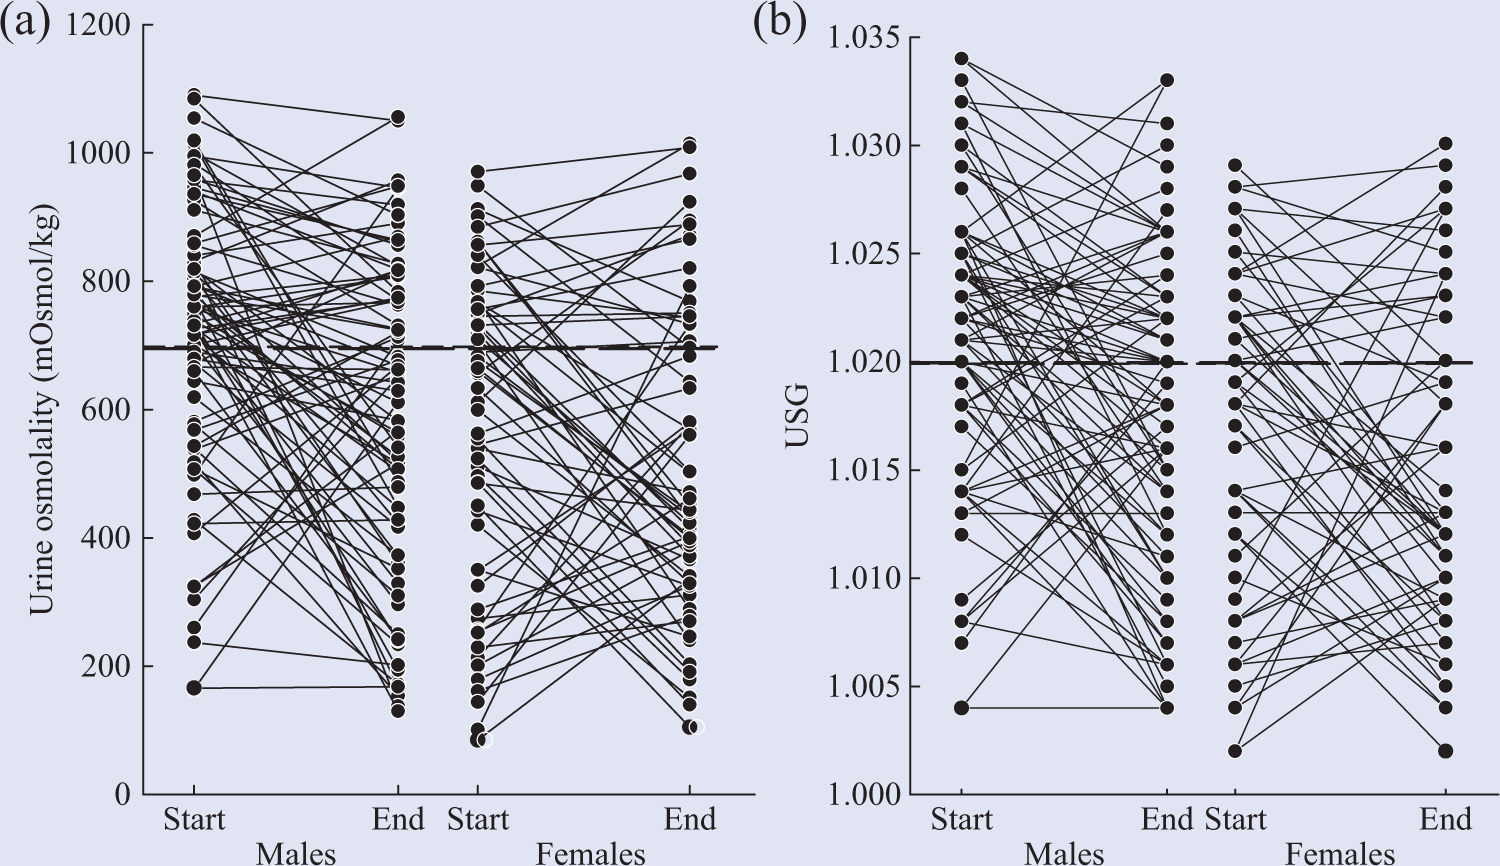
Start and end values for (a) osmolality (mOsmol/kg) and (b) urine specific gravity for males and females. Dashed lines represent euhydration values of less than 1.020 and 700 mOsmol/kg. 6
Percentage of Subjects in Each Group Who Were Hypohydrated at the Start and End of the Shift, Determined Using Urine Values Greater Than 1.020 (Urine Specific Gravity) and 700 mOsmol/kg (Osmolality) 6 .
Group Comparison
Between Groups
USG values at the start of the shift in the research and firefighters groups were greater than those in the office, teachers, and catering groups and were greater than end-of-shift values (P < .05) (Figure 2a). Urine osmolality values showed a similar pattern except that start values for the research and firefighters groups were also greater than those of the classroom-taught students group, and the start values for the firefighters were not greater than the start values in the catering group (Figure 2b). Urine sodium concentrations were greater in the security group at the start of the shift compared with the classroom-taught students and teachers and at the end of the shift compared with the research, classroom-taught students, teachers, firefighters, and office groups (P < .05) (Figure 2c). Urine potassium concentrations were lower at the end of the shift compared with the start in the research group (P < .05) (Figure 2d).
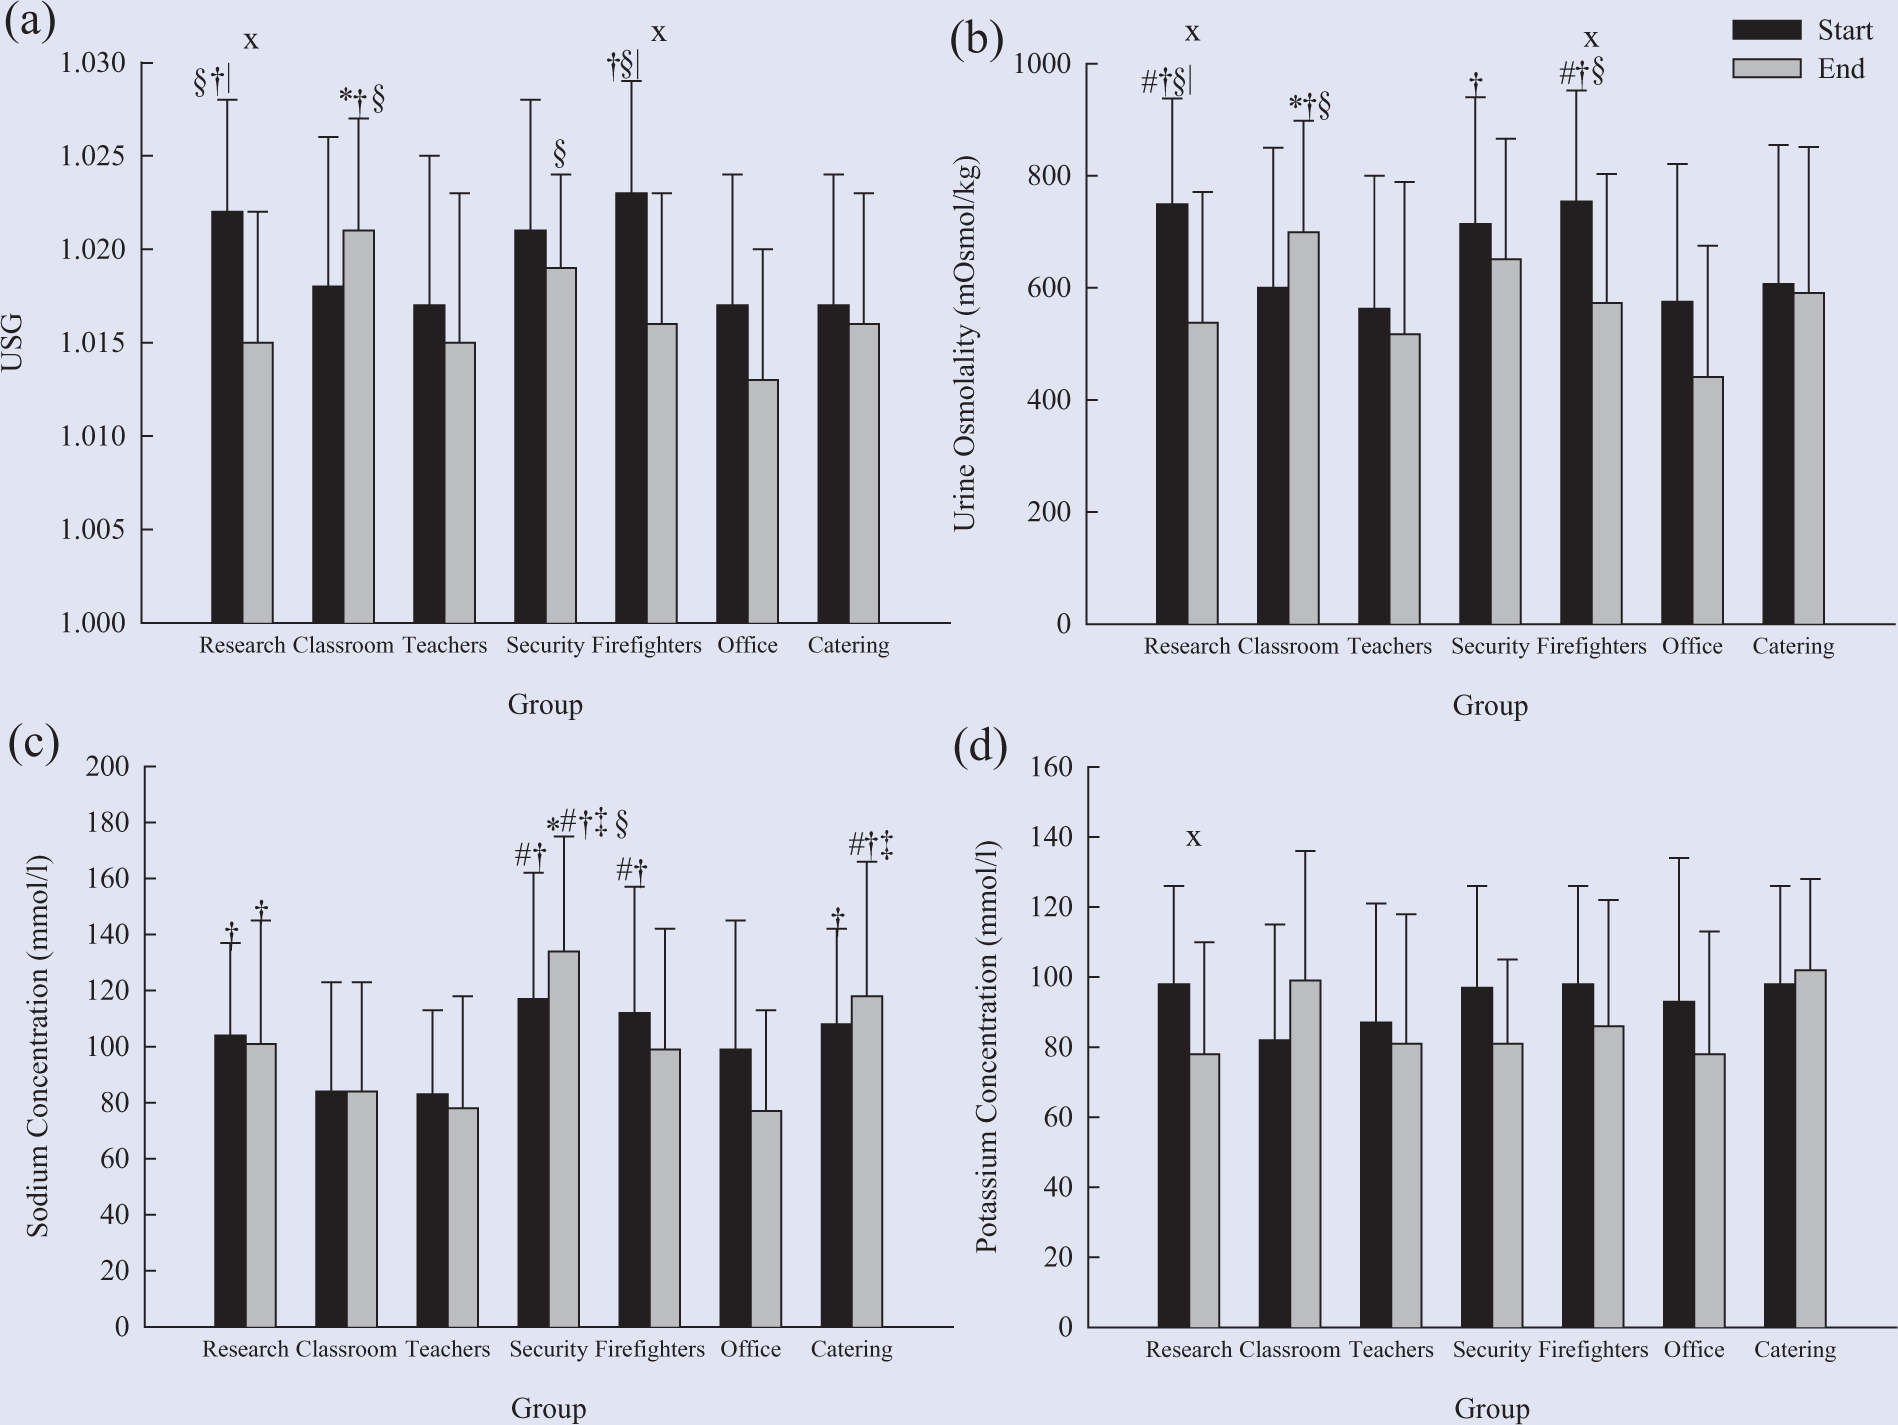
(a) Urine specific gravity (USG), (b) urine osmolality, (c) sodium concentrations, and (d) potassium concentrations at the start (black) and end (gray) of the shift (mean ± SD). *Greater than research group, #greater than classroom-taught students, †greater than teachers, ‡greater than firefighters, §greater than office, and |greater than catering (P < .05). X denotes difference between start and end values (P < .05).
Urine color for males at the end of the shift was lower in the research group (2 [range, 1-6]) compared with the classroom-taught students group (4 [range, 3-7]), the security group (4 [range, 1-6]), and the catering group (5 [range, 3-6]) (P < .05). Classroom-taught students had greater values of urine color compared with teachers (2 [range, 1-5]) but lower values than catering staff (P < .05).
Urine sodium concentrations at the end of the shift for males were higher in the security group (145 [SD 39] mmol/L) compared with the researchers (105 [SD 43] mmol/L), classroom-taught students (93 [SD 45] mmol/L), teachers (91 [SD 47] mmol/L), firefighters (99 [SD 43] mmol/L), and office staff (83 [SD 41] mmol/L) (P < .05). Catering staff (151 [SD 30] mmol/L) had greater sodium concentrations at the end of the shift compared with classroom-taught students, teachers, and firefighters (P < .05).
Females in the classroom-taught students group had higher end-of-shift concentrations for urine potassium concentrations (110 [SD 33] mmol/L) compared with researchers (73 [SD 34] mmol/L), teachers (79 [SD 40] mmol/L), and security guards (58 [SD 17] mmol/L) (P < .05). Catering staff females had higher urine potassium concentrations at the end of the shift (100 [SD 24] mmol/L) compared with the researchers and security guards (P < .05).
Within Groups
In the research group, a reduction from the start to the end of shift values for USG, osmolality, and potassium concentrations occurred for the whole group and within males and females (P < .05). Urine color was lower at the end of the shift in the whole research group and for male researchers (both 4 [range, 1-6] vs 2 [range, 1-6]), whereas comparing the research group as a whole revealed a reduction in energy levels at the end of the shift (63 [SD 16] vs 54 [SD 21]) (P < .05).
Females in the classroom-taught students group had an increase in potassium concentrations at the end of the shift (80 [SD 47] vs 110 [SD 33] mmol/L) (P < .05). Reported feelings of hunger were greater at the end of the shift for all the classroom-taught students (22 [SD 19] vs 50 [SD 26]), male classroom-taught students (22 [SD 21] vs 52 [SD 26]), and female classroom-taught students (21 [SD 17] vs 48 [SD 27]) (P < .05).
All reported subjective feelings in the teacher group were different between the start and end of the shift. Thirst (37 [SD 24] vs 56 [SD 26]), mouth dryness (39 [SD 25] vs 56 [SD 27]), tiredness (51 [SD 23] vs 69 [SD 22]), and hunger (15 [SD 21] vs 32 [SD 23]) were significantly higher at the end of the shift. Concentration (69 [SD 22] vs 51 [SD 23]) and energy (63 [SD 20] vs 50 [SD 20]) levels declined throughout the shift (P < .05). In male teachers, mouth dryness (30 [SD 24] vs 47 [SD 28]) and hunger (9 [range, 0-49] vs 35 [range, 5-65]) increased, whereas concentration (82 [range, 13-98] vs 50 [range, 10-80]) decreased throughout the shift (P < .05). In female teachers, thirst (23 [range, 5-100] vs 59 [range, 13-100]), mouth dryness (47 [range, 1-82] vs 74 [range, 11-93]), and tiredness (44 [SD 25] vs 69 [SD 19]) increased throughout the shift, whereas concentration significantly decreased (66 [SD 21] vs 51 [SD 22]) (P < .05).
In all security guards, concentration levels decreased throughout the shift (63 [SD 20] vs 50 [SD 20]) (P < .05). Urine specific gravity (1.023 [SD 0.006] vs 1.016 [SD 0.007]) and urine osmolality (754 [SD 198] vs 573 [SD 230] mOsmol/kg) were lower at the end of the shift in the firefighters group (P < .05). Concentration levels in all office workers (70 [SD 18] vs 49 [SD 20]) and in only male office workers (73 [SD 18] vs 46 [SD 21]) were lower at the end of the shift (P < .05). Catering staff reported greater levels of tiredness at the end of the shift (29 [SD 23] vs 45 [SD 25]). Male catering staff experienced greater feelings of thirst (63 [SD 20] vs 50 [SD 20]) and mouth dryness (58 [SD 8] vs 19 [SD 9]) at the start of the shift (P < .05).
Reported Water Intake
Males reported more water consumption compared with females during the monitored shifts (P < .0001). Males reported consuming 1.2 (range, 0.0-3.3) L compared with 0.7 (range, 0.0-2.0) L for females. This was equivalent to 14 (range, 0-47) mL/kg and 10 (range, 0-32) mL/kg for males and females, respectively (P = .004). Within each group there was no difference between the water reportedly consumed by males and females (research, 1.2 [0.4-3.3] vs 0.9 [0.3-1.9] L; classroom, 0.7 [0.0-1.1] vs 0.5 [0.0-1.4] L; teachers, 0.8 [0.4-2.5] vs 0.6 [0.0-1.2] L; security, 0.9 [0.3-2.0] vs 1.4 [0.8-2.0] L; office, 1.3 [0.5-3.0] vs 0.8 [0.5-1.5] L; catering, 1.8 [0.4-2.0] vs 0.8 [0.4-1.4] L for males and females, respectively) (P > .05). Regardless of gender and focusing just on the work groups, the firefighters reported consuming more water than all other groups (P < .05) (Figure 3). Reported water intake was weakly related to feelings of thirst at the start of the shift (positively) (r = 0.161, P = .044) but not at the end of the shift. At the end of the shift, USG values were negatively related to reported water intake for the whole population (r = 0.226, P = .005), males (r = 0.356, P = .001) and females (r = 0.253, P = .039). A similar pattern occurred for osmolality values (whole population [r = 0.230, P = .004], males [r = 0.349, P = .001], and females [r = 0.272, P = .026]). USG and osmolality values at the start of the shift as a whole and within groups were not related to reported water intake values (P > .05). The change in USG and osmolality from the start to the end of the shift was negatively correlated with reported water intake (USG, r = −0.325, P < .0001; Uosm, r = −0.329, P < .0001) so the larger the decrease in USG and Uosm, the greater the reported water intake. When Uosm and USG decreased, the reported water intake was greater compared with when Uosm and USG increased from the start to the end of the shift (1.1 [0.0-3.3] vs 0.7 [0.0-2.6] L) (P < .05).
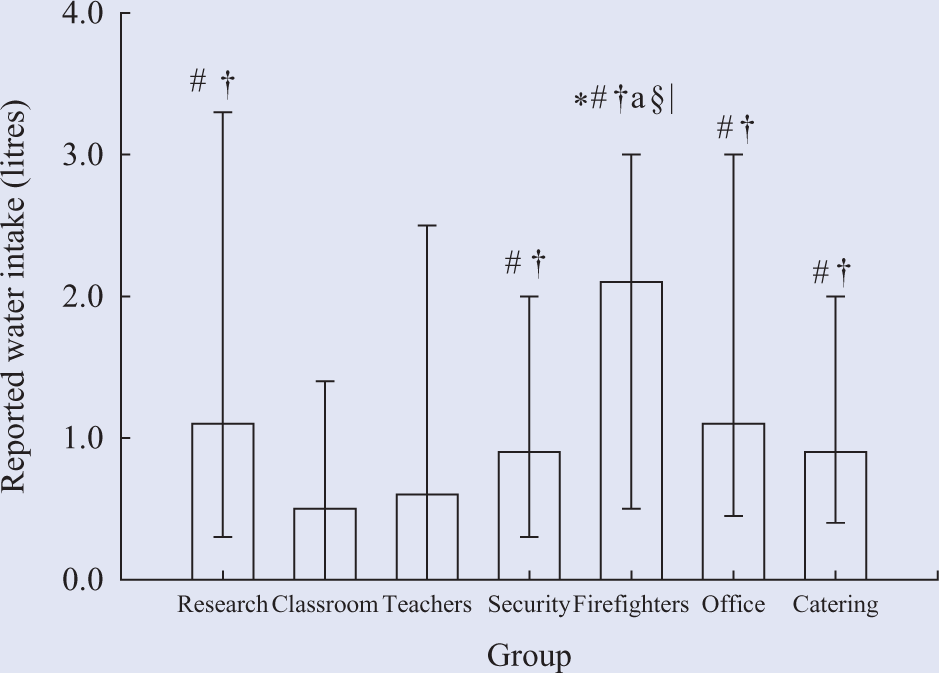
Reported water intakes for each group during the shift (median and range). *Greater than research group, #greater than classroom-taught students, †greater than teachers, agreater than security, §greater than office. and |greater than catering (P < .05).
Sensations of Thirst and Concentration Levels
One hundred seventeen workers reported experiencing a sensation of thirst at some point throughout the duration of the shift; 85% (n = 99) alleviated thirst by consuming a drink. The average amount of water reported that was used to satiate sensations of thirst was 0.2 (range, 0.05-1.4] L. Ninety-two percent of males who experienced thirst alleviated the sensation by consuming water compared with 75% of females. Concentration levels at the start and end of the shift were not related to the corresponding values for osmolality and specific gravity (P > .05). Sixty-five percent (n = 101) of the workers felt that they kept themselves hydrated throughout the duration of the shift. Of those who thought they were hydrated at the end of the shift, 70% (n = 71) and 68% (n = 69) had urine osmolality and USG values, respectively, that were below 700 mOsmol/kg and 1.020, whereas of those who did not feel like they kept themselves hydrated, 41% (n = 22) and 43% (n = 23) had osmolality and USG values, respectively, not classified as euhydrated.
Discussion
The purpose of the study was to examine hydration status in different working groups at the start and end of a shift and to examine water intake from beverages during the shift. Overall there was very little difference in the hydration status parameters and reported water intake values between the groups observed. Reported water intakes between groups were very similar with slight differences between males and females, with males consuming more water.
Individuals in the classroom-taught students group reported that the observed shift was not typical of a normal day. This was because they were in laboratory classes where drinking was prohibited unless they left the laboratory. Although this was not typical of a normal day but was typical of 1 out of 5 working days, the group was chosen based on the laboratory classes to allow for a comparison to similar subjects in the university research/studying environment.
In general, subjects had higher values of USG and osmolality at the start of the shift compared with the end. A large proportion of subjects (54% at the start and 35% at the end) exhibited urine values indicating hypohydration, with many (52% of the original 54%) remaining in a state of hypohydration at the end of the shift. Data used as markers of hydration status (USG and urine osmolality) were lower at the end the shift; however, from a physiological perspective it was difficult to determine whether the difference in hydration values corresponded to a change in hydration status, particularly when using ACSM guidelines 6 where an individual is classed as either euhydrated or not. Despite this, with collection of urine samples at least 8 hours apart and with the reporting of water intake during the shift, a valid representation of hydration status during a typical working day was created.
Females have been shown to consume less water,15-17 confirming reported absolute and relative water intake values in this study. This may have been attributable to males trying to sustain greater body water content. Kant 15 examined 4112 individuals in North America and found no difference in plain water intake between males and females (1044 [SEM 48] g vs 1079 [SEM 67] g for males and females, respectively; P = .5), but females consumed significantly less water from other beverages (1783 [SEM 55] g vs 1298 [SEM 35] g for males and females, respectively; P < .0001). All 3 studies examined water intake over 24 hours, so direct comparisons may not be used, but the general trends were similar. The lower reported water intake in the present study may be attributed to the lower values of USG and urine osmolality for women at the start of the shift. If males and females had both begun the shift in a similar state of hydration, reported water intake values in females may have been greater.
The firefighting group reported greater water intake during the observed shift compared with all the other groups. The firefighters are generally encouraged to drink during the shift by management and through urine color charts in the toilets. Compared with other groups, they have previously been made aware of the necessity to drink and maintain hydration status, through initiatives and regular health testing, to prevent declines in cognitive and physical performance. It has been shown that educating workers about dehydration, while assessing hydration status and implementing a water replacement program, increases the likelihood that they will arrive at work in a euhydrated state and remain so. 2 The structure of the firefighters’ general day was dependent on emergency calls (average of 3 per day), and so it appeared that they would drink in anticipation of this and the possibility of wearing personal protective equipment, which can often cause heat stress because of the uncompensable environment it creates. 3 In contrast, the classroom-taught students reported drinking very little water. During laboratory classes the students were restricted in terms of where they could drink, and this was reflected in the reported volume consumed and the subsequent urine parameters.
The National Diet and Nutrition Survey 18 reported that in the general population, the typical water intake from beverages was approximately 1.3 L/d. This value was an average per day over a 7-day observation period and included alcohol consumption (approximately 0.3 L/d). In the present study, water intake was only reported during the working day and so it was difficult to make direct comparison. In 2010, the European Food Safety Authority 19 established an adequate intake of 2.5 L/d for males and 2.0 L/d for females from all sources of water including food, whereas in 2004, the Institute of Medicine 20 established an adequate intake of approximately 3.7 L/d for males from food and beverages and 2.7 L/d for females. The Food Standards Agency 21 suggested a value of 1.2 L from beverages to prevent dehydration. The recommendations vary in suggested water intake, but if the lowest value is taken, only 5 groups in the present study reported intake close to or above this value in the monitored shift alone, while the remaining 2 groups (classroom-taught students and teachers) had the greatest barriers to water intake attributable to availability of water, restrictions on when and where they could drink, and access to toilet facilities. Again, it must be stressed that the adequate water intakes for a day cannot be compared with the water intake during the shift, as subjects were only at work for a relatively small portion of the day. However, the findings can provide an indication of water intake behaviors and patterns. Within the time subjects were at work, it was not likely that they would consume a “main” meal that would provide large amounts of water through food and accompanying drinks.
Several subjects reported water intake greater than 2 L/d, and 1 subject in the research group and 2 in the firefighters group reported water intakes of 3.3, 3.0, and 3.0 L, respectively, throughout the shift (start Uosm of 813, 736, and 779 mOsmol/kg, respectively; end Uosm of 519, 240, and 507 mOsmol/kg, respectively; start USG of 1.028, 1.020, and 1.021, respectively; end USG of 1.014, 1.007, and 1.014, respectively). The firefighters group appeared most at risk from overdrinking, with 14 out of 22 subjects reporting water intake greater than 2 L during the shift. Despite this, urine osmolality values were, on average, greater than 700 mOsmol/kg at the start of the shift, and this decreased slightly at the end of the shift. This suggests either that their reported water intake was adequate or that the actual volumes reported were inaccurate. Errors, particularly underreporting, 22 can occur when individuals are asked to self-report food and drink intake, and water intake volumes in the present study might have been underreported. Only with accurate measurement of water intake through weighing of drinks and food consumed could a more precise analysis of water intake be conducted. However, this may have altered behavior and made participants more aware of water intake.
During day-to-day occupational activity, thirst is an adequate stimulus to promote water replacement and help maintain hydration status. 23 Of the workers monitored, 117 (75%) experienced a sensation of thirst at some point during the duration of the shift, with 85% alleviating the sensation through drinking. These results suggest that thirst was an adequate stimulus in the present study to initiate drinking; however, examining the role that thirst plays in maintaining hydration status is difficult because it was not known whether every bout of water intake was initiated by thirst. This becomes particularly apparent when we consider the number of subjects who were not euhydrated at the end of the shift despite sensations of thirst and alleviation with consumption of beverages. With sensations of thirst similar at the start and end of the trial, it appeared that enough water was consumed throughout the shift to maintain a certain level of thirst.
Assessing a start and end urine sample provided information regarding these time points, but little information regarding hydration was gathered throughout the duration of the shifts. Assumptions could have been made involving a direct link between start and end values, possibly suggesting that the end value arose directly from the start value. However, euhydration has been shown to follow a sinusoidal wave and fluctuate around an average value over a period of time. 23 Therefore, to determine the pattern throughout the shift, it would have been advantageous to increase the frequency of sampling to a fixed number or a collection of all samples produced. The major problem with this would have been the interference with the “typical” day of the subject, creating a deviation from normality and thus potentially affecting urine output and normal water intake patterns. A solution to improve this would be to test over a number of days with greater frequency of sampling, thereby allowing the subjects to adjust to the method of testing.
The desire to assess hydration status and reported water intake during a typical working day resulted in limitations in the study. A compromise was reached to observe a typical day without measuring variables that, while potentially enhancing the results, may have affected subjects’ behavior during a typical day, thereby reducing the validity of the results. Accurate measurement of food and water intake, urine output, and sweat losses plus assessment over several days may have been beneficial; however, we felt that the current study design was most appropriate to provide a snapshot of a typical working day without causing changes to daily routines and providing inconvenience. This does have limitations in terms of the interpretation of the results and conclusions reached, particularly given the accuracy of reported water intake. Despite this, because of the number of subjects recruited from each workplace, confidence can be taken in the general conclusions reached and trends identified.
Conclusion
A large proportion of subjects exhibited urine values indicating hypohydration, and many remained in a state of hypohydration at the end of the shift. A large proportion of workers (75%) experienced a sensation of thirst throughout the shift. Access to water and other beverages at work helped alleviate sensations of thirst. Increasing awareness of drinking and hydration status helped increase water consumption during the observed shift; males reported consuming more water per kilogram of body mass compared with females. Further investigation is required to gain insight into the causes and significance of these findings through blood indices and hormone analysis.
Footnotes
Acknowledgements
The study was supported, in part, by The Coca-Cola Company.