
Abstract
Objective
This study aimed to investigate the impact of the minimum segment width (MSW) on the plan quality of volumetric modulated arc therapy (VMAT) for nasopharyngeal carcinoma (NPC), seeking to identify the optimal MSW and provide clinical references for VMAT plan design in NPC.
Methods
The planning CT images of 40 NPC patients treated in our institution between January 2019 and March 2019 were retrospectively selected, including 8 cases of T1, 11 of T2, 12 of T3, and 9 of T4 stage. Target volumes and organs at risk (OARs) were delineated according to ICRU Reports 50, 62, and 83. To ensure consistency in plan optimization, a priority-classified optimization model was utilized to classify all targets and OARs into four priority levels: the brainstem, spinal cord, optic chiasm, and optic nerves were assigned Level I; the planning target volume (PTV) and temporal lobes were Level II; the eyes, lenses, and pituitary gland were Level III; and the parotid glands, mandible, temporomandibular joints (TMJs), thyroid, inner ears, and oral cavity were Level IV. During the optimization process, Level I OARs were strictly prioritized first, followed sequentially by Levels II to IV. Four VMAT plans were generated for each patient using the Monaco 6.00.11 treatment planning system (TPS), with the MSW parameter set to 0.5 cm, 0.8 cm, 1.0 cm, and 1.5 cm, respectively, while keeping other physical parameters identical. Dosimetric differences in PTVs and OARs were compared among the four groups to evaluate the effect of varying MSWs on plan quality.
Results
All VMAT plans achieved successful optimization while strictly meeting the prescription dose constraints for Level I OARs. For patients with T1-2 stage, the prescription dose coverage for all PTVs exceeded 95% across the four groups. As the MSW increased, the D2, D50, D95, and homogeneity index (HI) of the targets significantly increased (P < 0.05), whereas the D98 and conformity index (CI) significantly decreased (P < 0.05). The parotid gland doses were lower in the MSW 0.5 cm and MSW 0.8 cm groups. Additionally, the monitor units (MUs) exhibited a decreasing trend with the increase of MSW. For patients with T3-4 stage, the prescription dose coverage of PTVnx increased as the MSW decreased across the four groups; however, none of the plans reached the 95% coverage threshold for PTVnx. The MSW 0.5 cm group exhibited lower doses to the left parotid glands, right TMJ, and oral mucosa compared to the MSW 1.5 cm group, with no substantial differences observed for other OARs. MUs also decreased with increasing MSW in these patients.
Conclusions
The MSW significantly affects the quality of VMAT plans for NPC. For T1-2 patients, all four MSW groups achieved >95% PTV coverage; while MSWs of 0.5 cm and 0.8 cm provided better sparing of the parotid glands, the 0.8 cm MSW required a shorter treatment time. Therefore, an MSW of 0.8 cm is recommended for T1-2 patients. For T3-4 patients, none of the plans achieved 95% PTV coverage; thus, advanced higher-precision radiotherapy modalities are recommended. However, if VMAT is clinically selected, an MSW of 0.5 cm is recommended for plan design to maximize target coverage.
Introduction
Nasopharyngeal carcinoma (NPC) is one of the common malignant tumors of the head and neck, frequently observed in East and Southeast Asia.1,2 In recent years, with in-depth research into the biological characteristics and molecular mechanisms of NPC, 3 treatment modalities have undergone significant advancements. The latest treatment guidelines emphasize the importance of individualized therapy, and a multimodal comprehensive treatment strategy combining radiotherapy, chemotherapy, targeted therapy, and immunotherapy has become the mainstream in clinical practice. 4
Due to the deep anatomical location of the primary lesion and the high radiosensitivity of cancer cells, radiotherapy has become the primary treatment modality for NPC. 5 VMAT is a specific advanced technique of intensity-modulated radiotherapy (IMRT). During VMAT delivery, the linear accelerator gantry rotates in continuous arcs while simultaneously delivering uninterrupted radiation beams, which effectively improves treatment efficiency. VMAT has been widely applied in NPC radiotherapy. Currently, Monaco, Pinnacle, and Eclipse are the commonly used TPS. Previous studies have compared potential differences in dose calculations among various TPSs, 6 noting that the Monaco system employs the Monte Carlo algorithm, enabling more accurate and detailed dosimetric calculations.7,8 During the optimization process of VMAT plans using the Monaco TPS, appropriate parameter settings are of great significance for improving plan quality. 9 Among the multiple adjustable parameters in the Monaco system, MSW plays a crucial role in VMAT plan design, directly influencing the shape, size, and number of segments.
The MSW parameter controls the minimum distance between opposing leaves of the multileaf collimator (MLC). A smaller MSW generates a greater number of segments. The number of segments determines the subdivision of the target lesion into multiple regions, each capable of receiving varying dose contributions. Increasing the number of segments can enhance treatment precision, allowing the dose distribution to conform more closely to the shape and location of the lesion, thereby reducing radiation damage to surrounding healthy tissues. However, an increased number of segments concomitantly increases the complexity of the treatment plan and prolongs the computational time.
To date, although studies investigating the optimal MSW parameter have been conducted globally, the conclusions remain controversial. Al-Rawi et al. 10 found that for NPC treated with VMAT, the optimal plan should utilize an MSW of 0.5 cm. Conversely, Wei 11 and Yan 12 indicated that for VMAT in lung and esophageal cancers, an MSW of 1.0 cm can guarantee plan quality while achieving superior treatment efficiency and delivery accuracy. Other studies have suggested that an MSW of either 1.0 cm or 1.5 cm 13 yields the optimal plan quality. Despite these findings, systematic studies evaluating the impact of the MSW parameter in VMAT planning for NPC remain scarce, particularly regarding advanced cases in the T3 and T4 stages. Furthermore, existing studies lack unified requirements for the dose constraints of target volumes and OARs, making it difficult to conduct comparability and consistency analyses among different planning groups. Therefore, this study applied a priority-classified optimization model14,15 —previously proposed by our research group—to NPC VMAT plan design, with a specific focus on evaluating the impact of different MSW parameters on VMAT plan quality.
Materials and Methods
Patient Characteristics
The clinical data of 40 patients with pathologically confirmed NPC, who were treated at the Radiotherapy Center of our hospital between January 2019 and March 2019, were retrospectively selected. The cohort consisted of 26 males and 14 females, ranging in age from 27 to 69 years, with a mean age of 50 years. According to the 2018 staging system of the American Joint Committee on Cancer (AJCC), the tumor stages were distributed as follows: T1 stage in 8 cases (20.0%), T2 stage in 11 cases (27.5%), T3 stage in 12 cases (30.0%), and T4 stage in 9 cases (22.5%).
The inclusion criteria were as follows: (1) pathologically confirmed diagnosis of NPC; (2) receiving radiotherapy for the first time; and (3) no evidence of distant metastasis. The exclusion criteria included: (1) poor general condition accompanied by cachexia; (2) severe dysfunction of major organs, such as the heart, liver, or kidneys; (3) presence of concurrent other malignancies; and (4) inability to tolerate radiotherapy.
CT Simulation
All patients were placed in the supine position and immobilized with a head-neck-shoulder thermoplastic mask. CT simulation was performed using an 85-cm large-bore CT scanner (Siemens, Germany). The scan range extended from the vertex of the skull to 2 cm below the clavicle, with a slice thickness of 3 mm. Following the scan, the CT images were transferred via the network to the Monaco TPS for VMAT plan design.
Target Volume and Organ at Risk Delineation
Target volumes were delineated by a radiation oncologist according to the International Commission on Radiation Units and Measurements (ICRU) Reports 50, 62, and 83. In cases of inconsistency among the three reports, the recommendations of Report 83 16 were adopted. The gross tumor volume of the nasopharynx (GTVnx) was defined as the primary nasopharyngeal tumor extent observed through clinical and imaging examinations, including metastatic retropharyngeal lymph nodes. GTVnd was defined as the enlarged lymph nodes identified clinically and/or radiologically. The clinical target volume (CTV) included CTV1 and CTV2: CTV1 encompassed the GTVnx with a 5-mm margin, and CTV2 was defined by adding a 5-mm margin to CTV1. To account for setup uncertainties, the GTVnx, GTVnd, CTV1, and CTV2 were expanded isotropically in three dimensions by 3 mm to generate the PGTVnx, PGTVnd, PCTV-1, and PCTV-2, respectively. The prescribed doses were 69.96 Gy in 33 fractions for PGTVnx and PGTVnd, 59.4 Gy in 33 fractions for PCTV-1, and 54 Gy in 33 fractions for PCTV-2, delivered using the simultaneous integrated boost technique. For the OARs, the brainstem, temporal lobes, optic chiasm, and optic nerves were expanded isotropically by 3 mm to form their respective planning organ at risk volumes (PRVs). The spinal cord was expanded by 5 mm to generate the PRV-spinal cord.
Dose Limitations Imposed on Organs at Risk

OARs, organs at risk; MAC, maximum acceptance criteria; TMJs, temporomandibular joints; PRV, planning target volume; D0.03cc, an approximate maximum dose for the OARs; Dmean, the mean dose of the organs at risk; D50, the median dose; D2, the near-maximum dose; V30, the relative volume of the OARs receiving over 30 Gy; V60, the absolute volume of the OARs receiving over 60 Gy.
Plan Design and Dose Verification
VMAT plans for the 40 patients were designed by an experienced medical physicist using the Monaco 6.00.11 TPS. A 6 MV X-ray beam was selected. The calculation grid size was set to 0.3 cm, the maximum number of control points per arc to 160, the gantry angle increment to 20°, the Monte Carlo statistical uncertainty to 1%, and the maximum number of arcs to 2. Four VMAT plans were generated for each patient, with the MSW set to 0.5 cm, 0.8 cm, 1.0 cm, and 1.5 cm, respectively. To ensure a rigorous comparison, all other physical and optimization parameters—including fluence smoothing parameters, optimization constraints, penalty weights, Segment Shape Optimization (SSO), and statistical uncertainty—were kept strictly identical across the four plans. The Monaco planning system was utilized to create radiotherapy plans, referencing a priority-classified optimization model. For OARs classified as priority level I, these were prioritized in the optimization process, employing a higher weight function to ensure that these organs met the dose limit requirements, followed by organs at risk of priority levels II, III, and IV in sequential order.
Evaluation Metrics
Based on ICRU Report 83, the evaluated dosimetric metrics for the target volumes and OARs were as follows:
Dosimetric parameters for target volumes included D2, D50, D95, D98, HI, CI, and the fractional volumes receiving specific prescribed doses (V69.96, V59.4, and V54). Specifically, D2 represents the near-maximum dose, D50 is the median dose, D95 is the dose covering 95% of the target volume, and D98 is the near-minimum dose. V69.96, V59.4, and V54 denote the target volumes covered by the prescription doses of PGTVnx, PCTV-1, and PCTV-2, respectively. The HI was calculated using the formula: HI = (D2 - D98)/D50, where a value closer to 0 indicates superior dose homogeneity.17,18 The CI was directly read from the Monaco TPS, with a value closer to 1 indicating better dose conformity. 19
Dosimetric metrics for OARs included Dmax (Gy), D0.03cc (Gy), Dmean (Gy), D2 (Gy), V30 (%), V50 (%), and V60 (cm3). Specifically, Dmax and D0.03cc were analyzed for the brainstem, spinal cord, optic chiasm, temporal lobes, and optic nerves. Dmax and Dmean were assessed for the eyes, parotid glands, inner ears, and oral cavity. Dmax and D2 were evaluated for the mandible and TMJs. The relative volume of the parotid glands receiving over 30 Gy (V30) and the absolute volume of the thyroid receiving over 60 Gy (V60 in cm3) were also recorded.
Gamma (γ) analysis was performed using the ArcCheck device to verify the consistency between the actual delivered dose distribution by the linear accelerator and the calculated dose distribution by the TPS. The passing rate evaluation criteria included 3%/3mm, 3%/2mm, and 2%/2mm. 20 For the 3%/3mm and 3%/2mm criteria, a minimum passing rate of 95% was required, whereas for the stricter 2%/2mm criterion, the minimum passing rate requirement was 85%.16,21,22
Other evaluation metrics included the monitor units (MUs) and the normal tissue volumes receiving 5 Gy, 10 Gy, 15 Gy, 20 Gy, 25 Gy, and 30 Gy (V5, V10, V15, V20, V25, and V30).
Statistical Analysis
Statistical analysis was performed using SPSS 26.0 software. The Shapiro-Wilk test was used to assess the normality of all data. Normally distributed data were expressed as mean ± standard deviation (mean ± SD), and differences among the plan groups were compared using Analysis of Variance (ANOVA). Non-normally distributed data were presented as median (interquartile range, IQR) [M (P25, P75)], and inter-group comparisons were conducted using the Friedman test. Post-hoc pairwise comparisons were performed using Tukey’s test. A P-value < 0.05 was considered statistically significant.
Results
Dosimetric Parameters of Target Volumes
Comparison of Target Volume Data in Treatment Plans for all Patients (
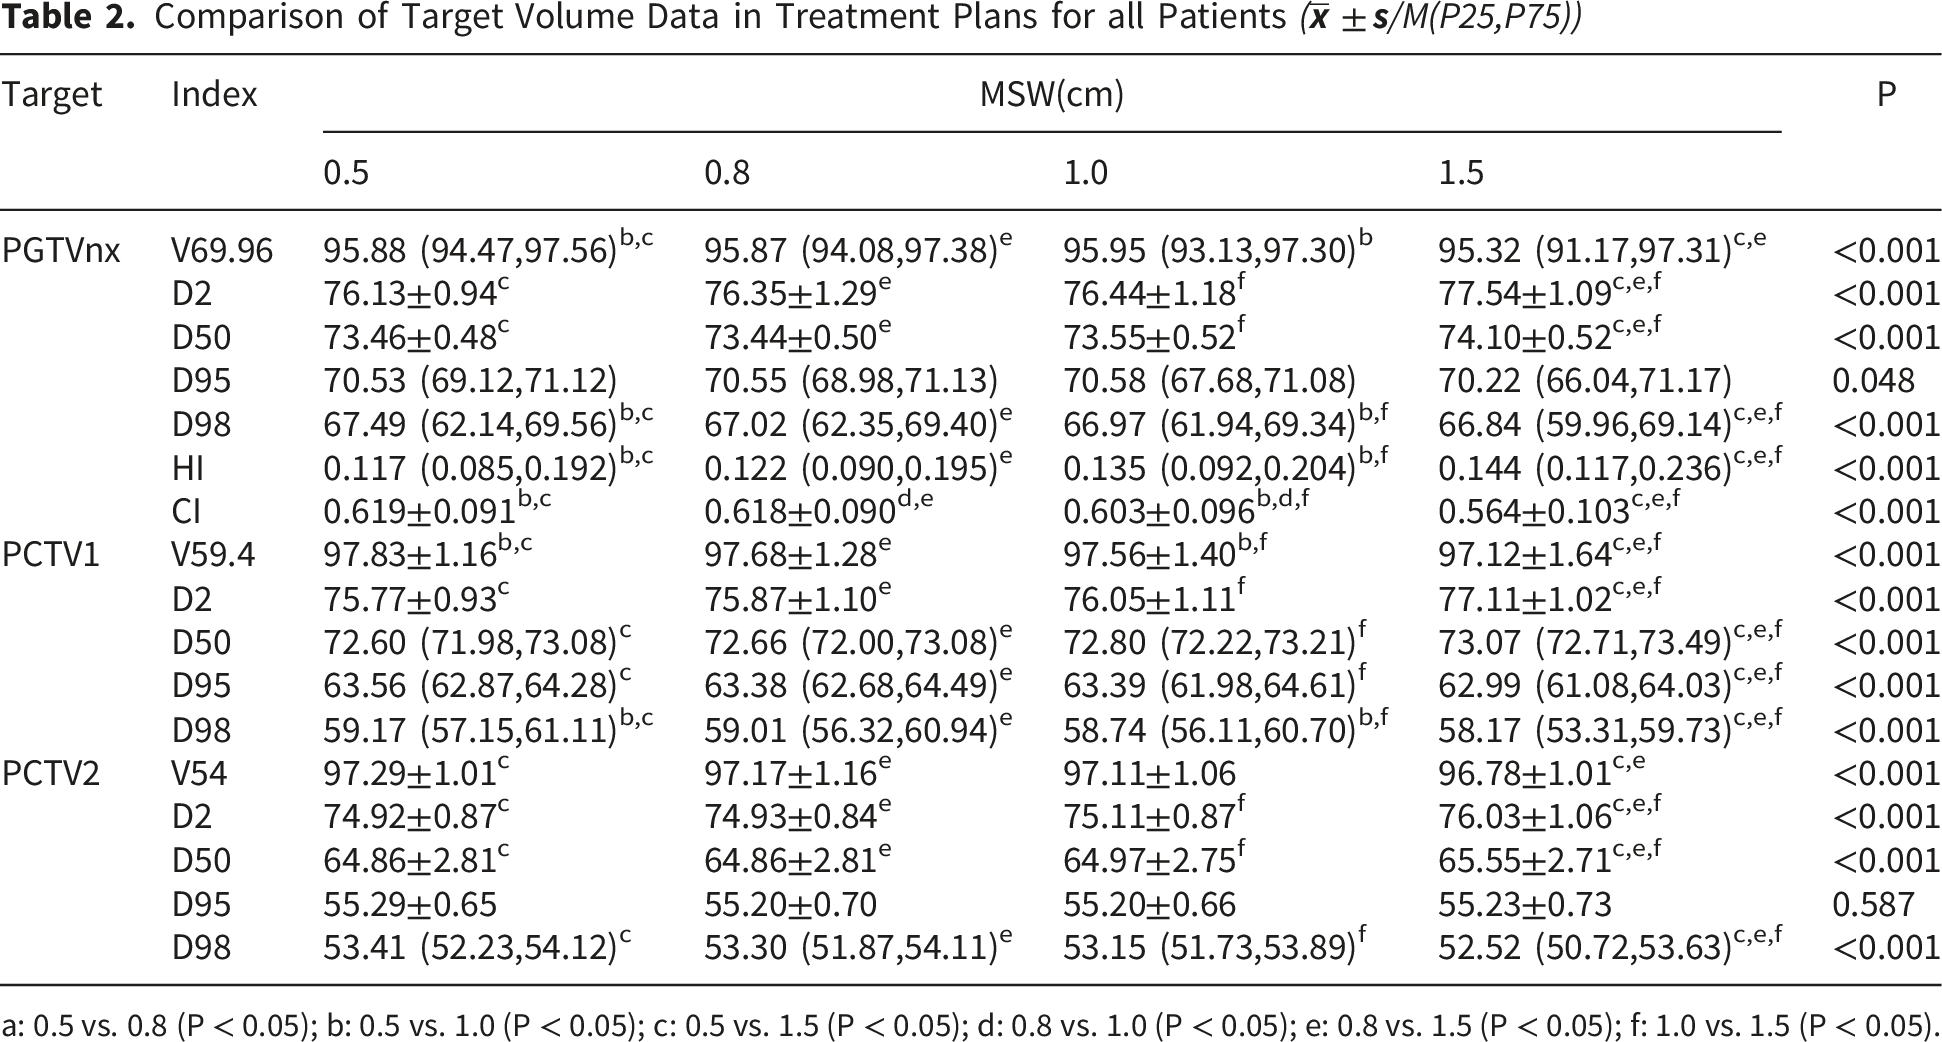
a: 0.5 vs. 0.8 (P < 0.05); b: 0.5 vs. 1.0 (P < 0.05); c: 0.5 vs. 1.5 (P < 0.05); d: 0.8 vs. 1.0 (P < 0.05); e: 0.8 vs. 1.5 (P < 0.05); f: 1.0 vs. 1.5 (P < 0.05).
Statistically significant differences were observed in D2, D50, D98, HI, and CI of the PGTVnx among the four groups (all P < 0.001). These parameters (D2, D50, D98, HI, and CI) were generally comparable between the 0.5 cm and 0.8 cm groups. Notably, the 1.5 cm MSW plan yielded the poorest results in D2, D50, HI, and CI compared with the other three groups.
Comparison of Dosimetric Parameters for OARs
Comparison of Dosimetric Parameters for Grade I/II OARs (M(P25,P75))

a: 0.5 vs. 0.8 (P < 0.05); b: 0.5 vs. 1.0 (P < 0.05); c: 0.5 vs. 1.5 (P < 0.05); d: 0.8 vs. 1.0 (P < 0.05); e: 0.8 vs. 1.5 (P < 0.05); f: 1.0 vs. 1.5 (P < 0.05).
Percentages of Low-Dose Radiation Volumes in all Patients
Supplemental Table 2 shows the percentages of normal body volumes receiving low-dose radiation for the four plan groups. In terms of mean values, the 1.5 cm group exhibited the lowest V5, V10, V15, and V20, whereas these parameters were similar among the 0.5 cm, 0.8 cm, and 1.0 cm plans (all P > 0.05). The V25 and V30 in the 0.5 cm and 0.8 cm groups were lower than those in the 1.0 cm and 1.5 cm groups.
Subgroup Analysis: Comparison of the Four Treatment Plans for T1-2 Patients
Figure 1 depicts the representative isodose distributions and dose-volume histograms (DVHs) of a T1 stage NPC patient for the four plans with different MSWs. Table 4 details the dosimetric parameters of the target volumes, while Table 5 and Supplemental Table 3 present the OAR sparing results for T1-2 patients. Subgroup analysis of T1-2 cases indicated that the prescription dose coverage for all target volumes was ≥ 97% across the four treatment plans. The median V69.96 and V59.4 in the 0.5 cm, 0.8 cm, and 1.0 cm groups were significantly higher than those in the 1.5 cm plan (P=0.015 and P < 0.001, respectively). However, the median V54.12 was similar across all four groups (P = 0.085). Among T1-2 NPC patients, no significant differences were observed in the D95 of PGTVnx among the four groups (P=0.978). For the PGTVnx, the 1.5 cm plan yielded the highest D2 and D50, whereas the 0.5 cm plan yielded the highest D98. Based on both median and mean values, the HI and CI of PGTVnx in the 0.5 cm group were superior to those in the other three plans. The 0.8 cm group delivered lower Dmax to the right temporal lobe and lower doses to the parotid glands(P=0.037,P<0.05), whereas the 1.5 cm plan delivered lower doses to the right inner ear(P=0.002). There were no significant differences among the four treatment plans in terms of Dmax for the brainstem, D0.03cc for the temporal lobes, D0.03cc for the lens, Dmean for the inner ear, Dmax for the oral cavity, and V60 for the thyroid. Dose-volume histogram (DVH) of the 4-modulated VMAT plan for one representative patient.(Line colors represent: red - PGTVnx, magenta - left PGTVnd, yellow - right PGTVnd, dark green - PCTV1, navy blue - PCTV2, olive - brainstem, brown - spinal cord, light green - optic chiasm, dark purple - left optic nerve, lavender - right optic nerve.) Comparison of Target Dosimetric Parameters in T1-2 Stage Patients ( a: 0.5 vs. 0.8 (P < 0.05); b: 0.5 vs. 1.0 (P < 0.05); c: 0.5 vs. 1.5 (P < 0.05); d: 0.8 vs. 1.0 (P < 0.05); e: 0.8 vs. 1.5 (P < 0.05); f: 1.0 vs. 1.5 (P < 0.05). Dosimetric Parameters for Grade I/II OARs in T1-2 Stage Patients ( a: 0.5 vs. 0.8 (P < 0.05); b: 0.5 vs. 1.0 (P < 0.05); c: 0.5 vs. 1.5 (P < 0.05); d: 0.8 vs. 1.0 (P < 0.05); e: 0.8 vs. 1.5 (P < 0.05); f: 1.0 vs. 1.5 (P < 0.05).


As shown in Supplemental Table 4, the 1.5 cm group had lower V5 and V10, while the 0.5 cm group had lower V20 and V25. Compared to the 1.0 cm and 1.5 cm groups, the 0.5 cm and 0.8 cm plans achieved lower V15 and V30. Furthermore, the volume percentages of V15 and V30 were comparable between the 0.5 cm and 0.8 cm plans (P = 0.052, P = 0.357).
Subgroup Analysis: Comparison of the Four Treatment Plans for T3-4 Patients
Comparison of Target Dosimetric Parameters in T3-4 Stage Patients (

a: 0.5 vs. 0.8 (P < 0.05); b: 0.5 vs. 1.0 (P < 0.05); c: 0.5 vs. 1.5 (P < 0.05); d: 0.8 vs. 1.0 (P < 0.05); e: 0.8 vs. 1.5 (P < 0.05); f: 1.0 vs. 1.5 (P < 0.05).
Dosimetric Parameters for Grade I/II OARs in T3-4 Stage Patients (

a: 0.5 vs. 0.8 (P < 0.05); b: 0.5 vs. 1.0 (P < 0.05); c: 0.5 vs. 1.5 (P < 0.05); d: 0.8 vs. 1.0 (P < 0.05); e: 0.8 vs. 1.5 (P < 0.05); f: 1.0 vs. 1.5 (P < 0.05).
For T3-4 patients, the D2 and D50 of PGTVnx were highest in the 1.5 cm plan(P<0.001,P=0.006), whereas the D95 and D98 were lowest in this plan(all P<0.001). Based on mean values, the 0.5 cm plan exhibited the best homogeneity and conformity. The coverage of PCTV1 and PCTV2 was > 96% across all four MSW groups. As the MSW increased, the D2 and D50 of PCTV1 and PCTV2 showed an overall increasing trend, whereas the D98 demonstrated an overall decreasing trend. None of the Level I OARs exceeded the maximum dose limits. Based on mean and median values, the 0.5 cm group delivered a lower dose to the spinal cord, while the 1.5 cm group delivered a lower dose to the right optic nerve (PRV). All Level III OARs were within the dose limits. For the parotid glands, TMJs, and oral cavity, the 1.5 cm MSW resulted in higher doses. As shown in Supplemental Table 6, significant differences were observed among the four plans regarding V5-25. Based on mean values, the V5-25 in the 1.5 cm group were significantly lower than those in the other three groups (all P < 0.05), whereas the V30 was similar across the four plans (P = 0.218).
Monitor Units (MUs) and Gamma Passing Rates of Plans With Different MSWs
Comparison of MUs Across Treatment Plans (

a: 0.5 vs. 0.8 (P < 0.05); b: 0.5 vs. 1.0 (P < 0.05); c: 0.5 vs. 1.5 (P < 0.05); d: 0.8 vs. 1.0 (P < 0.05); e: 0.8 vs. 1.5 (P < 0.05); f: 1.0 vs. 1.5 (P < 0.05).
Supplemental Table 7 shows that among all NPC patients, the pass rates for the four different MSW VMAT plans were greater than 95% for the 3/3 and 3/2 standards, and greater than 85% for the 2/2 standard. The pass rates for the 0.5 cm group were significantly lower than those of the 0.8 cm, 1.0 cm, and 1.5 cm groups (all P < 0.001). Similar results were observed in the subgroup analyses for T1-2 and T3-4.
Discussion
This study systematically investigated the impact of the MSW parameter on the VMAT plan quality for NPC. The results demonstrated that different MSW parameters significantly affect the conformity and homogeneity of the dose distribution, OAR sparing, treatment efficiency, and machine performance.
Our study revealed that a smaller MSW (e.g., 0.5 cm) outperformed larger MSWs in terms of dose HI and CI in the target volumes, especially in patients with advanced-stage NPC. Wang et al 23 reported similar findings in their study exploring the optimal MSW for breast cancer radiotherapy plans. This can likely be attributed to the dose gradient and the precise dose modulation by the MLC. A smaller MSW enables the MLC to modulate the dose more finely during treatment, accurately covering the target margins. This precise control can reduce dose spillage into the OARs, making it more suitable for complex anatomical regions such as the nasopharynx. However, this advantage is accompanied by the need for the MLC to frequently change segment shapes and directions, thereby increasing the machine workload and MUs. 24 Therefore, a balance between delivery accuracy and treatment efficiency must be struck in clinical applications.
For the unstratified overall patient cohort, the PGTVnx coverage across the different MSW plans generally met the clinical prescription dose requirements (>95%). As the MSW increased, the dose to the spinal cord (a Level I OAR) showed an overall increasing trend, with the 0.5 cm MSW yielding the lowest median dose (P < 0.001). Identical results were observed in both subgroup analyses. A previous study based on the Monaco TPS 13 regarding the impact of MSW on cervical cancer plan quality showed that the spinal cord dose decreased as the MSW increased, which contradicts our findings. This indicates that the impact of MSW on the same OAR may vary across different cancer types. We hypothesize that this discrepancy is due to the greater anatomical distance between the spinal cord and the cervical tumor targets. Regarding the doses to Level III/IV OARs, the doses to most OARs, such as the lenses and eyes, were within the constraint limits, whereas the doses to the parotid glands, right inner ear, and oral cavity exceeded the tolerance limits. In this context, an MSW of 0.5 cm provided superior sparing for these specific OARs.
In patients with early-stage (T1-2) NPC, the coverage of all target volumes exceeded 97%. Although the doses to the parotid glands and the right inner ear were relatively high, the 0.5 cm and 0.8 cm MSWs demonstrated similar sparing effects on the parotid glands. Taking the MUs of the two plan groups into consideration, we conclude that an MSW of 0.8 cm is more appropriate for VMAT plan design in T1-2 NPC patients.
For patients with advanced-stage (T3-4) NPC, there is a high probability of tumor invasion into the skull base or even intracranially, placing the targets in close proximity to Level I OARs. Imposing strict high-dose constraints on the target volumes easily leads to radiation overdose in critical structures such as the brainstem, making it difficult to strike a planning balance among various optimization criteria. Therefore, our study utilized a priority-classified optimization model during plan design, strictly prioritizing Level I OARs (e.g., the brainstem and spinal cord) before considering PTV dose coverage. However, during the planning process, we found that restricting the doses of Level I OARs to an ideal range resulted in target coverage falling far below 95%, which is detrimental to the tumor control of NPC. Consequently, this study adhered to the principle of delivering a complete tumoricidal dose while keeping OAR doses within their maximum tolerance limits. By relaxing the dose constraints of Level I OARs to approach their maximum tolerance, the target coverage improved, albeit still not reaching 95%.
In actual clinical practice, balancing the risk of local recurrence of locally advanced NPC (T3-4) due to inadequate dose coverage of the tumor target area with the potential damage to OARs presents a challenging problem. When the target area is in close proximity to critical structures such as the brainstem or spinal cord, international guidelines 14 permit the existence of “acceptable minmum dose,” allowing for a PTV. This is a mandated trade-off to strictly prevent fatal radiation-induced necrosis of these critical neural structures. Within this context, the difference between the 94.26% coverage (achieved by the 0.5 cm MSW) and the 92.45% coverage (achieved by the 1.5 cm MSW) is clinically highly significant. According to radiobiological principles, an absolute reduction of ∼1.8% in tumor coverage creates ‘cold spots’ that can drastically reduce the Tumor Control Probability (TCP) and increase the risk of local recurrence. 25 Therefore, 94.26% represents a much safer and more effective compromise. Furthermore, for these complex cases where VMAT coverage is constrained, clinical dose escalation strategies should be considered, such as implementing Adaptive Radiotherapy (ART) to re-plan once the tumor shrinks away from critical structures, 26 or utilizing more advanced modalities like TomoTherapy or Proton therapy to achieve safely escalated doses.
Considering the risk of radiation-induced second primary malignancies (SPMs), this study also evaluated the irradiated volumes of normal tissues exposed to low-dose radiation across different plans. We found that larger MSWs (e.g., 1.5 cm) offered advantages in controlling low-dose radiation volumes (V5-V15), whereas smaller MSWs (e.g., 0.5 cm) provided superior sparing in high-dose regions. However, the long-term effects of low-dose radiation on normal tissues require further investigation, particularly regarding the potential risk of SPMs following radiotherapy.27-29
Furthermore, we observed that while a smaller MSW facilitated the precise control of dose distribution, it simultaneously increased the MUs. This is primarily because, under a small MSW setting, the area covered by the output dose of each control point is smaller, thereby requiring more control points to complete the coverage of the entire treatment region. 30 Consequently, in clinical practice, an increase in MUs leads to prolonged treatment delivery times.
The selection of different MSWs also exerted a certain impact on plan passing rates. Although the passing rates of all four plans were relatively high, the Gamma passing rate of the 0.5 cm plan was significantly lower than those of the other groups. A similar result was reported by Wang et al 23 This may be attributed to the fact that smaller MSWs rely more heavily on the high-precision mechanical control of the delivery system during the output and accumulation of physical doses. Therefore, even if a more precise dose distribution is achieved with a small MSW, it is relatively difficult to attain the high quality assurance (QA) passing rates seen in larger MSW groups.
It should be noted that the latency period for radiation-induced SPMs is at least 5 years, typically ranging from 15 to 20 years. 31 Furthermore, patient-specific factors may also contribute to the development of SPMs, making it difficult to independently estimate the isolated impact of low-dose radiation on SPM incidence. Compared to dosimetric metrics for target volumes and OARs—which are directly related to treatment quality—MUs and passing rates are parameters closely associated with the linear accelerator. Therefore, we prioritized these two criteria after the Level IV OARs during plan evaluation.
Our results indicate that for the overall cohort of NPC patients, the optimal MSW for VMAT plan design is recommended to be 0.5 cm. However, further subgroup analyses suggest that 0.8 cm is optimal for T1-2 patients, whereas 0.5 cm is better suited for T3-4 patients. We hypothesize that the discrepancy in the recommended optimal parameters between the overall cohort and the subgroups is likely because the inclusion of T3-4 patient data skewed the overall data trend. This implies that the selection of the optimal MSW is intrinsically correlated with the tumor stage of NPC patients. Therefore, we recommend tailoring the MSW parameter based on the patient’s T stage to design a more rational and individualized radiotherapy plan.
Limitations
Although the findings of this study are insightful, several limitations should be acknowledged. First, due to the complexity of nodal (N) staging in NPC, it was not accounted for during patient selection. Given that the primary tumor (T) stage is directly correlated with treatment planning and prognosis, our analysis was primarily based on the T classification. This methodological choice may limit the generalizability of our findings, as it fails to fully capture the potential impact of the N stage on dosimetric outcomes and treatment efficacy. Second, the relatively small sample size and the retrospective nature of this study may introduce inherent data bias and limit the statistical robustness of the results. Therefore, future prospective studies with larger cohorts and more comprehensive staging evaluations are warranted to validate our findings and enhance the reliability of the conclusions.
Conclusions
The MSW significantly affects the quality of VMAT plans for NPC. For patients with early-stage (T1-2) NPC, the prescription dose coverage for the PTVs exceeded 95% across all four MSW plans. While MSWs of 0.5 cm and 0.8 cm demonstrated superior sparing of the parotid glands, the 0.8 cm setting required a shorter treatment delivery time. Therefore, an MSW of 0.8 cm is recommended for VMAT plan design in T1-2 patients. Conversely, for patients with advanced-stage (T3-4) NPC, none of the four plans achieved the 95% prescription dose coverage for the PTV; consequently, more advanced, higher-precision radiotherapy modalities are recommended for this patient subgroup. However, if VMAT is clinically selected, configuring the MSW to 0.5 cm is recommended for plan optimization to maximize target coverage.
Supplemental Material
Supplemental Material - The Effect of Minimum Segment Width on The Quality of Nasopharyngeal Cancer VMAT Plans Using a Priority Classified Plan Optimization Model
Supplemental Material for Impact of Minimum Segment Width on VMAT Plan Quality for Nasopharyngeal Carcinoma by Zhengfei Li, Jie Yang, Yongyuan Xue, Hailong Li, Xuhong Liu, Feihu Chen, Yijiang Li and Wei Xiong in Dose-Response.
Supplemental Material
Supplemental Material - The Effect of Minimum Segment Width on The Quality of Nasopharyngeal Cancer VMAT Plans Using a Priority Classified Plan Optimization Model
Supplemental Material for Impact of Minimum Segment Width on VMAT Plan Quality for Nasopharyngeal Carcinomaby Zhengfei Li, Jie Yang, Yongyuan Xue, Hailong Li, Xuhong Liu, Feihu Chen, Yijiang Li and Wei Xiong in Dose-Response.
Supplemental Material
Supplemental Material - The Effect of Minimum Segment Width on The Quality of Nasopharyngeal Cancer VMAT Plans Using a Priority Classified Plan Optimization Model
Supplemental Material for Impact of Minimum Segment Width on VMAT Plan Quality for Nasopharyngeal Carcinoma by Zhengfei Li, Jie Yang, Yongyuan Xue, Hailong Li, Xuhong Liu, Feihu Chen, Yijiang Li and Wei Xiong in Dose-Response.
Supplemental Material
Supplemental Material - The Effect of Minimum Segment Width on The Quality of Nasopharyngeal Cancer VMAT Plans Using a Priority Classified Plan Optimization Model
Supplemental Material for Impact of Minimum Segment Width on VMAT Plan Quality for Nasopharyngeal Carcinoma by Zhengfei Li, Jie Yang, Yongyuan Xue, Hailong Li, Xuhong Liu, Feihu Chen, Yijiang Li and Wei Xiong in Dose-Response.
Footnotes
Author Contributions
Li was responsible for manuscript editing. Li and Xiong performed the conception of the study. Yang and Li were engaged in manuscript preparation. Xue and Li were involved in statistical analysis. Liu and Chen participated in study design and review. All authors read and approved the final manuscript.
Funding
The authors received no financial support for the research, authorship, and/or publication of this article.
Declaration of Conflicting Interests
The authors declared no potential conflicts of interest with respect to the research, authorship, and/or publication of this article.
Supplemental Material
Supplemental material for this article is available online.
References
Supplementary Material
Please find the following supplemental material available below.
For Open Access articles published under a Creative Commons License, all supplemental material carries the same license as the article it is associated with.
For non-Open Access articles published, all supplemental material carries a non-exclusive license, and permission requests for re-use of supplemental material or any part of supplemental material shall be sent directly to the copyright owner as specified in the copyright notice associated with the article.