
Abstract

Introduction
Fluoroquinolones are a kind of medication that is often used in therapeutic settings. When exposed to environmental sunlight, the medications react, with UV radiation accounting for approximately 90% of the solar UV radiation that reaches the earth’s surface. One of the elements that contributes to the development of unfavorable pharmacological side effects is the UVR. 1 Drugs have the ability to cause photosensitization reactions in both situations where UVB radiation penetrates the dermis and reaches dermal blood flow. Fluoroquinolone medications are widely used, and new uses for them make it crucial to comprehend how they affect human safety. 2 The mouse fibroblast (L929) cells are derived from a clone of a normal male mouse that has both adipose tissue and subcutaneous areolar tissue. In this study, we investigate the medication nalidixic acid’s phototoxicity towards L929 cells. As broad-spectrum antibiotics, fluoroquinolones work against both gram-positive and gram-negative bacteria. 3 Due to its widespread use in urinary tract disorders, nalidixic acid enters the environment, impacts trophic levels in animals, and enters the human body. Several investigations have shown that when nalidixic acid was exposed to either UV or visible light, it produced a drug-induced adverse cutaneous reaction. The level of immunotoxic enzymes and antioxidants in rat tissues was reduced by the fluoroquinolone medication. 4 In addition to their role in stress signaling in normal cells, reactive oxygen species (ROS) produced by mitochondria also play a role in the start of nuclear or mitochondrial DNA alterations that lead to neoplastic transformation. 5 Drug phototoxicity is primarily caused by the generation of excessive ROS and apoptotic effect. 6 According to Biswas, 7 oxidative stress and inflammation are frequently connected in pathophysiological processes. In my knowledge there is little studies confirmed the harmful effects of nalidixic acid under UV-B exposure on L929 cells. In this study we determined the role of nalidixic acid in sensitivity and toxicity under UVB irradiation on L929 cells.
Materials and Methods
Chemical and Reagents
Nalidixic acid (N8878), chlorpromazine (C8138), RNO, NBT, TBA, trichloroacetic acid, NADPH and L- histidine were purchased from Sigma Aldrich USA. Other chemicals were purchased from local market, Riyadh Saudi Arabia.
Experimental Design
Nalidixic acid was dissolved in Milli-Q double-distilled deionized water. We examined the potential for generating chemically reactive oxygen species (ROS), conductivity, pH, and absorption spectra. In this experiment, a positive photosensitizer called rose bengal is used. The trials involved exposing participants to UV-B radiation for 30 min.
The UV340B UV light meter (Starmeter Instruments Co., Ltd. Guangdong, China) was used to measure the UV-B radiation intensities in sun-shine. Based on dosimetry conducted outside our laboratory between 9.30 and 10.30 a.m. from January to April 2021, the irradiation intensities chosen were in line with the ambient UV-B intensities that reached in sunlight in Riyadh, Saudi Arabia (latitude 24.774265 and longitude 46.738586). UV-B mean intensities of 1.40 ± 0.6 mW/cm2 were employed in the experiment. During the exposure periods, the temperature ranged from 27-36°C and the relative humidity from 38%-45%. Corning glass petri plates (15 × 60 mm) were used to prepare two sets of reaction mixtures, each with three replicates. While the other set was kept in the dark as an unexposed control, one set was exposed to sunshine with the lid open. Exposure to sunlight was done on bright, sunny days. Petri dishes were maintained in a platform encircled by ice packs (Polar Tech Industries, USA) to avoid any temperature changes that would occur from exposure to sunshine. Two repetitions of the experiment were conducted again.
Photochemical Assays
Measurement of Singlet Oxygen (1O2) Generation
Reaction mixture having N, N-dimethyl-p-nitrosoaniline (RNO, 3.5 × 10⁻⁵ M), histidine (10−2 M) and nalidixic acid and chlorpromazine (80 mg/L) in 0.01 M phosphate buffer (pH 7.4) was exposed under UVB 20 min. The bleaching of RNO was recorded spectrophotometrically at 440 nm against the control. 8
Measurement of Superoxide (O2−) Generation
Reaction mixture having nitro blue tetrazolium (NBT, 1.67 × 10⁻⁴ M) and nalidixic acid, and chlorpromazine (80 mg/L) in 0.01 M carbonate buffer (pH 10.0) was exposed under UVB, for 10 min. Reduction of NBT to nitro blue formazan was observed at 560 nm. 8
Measurement of •OH Radicals
The generation of hydroxyl (•OH) radicals was determined according Cohen 9 method. The samples were then assayed for formaldehyde formation by the method proposed by Nash. 10 The production of formaldehyde was monitored at 412 nm. Further the quenching of •OH was performed by adding mannitol (0.5 M) and sodium benzoate (0.5 M) as specific quenchers.
Photo Peroxidation of Linoleic Acid
Linoleic acid solution was freshly prepared in phosphate buffer saline (0.01 M, pH = 7.2) using 0.05% tween-20 as an emulsive agent. Solution containing 0.8 mM linoleic acid and different concentration of nalidixic acid (1-120 µg/ml) were irradiated under UVB radiation. UVB radiation induced peroxidation of linoleic acid was measured through the increase in absorbance at 233 nm. 11 Linoleic acid peroxidation caused by nalidixic acid, was further confirmed by SOD. 12
Cell Culture
The mouse fibroblast cell line L929 was grown in DMEM culture medium with 10% FBS and antibiotic-antimycotic solution (1%) at CO2 (5%) and RH (95%) at 37°C in CO2 incubator.
Photo Toxicity Assay
MTT Assay
The MTT assay is based on the protocol described by Ali et al, 8 with minor modifications. Briefly, cells (2 × 10⁴) were seeded per well in 96-well plates and kept in the CO2 incubator for 24 h at 37°C before to experiment for the proper growth of cells. The medium was replaced by HBSS containing nalidixic acid, (1-120 µg/ml) for exposure purpose and exposed UVB (1.4 mW/cm2) irradiation for 20 min and cells were incubated in CO2 incubator for overnight. After incubation the HBSS was replaced by complete medium (200 µl) containing MTT (5 µg/ml) per well. The culture plates were kept in the CO2 incubator for 4 h. After incubation, the culture plates were washed twice with HBSS and 200 µl of DMSO was added to each well by pipetting up and down to dissolve the content. The absorbance was recorded at 530 nm by using multi-well microplate reader (BioTek Synergy H1 Multi-Mode Microplate Reader 309715, MD, USA). Chlorpromazine (5.0 µg/ml) and l-histidine (100 µg/ml) were used as positive and negative controls, respectively.
Neutral Red Uptake (NRU) Assay
The NRU (neutral red uptake) assay is based on the initial protocol described by Alarifi et al, 13 and determines the accumulation of the neutral red dye in the live lysosomes. Briefly, cells (2 × 10⁴) were seeded per well in 96-well plates and kept in the CO2 incubator for 24 h at 37°C before to experiment for the proper growth of cells. The medium was replaced by HBSS containing nalidixic acid, (1-120 µg/ml) for exposure purpose and exposed UVB (1.4 mW/cm2) irradiation for 20 min and cells were incubated in CO2 incubator for overnight. After incubation, HBSS was replaced by complete medium (DMEM F-12HAM) containing neutral red dye (50 µg/ml) and incubate for 3 h, followed by a quick wash with fixative (1%, w/v CaCl2; 0.5%, v/v formaldehyde) to remove the unbounded dye. The accumulated dye was extracted with 50% ethanol containing 1% (v/v) acetic acid and plates were kept for 20 min on a shaker. The absorbance was recorded at 540 nm by using multi-well micro plate reader (BioTek Synergy H1 Multi-Mode Microplate Reader 309715, MD, USA).
Determination of Intracellular ROS Generation
The generation of ROS in L929 cells due to exposure of nalidixic acid (8 μg/mL) under UVB (1.4 mW/cm2) irradiation was done using H2DCFDA according to methods described by Ali et al. 14 The cells were cultured (2 × 10⁴ cells/well) in 96-well black plates for 20 h and then treated with nalidixic acid, and exposed UVB (1.4 mW/cm2) irradiation for 20 min and cells were incubated in CO2 incubator for overnight. After exposure H2DCFDA (20 μM) was added to the cells for 30 min. After incubation, the culture plate was washed with chilled PBS and the fluorescence of dichlorofluorescein was evaluated using a plate reader (BioTek Synergy H1 Multi-Mode Microplate Reader 309715, MD, USA) at 485 nm excitation and 535 nm emissions.
For qualitative analysis of ROS generation in cells due to nalidixic acid, under UVB irradiation, we have simultaneously set-up another experiment in a 6-well transparent plate (1 × 10³ cells/well) and intracellular ROS generation was monitored using a fluorescent microscope (Olympus CKX41; Olympus: Center Valley, Pennsylvania), with images taken at ×40 magnification.
Evaluation of Caspase-3 Activity
L929 cells were exposed to nalidixic acid (8 μg/mL) and UVB (1.4 mW/cm2) radiation for 20 min, and the cells were then cultured in a CO2 incubator for the entire night to observe the impact on caspase-3 activity. Following the manufacturer’s instructions, a colorimetric kit (Cayman Chemical) was used to measure the amount of caspase-3 activity in L929 cells.
Phosphatidylserine Translocation by Annexin V- FITC and PI Staining
To observe the translocation of PS (indication of early apoptosis) in L929 cells due to exposure of nalidixic acid, (8 μg/mL) UVB (1.4 mW/cm2) irradiation for 20 min and cells were incubated in CO2 incubator for overnight. Staining was performed according to the kit manufacturer’s instructions (Santa Cruz Biotechnology, Santa Cruz, CA, USA). Briefly, cells were suspended in 200 μL of binding buffer and incubated with 5 μL of Annexin V-FITC for 30 min at room temperature. Finally, 10 μL of propidium iodide was added and stained cells were examined using confocal microscope.
Single Cell Gel Electrophoresis (SCGE) Assay
L929 cells were subjected to nalidixic acid (8 μg/mL) and UVB (1.4 mW/cm2) radiation for 20 min, which caused DNA damage. The cells were then cultured in a CO2 incubator for the entire night. Three layers were used to carry out the alkaline single cell gel electrophoresis (SCGE). 8. The percentage of tail DNA was one of the metrics used to quantify DNA damage in cells. For every experiment, pictures of 50 randomly selected cells 25 from each replicate slide were examined.
Statistical Analysis
For every experiment, a minimum of three separate experiments were conducted in duplicate. One-way analysis of variance (ANOVA) was used to evaluate the data, which were presented as mean (±S.E.). A P-value of greater than 0.05 was deemed statistically significant.
Results
Photochemical Production of 1O2, O2•−, and •OH Radicals
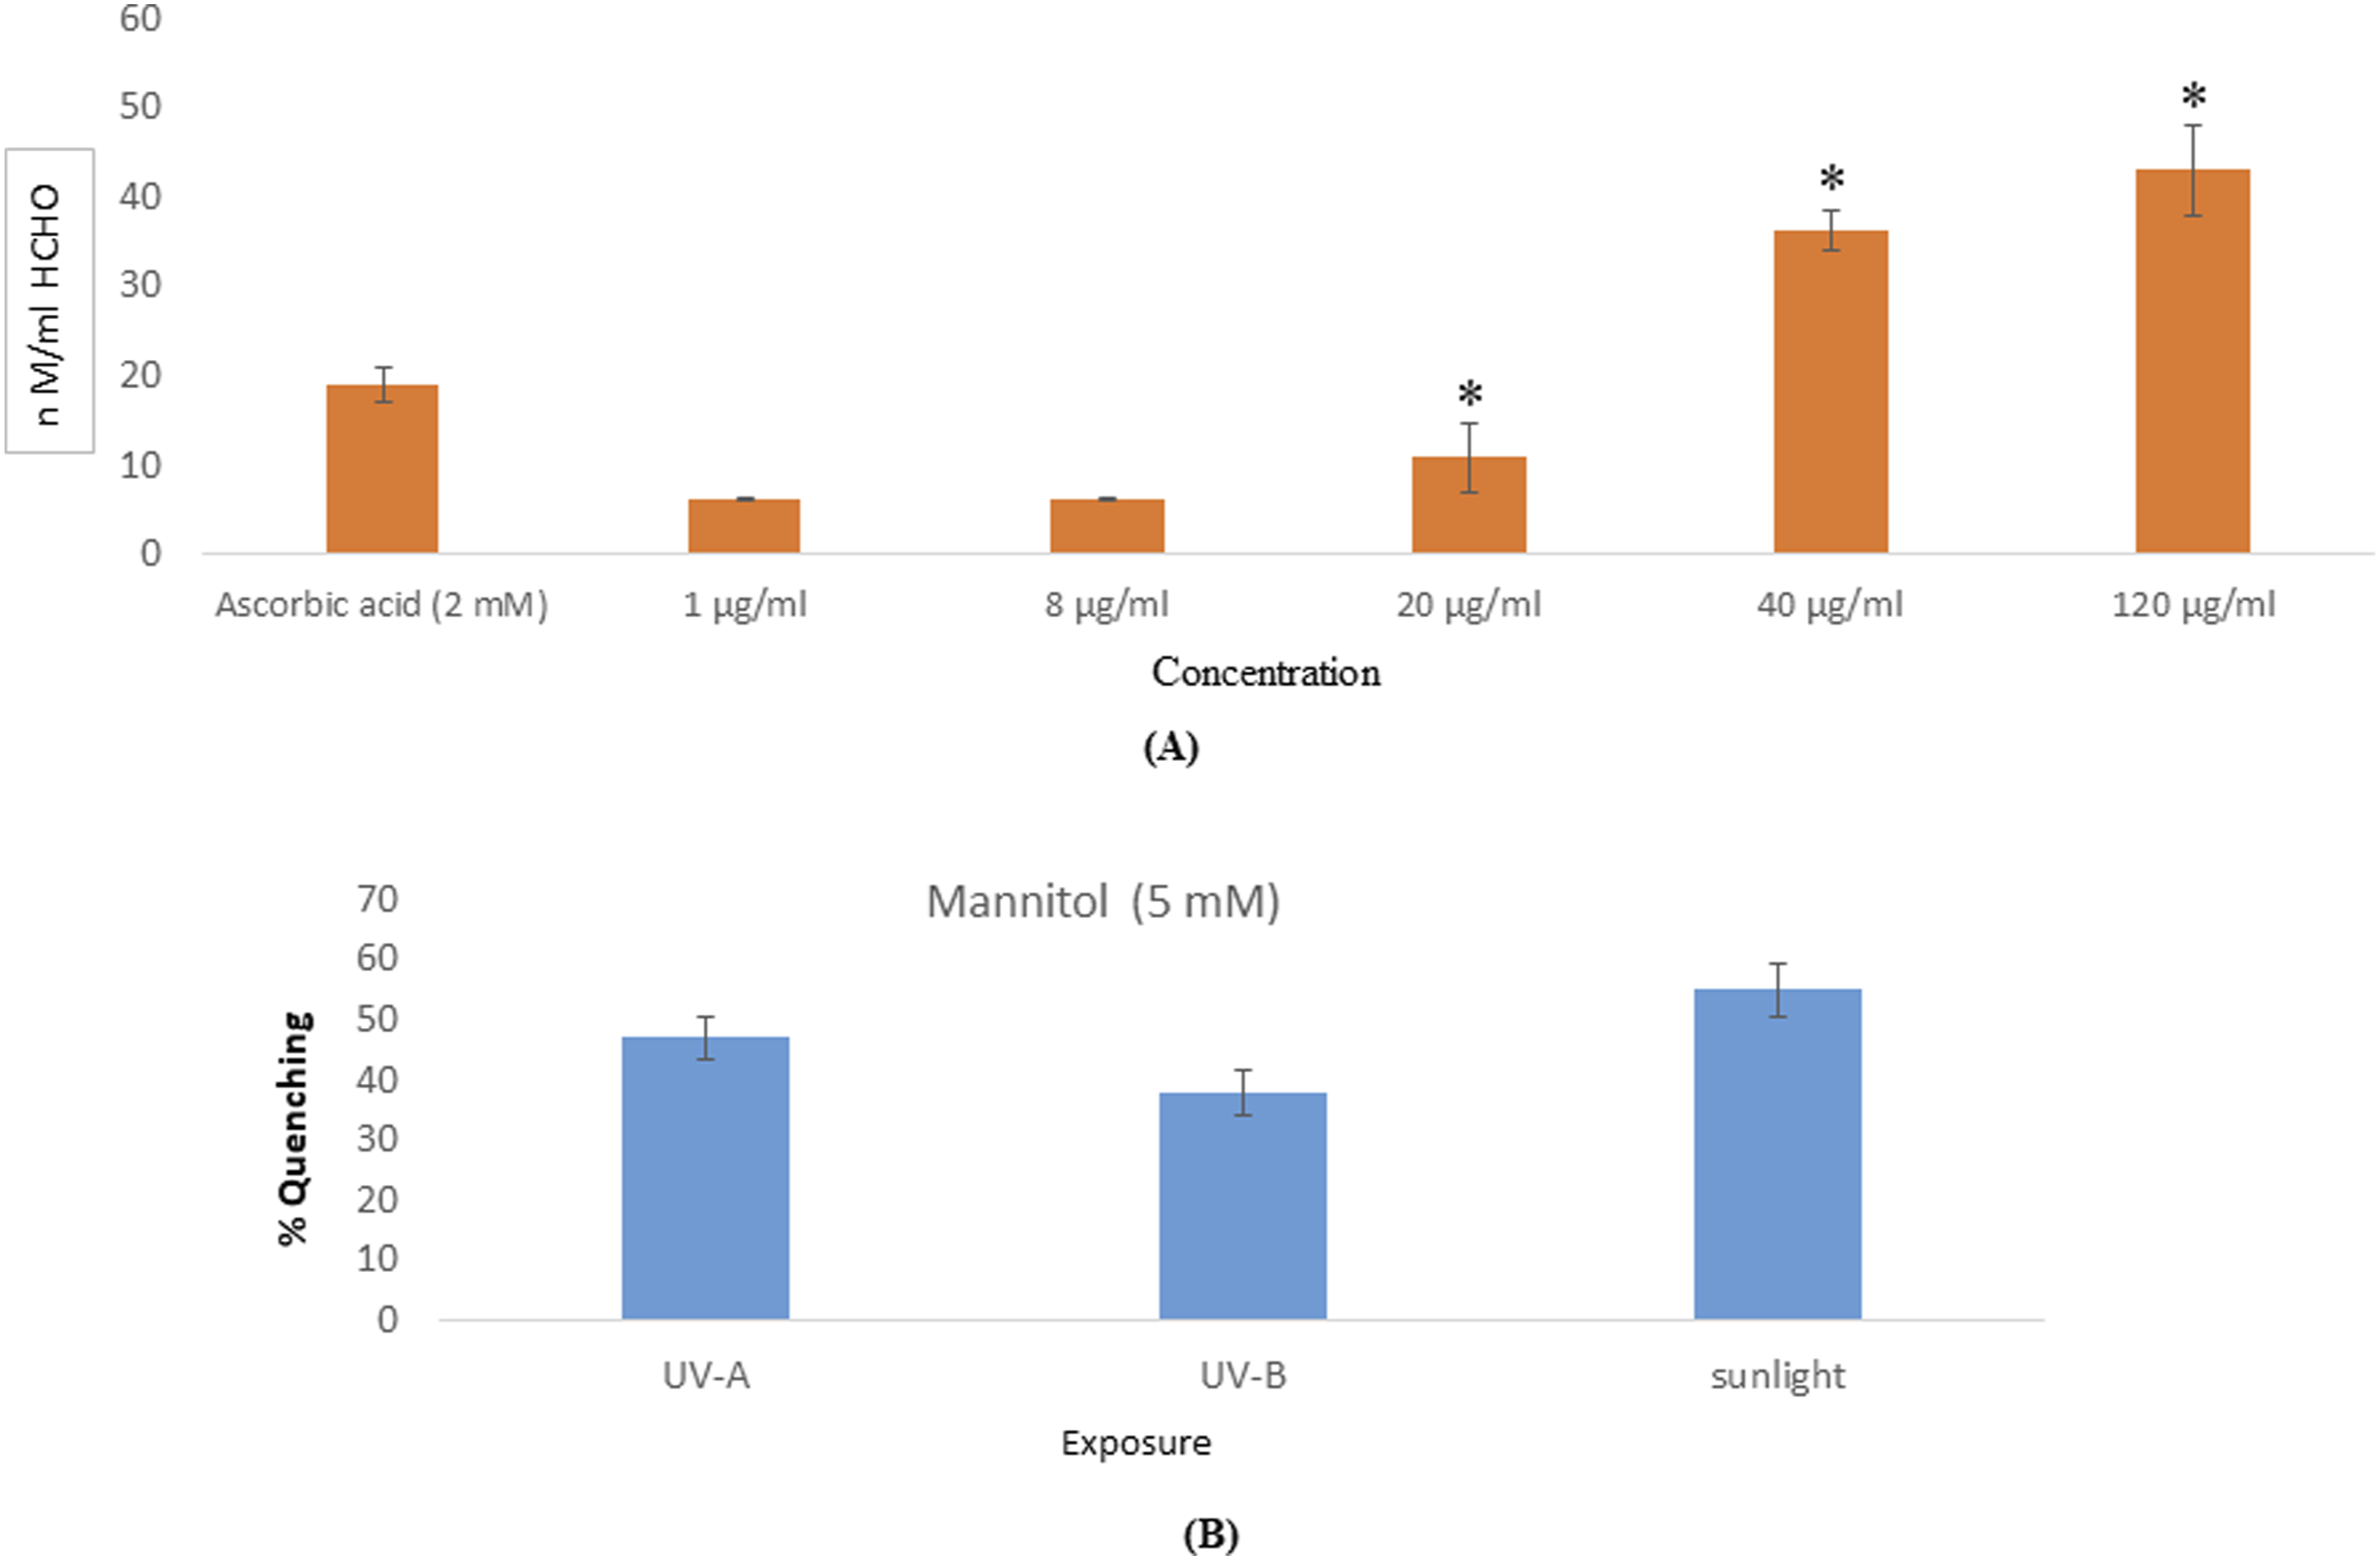
UV-B irradiation induced photosensitization of nalidixic acid and generated free radicals such as 1O2, (Figure 1), O2•− (Figure 2), and •OH (Figure 3) in a concentration-dependent manner. At lower concentration, generation of free radicals was not significant but at higher concentrations, significantly generated free radicals. Generation of singlet oxygen (1O2) due to nalidixic acid under UVB exposure, showed an irregular increase starting from the lowest to highest concentrations (Figure 1). Significant generation of O2•− was observed in all the concentrations of nalidixic acid under UVB exposure (Figure 2). The generation of •OH radical was observed lower concentration (1 μg/ ml) and highest at 120 μg/ ml of nalidixic acid, under UVB exposed samples (Figure 3). (A) Photochemical generation of 1O2 under UVB (1.4 mW/cm2) by Nailidixic acid at various concentrations. Rose Bengal used as positive control. (B) Percent photochecmical quenching of 1O2 under UVB (1.4 mW/cm2) at Nailidixic acid (80 µg/ml). Each value represents the mean ±SE of three experiments. *P < 0.05 vs control. (A) Photochemical generation of O2− under UVB (1.4 mW/cm2) by Nailidixic acid at various concentrations. Rose Bengal used as positive control. (B) Percent photochecmical quenching of 1O2 under UVB (1.4 mW/cm2) at Nailidixic acid (80 µg/ml). Each value represents the mean ±SE of three experiments. *P < 0.05 vs control. (A) Photochemical generation of •OH under UVB (1.4 mW/cm2) by Nailidixic acid at various concentrations. Ascorbic acid used as positive control. (B) Percent photochecmical quenching of •OH under UVB (1.4 mW/cm2) at Nailidixic acid (80 µg/ml). Each value represents the mean ±SE of three experiments. *P < 0.05 vs control.

Photochemical Peroxidation of Linoleic Acid
Linoleic acid generation was observed due to co-exposure of nalidixic acid UV-B irradiation in a concentration-dependent manner (Figure 4). At lower concentration, linoleic acid generation was not significant but at higher concentrations, it was significantly generated. (A) Photochemical generation of linoleic acid under UVB (1.4 mW/cm2) by Nailidixic acid at various concentrations. (B) Photochecmical quenching of linolic acid (0.8 mm) peroxidation by SOD (25 and 50 U/ml) under UVB (1.4 mW/cm2). Each value represents the mean ±SE of three experiments. *P < 0.05 vs control.
Cell Viability
Cytotoxicity of L929 cells due to exposure of nalidixic acid was increased under UVB exposure. Nalidixic acid induced cell death in L929 cell lines under UVB exposure. The result of the cell viability is presented in Figure 5. The % cell viability of L929 cell lines was assessed by using MTT and NRU assays, due to co-exposure of nalidixic acid at concentrations of 1, 8, 20, 40, 80, and 120 μg/mL was found 99.83, 90.8, 82.09, 78.44, 65.17, and 58.73 % (Figure 5A) and 99.0, 95.2, 91.10, 80.50, 80.68, and 47.38 % (Figure 5B) for 24 h. Maximum toxicity of nalidixic acid was observed in L929 cells at 120 µg/ml under UVB exposure in both tests (Figure 5). Cytotoxicity of Nailidixic acid on L929 cells under UVB (1.4 mW/cm2) by using (A) MTT (B) NRU tests. Chlorpromazine (5 µg/ml) and L-histidine (20 µg/ml) were used as positive and negative control, respectively. Each value represents the mean ±SE of three experiments. *P < 0.05 vs control.
UVB-Excited Nalidixic Acid Increases the Generation of ROS inside Cells
Nalidixic acid induced intracellular ROS in L929 cells in dose dependent manner under UVB irradiation (Figure 6). The intensity of DCF fluorescence (%) in L929cells was measured under UVB (Figure 6A). Dark control did not show DCF fluorescence, while experimental sets showed significant increase in fluorescence due to increased oxidative stress and intracellular ROS generation (Figure 6A and B). Maximum ROS were observed under UVB at nalidixic acid (8 μg/mL) (Figure 6A). Photomicrograph of cells showed enhanced green fluorescence under UVB plus nalidixic acid (8 μg/mL) exposed cells as compared to dark control (Figure 6B). Production of intracellular ROS in L929 cells due to nailidixic acid under UVB (1.4 mW/cm2) by using (A). Percnet of DCF fluorescence intensity and generation of green fluorescence in L929 cells for 24 h (B). L929 cells under dark (C). L929 cells at UVB + HBSS (D). L929 cells at dark + 8 µg/ml (E). L929 cells at 80 µg/ml + UVB each value represents the mean ±SE of three experiments. *P < 0.05 vs control.
Caspase-3 Activity
Caspase-3 activity in the L929 cells increased significantly. Results showed 0.24, 0.15, and 1.19 (a.u) for UVB alone, nalidixic acid alone and nalidixic acid + UVB exposures, respectively (Figure 7). In this study caspase-3 activity were compared with the control group and showed significant increase in caspase-3 activity (Figure 7). Nailidixic acid under UVB (1.4 mW/cm2) induced caspase-3 in L929 cells for 24 h. Each value represents the mean ±SE of three experiments. *P < 0.05 vs control.
Annexin V/PI Double Staining
L929 cells showed increased translocation of phosphatidylserine which is hall mark indication of early apoptosis under UVB plus nalidixic acid exposures (Figure 8B). Control group (dark + HBSS) showed no fluorescence (Figure 8A). while UVB plus nalidixic acid exposures -exposed cells showed apoptotic cells, which appeared orange-green due to merging of both red and green fluorescence (Figure 8B). Late apoptotic cells (bright red) were also observed in UVB plus nalidixic acid exposures -exposed cells (Figure 8B). Phosphatidylserine translocation in L929 cells after treatments of nalidixic acid drug for 24 h (A). L929 cells under dark with HBSS (B). Nalidixic acid drug at 8 µg/ml + UVB exposed cells. Arrow is showing early and late apoptotic L929 cells.
UV-B-Photosensitized Nalidixic Acid Induces DNA Damage
Comet assay data demonstrated increased single-stranded DNA damage under that UVB plus nalidixic acid exposures than Control group (dark + HBSS) (Figure 9). The measurement of single-strand DNA damage was analyzed as percent tail DNA. A gradual increase in % DNA tail was significant in cells treated that UVB plus nalidixic acid exposures which confirmed that photosensitized that photosensitized nalidixic acid exposures induced single-stranded DNA breaks (Figure 9A and B). DNA damage in L929 cells after treatment of nalidixic acid drug for 24 h (A). Nalidixic acid drug at 8 µg/ml under dark (B). Nalidixic acid drug at 8 µg/ml + UVB exposed cells (C). Percent of tail DNA damage in L929 cells after exposure of nalidixic acid drug for 24 h. Each value represents the mean +SE of three experiments. *P < 0.05 vs control.
Discussion
In this work, a new understanding of how photosensitized nalidixic acid generates intracellular ROS and causes cell toxicity, apoptosis, and damage to organelles like mitochondria and lysosomes were investigated. Additionally, it caused DNA strand breakage, a photo-genotoxic indicator of nucleic acid damage. Overall, in the human skin cell line, all altered cells may ultimately undergo apoptosis. ROS was created by photoactivated nalidixic acid in L929 cells and photochemical techniques under ambient UVB irradiation. It is typical for cells to produce ROS and for the cellular defense mechanism to quickly quench them. Overproduction of intracellular ROS can interact with membrane-bound organelles, the nucleus, and other macromolecules, ultimately causing cell death. Drugs that are photosensitized may not always cause apoptosis when exposed to non-phototoxic UV light doses. Nonetheless, elevated UV radiation dosages could start the deadly process that could result in apoptosis. 14 When a photolabile drug combines with an appropriate dosage of UVB radiation, adverse phototoxic responses are anticipated. Oxidative stress-related genes were stimulated to express themselves by photochemically produced ROS. 15 Living organisms are subjected to ambient UVB radiation, which reaches the earth’s surface. Thus, scientists are eager to look into the underlying mechanisms of UVB radiation damage in relation to medications. 16 In the current investigation, we observed significant photocytotoxicity and photo-apoptotic effects on L929 cells after they were exposed to a drug containing nalidixic acid for 24 h. Additionally, a notable rise in intracellular ROS production and DNA fragmentation was examined. Other investigations that found harm from exposure to polyaromatic hydrocarbons under UVB radiation were in line with our findings. 14 In this experiment we have observed the toxic effect of nalidixic acid drug under UVB radiation on cells. We have tested the nalidixic acid drug’s photosensitivity to ambient UVB radiation prior to administering drug to the cells. Photochemical investigation revealed that different kinds of reactive oxygen species (O2, O2•−, and •OH radicals) were produced by nalidixic acid. In this work, ROS play a major role in causing toxicity and death in L929 cells. To verify the apoptotic response of the drug nalidixic acid under UVB light, we employed propidium iodide and annexin-V-FITC staining. Both early apoptotic and late apoptotic (necrotic) cells were generated when nalidixic acid was exposed to UVB light. We confirmed that nalidixic acid under UVB radiation caused phototoxicity due to an excess of free radical production within the cell based on the previously described data.
Conclusion
On the basis of above finding we confirmed that nalidixic acid under UVB radiation, exhibited cytotoxicity and apoptosis, which were most likely caused by the generation of ROS and oxidative stress. Our findings suggest that exposure to UVB light increases the susceptibility of L929 cells to nalidixic acid. In the future, we hope to examine nalidixic acid’s phototoxicity using an animal model exposed to UVB light.
Footnotes
Author Note
Reactive oxygen species in photo apoptotic and genotoxicity of nalidixic acid.
Author Contributions
Conception and design of the research: Daoud Ali, Bader O Almutairi, Anis Ahmed, Mohammed H. Almarzoug, Saud Alarifi, Saad Alkahtani; Drafting the manuscript: Daoud Ali; Article structure design: Daoud Ali, Bader O Almutairi, Anis Ahmed, Mohammed H. Almarzoug, Saud Alarifi, Saad Alkahtani; Statistical analysis: Daoud Ali; Experimental management: Daoud Ali, Bader O Almutairi, Anis Ahmed, Mohammed H. Almarzoug, Saud Alarifi, Saad Alkahtani; All authors read and approved the final version of the manuscript.
Funding
This project was funded by the National Plan for Science, Technology and Innovation (MAARIFAH), King Abdulaziz City for Science and Technology, Kingdom of Saudi Arabia, Award Number (2-17-01-001-0031).
Declaration of Conflicting Interests
The authors declared no potential conflicts of interest with respect to the research, authorship, and/or publication of this article.
Data Availability Statement
The original contributions presented in the study are included in the article; further inquiries can be directed to the corresponding author.