
Abstract
Background
S. setigera is widely used in traditional medicine throughout the world. Ethnobotanical surveys have revealed its use to handle diabetes. This present research investigated the antioxidant potential and improvement activities of S. setigera Delile on insulin resistance in type 2 diabetic rats.
Methods
Male rats fed high-fat diet for 6 weeks followed by a single-dose intraperitoneal injection of streptozotocin (35 mg/kg) induced hyperglycemia. 72 hours after injection of streptozotocin, diabetic rats received treatment for 21 days. Fasting blood glucose was measured. Serum biochemical and hepatic biomarkers were evaluated. A hepatic histological study was performed. Oxidative stress biomarkers were assessed in liver.
Results
Doses of 200 and 400 mg/kg reduced the blood glucose with the reduction index of 53.75 and 62.1%, respectively. There was also good improvement in lipid profile and insulin. The dose of 400 mg/kg better reduced subcutaneous fat mass with a difference in reduction index (1.5 to 5.8%). The extract resulted in a decrease in malondialdehyde levels and an increase in catalase activities. The extract showed significant inhibitory potential towards α-amylase 18.78% to 55.91% and α-glucosidase 23.91% to 67.76%.
Conclusion
S. setigera extract could thus reverse insulin resistance and oxidative stress in type 2 diabetic rats induced.
Introduction
Type 2 diabetes (T2D) is characterized by an increase of blood glucose levels due to insulin resistance and pancreatic ß-cell dysfunction. 1 The number of people affected by T2D has been gradually increasing. It will increase from 422 to 642 million, an increase of 65% by 2040, 90% of whom are type 2 diabetics. 2 In 2021, the International Diabetes Federation (IDF) estimated that approximately 416 000 adults aged 20 to 79 died as a result of diabetes and its complications. This is equivalent to one death every eight seconds. Furthermore, 81% of adults with diabetes live in low- and middle-income countries compared to 79% in 2019. 3 An excessively fatty diet can lead to obesity and consequently to insulin resistance. 4 Excess dietary fat is known to increase body weight and visceral fat deposition, induce alterations in carbohydrate metabolism, lipid metabolism, and lead to insulin resistance. 5 Obesity is generally considered a significant risk for the subsequent development of T2D and statistics show that 60–90% of all patients with T2D are or have been obese. 6 Faced with these problems, traditional pharmacopoeia offers a solution within the reach of all, and extracts of some plants have been tested for their antidiabetic activity including S. setigera Delile (Malvaceae), a plant of the Malvaceae family whose ethnobotanical surveys revealed that this plant is frequently used in traditional medicine in Benin to handle various diseases such as diabetes, antibacterial, anti-inflammatory, and hepato-protective activities. 7 In addition, previous works have shown that S. setigera contains bioactive substances including saponins, phenolic compounds, flavonoids, and tannins. 8 However, no previous antidiabetic study of the aqueous extract of S. setigera leaves (AESS) has been conducted on a high-fat diet and of streptozotocin-induced type 2 diabetes model. This present research investigated the antioxidant potential and improvement activities of S. setigera Delile on insulin resistance in type 2 diabetic rats induced.
Materials and Methods
Chemicals and Reagents
Streptozotocin, orthophosphoric acid, adrenaline, 2.2’-azinobis (3-éthylbenzothiazoline-6-sulfonique), 2.2-diphényl-1-picrylhydrazyl, ferric reducing antioxidant potential, trichloroacetic acid, and kits for biochemical assays (Sigma-Aldrich Germany). Sodium chloride, disodium phosphate, trisodium citrate, dithiobisnitrobenzoate, potassium dihydrogenphosphate, sodium hydrogenphosphate, potassium dichromate, and naphthylethylene diamine were purchased from EduLab Biology Kit (Jiangsu, China).
Plant Samplings and Preparation of Aqueous Extract of S. setigera (AESS)
The plant material consisted of S. setigera leaves collected from Mount Mekelek (Far North, Cameroon) in November 2019. Pr Tchobsala, botanist, identified the plant which was then authenticated at the Cameroon National Herbarium as voucher 49900 NHC. These leaves were shade dried at room temperature and then ground into powder using an electric blender. The AESS was prepared following the method recommended in traditional medicine (decoction). 9 For this experimental study, the method was adapted to laboratory realities. A sample of the plant material was finely pulverized in a blender (Thermomix TM5, Vorwerk). Two hundred grams (200 g) of powdered S. setigera leaves were mixed in 1750 mL of distilled water contained in a suitable container (metal pot). The whole was brought to a boil for 30 min using a gas stove. After cooling, the homogenate obtained was filtered using Whatman number 1 filter paper and several times through absorbent cotton. The filtrate obtained was collected in metal boxes and dried in an oven for drying at 50°C for 48 hours. 26.01 g of the crude aqueous extract were obtained and an extraction yield of 13.01 ± .9%. This operation was repeated several times to obtain the quantity of extract necessary for the various tests.
Determination of Bioactive Compounds
Polyphenols Content
The method Singleton with a slight modification to the PPC has been evaluated. In a test tube, approximately 20 mg AESS or standard solution (gallic acid 10 mg/mL) were introduced into the test tubes in which 1 mL of Folin was added. The mixture was stirred for 5 minutes before adding 1 mL of Na2CO3. The mixture was shaken again and incubated at 30°C for one hour. At 750 nm, the calibration curve as a function of gallic acid concentration (0–250 μg/mL) was established to determine the PPC of each sample. The operations were performed in duplicate. The PPC of each extract was expressed in gEAGg/100 g.
10

Flavonoids Content
In a tube containing 1 mL of pre-diluted AESS or quercetin standard solution (5 mg/mL), .2 mL of distilled water and .5 mL of AlCl3 reagent were added. After adding a drop of acetic acid and stirring, the optical density reading was taken at 530 nm. The tests were carried out in duplicate. The calibration curve of the optical density/of quercetin (0–100 μg/mL) made it possible to calculate the flavonoid content of the extract and expressed it in gEQ/100 g.
11

Saponins Content
10 mL of AESS was mixed with .5 mL of a solution of vanillin (8% in ethanol) and 5 mL of sulfuric acid (72%). The mixture was then vortexes and incubated in a 60°C water bath for 10 minutes, then rapidly cooled in an ice bath for 15 minutes. Absorbance was measured spectrophotometrically against a blank (methanol) at a maximum absorption wavelength of 544 nm. Under the same operating conditions, a calibration curve of oleanolic acid (Sigma Aldrich) at different concentrations (from 50 to 1000 μg/mL) was produced. The SAPC was expressed in μg EOA/mg DE. 12
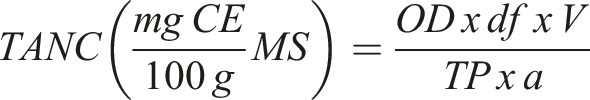
Tannins Content
Briefly, 250 μL of AESS or standard solution (catechin 10 mg/mL) and 750 μL of the reagent (4% vanillin in methanol) were alternately introduced into a tube. The mixture was incubated at 30°C for 5 minutes in the dark.
13
Absorbance was measured at 500 nm and the calibration curve was established with the standard solution of catechin (0–100 μg/mL). The operations were performed in triplicate. The TANC was expressed in mgCE/100 g.
In Vitro Antioxidant Analyses
The evaluation of the DPPH free radical scavenging activity was performed as described by Sun et al.
14
Results were expressed in terms of TgE/100gDM.

The iron-reducing power (FRAP) test was performed.
15
It is expressed as gTE/100gDM.

The ABTS (2.2′-azinobis (3-ethylbenzothiazoline)-6-sulfonic) free radical scavenging activity was evaluated by the method described by Re et al.
16
and expressed as Trolox gram equivalent per 100 g of dry matter (TgE/100gDM).

α-Amylase and α-Glucosidase Inhibition Test
The study of α-amylase inhibition was performed.
17
α-glucosidase inhibition study was performed by a slightly modified protocol by Kim et al.
18
The percentage of inhibition of these enzymes was calculated according to the formula:

Ac = absorbance for control; As = Absorbance for standard.
Determination of Doses
The animal dose (AD) was calculated from the human dose, the conversion coefficient, and the conversion factor (CF) according to the following formula AD = HD x CF x SF. With CF = Conversion factor (6.2), SF = Safety factor (10), AD = Animal Dose, HD = Human Dose.
19

The different doses used for this manipulation were set by framing the animal dose. The animal dose is divided by two to find the small dose to be administered and the same dose multiplied by two to determine the maximum administration dose. The different doses used are as follows: - The minimum dose 100 mg/kg; - The intermediate dose 200 mg/kg; - The maximum dose 400 mg/kg.
Experimental Rats
Male Wistar rats, 2 to 3 months old, weighing 150 to 155 were used before the high-fat diet and 270 g ± 20 g were used after the high-fat diet for treatment. These rats were purchased from the breeding facilities of the Biophysics and Biochemistry Laboratory of the University of Ngaoundéré. These rats were housed in polyethylene cages (n = 5) and maintained under standard laboratory conditions (12 h/12 h light-dark cycle, temperature of 25 ± 2°C). They were acclimatized for 10 days in polyethylene cages which were lined with wood shavings bedding. All rats had free access to food and water ad libitum.
Induction of Type 2 Diabetes
During the first 6 weeks of the experiment, except for the normal control (NC) group (n = 5), 30 rats were fed with a high-fat diet (58% fat, 25% protein, 17% carbohydrate, as a percentage of total energy intake) ad libitum. The NC received a low-fat diet (3% fat, 21% protein, 48.8% carbohydrate, as a percentage of total energy intakes) ad libitum.
After the 6 weeks of dietary manipulation, all 30 rats were injected intraperitoneally (i.p.) with a low dose of streptozotocin (35 mg/kg), to induce partial pancreatic ß-cell dysfunction. STZ was diluted in citrate buffer (.1 M, pH 4.5) just before use. 1 After 72 h, blood from the tail vein of rats was sampled in order to determine the blood glucose levels. Rats with blood glucose levels ≥150 mg/dl were considered type 2 diabetic and were selected for further experimentation.
Treatment Against type 2 Diabetes
After induction of type 2 diabetes, the animals were divided into 6 groups (n = 5) as follows: Group 1: Normal control (NC), received 10 mL/kg H2O/21 days; Group 2: Diabetic control (DC), received HFD +10 mL/kg H2O/21 days; Group 3: Received HFD +180 mg/kg of Metformin for 21 days; and Groups 4, 5, and 6: received HFD +100, 200, and 400 mg/kg of extract orally.
The body mass index (BMI) was calculated on the first day and at end of the induction using the formula: Body mass index (BMI) = body mass (g)/size 2 (cm2). The size was taken with a ruler from the muzzle to the anus of the rat. After 22 days of treatment, the rats were left on an empty stomach for 16 hours. Before euthanizing the animals, they were anesthetized by ketamine injection (2.5 mg/kg, i.p)/diazepam (5 mg/kg, i.p).
Preparation of Tissue Homogenates
The liver was decapitated, cleared of adipose tissue, cleaned in .9% NaCl, and wrung out. A portion of the liver samples was then homogenized with .1 M phosphate buffer (pH = 7.4). The homogenate was centrifuged at 3000 r/min for 15 minutes. The resulting supernatants were stored at −20°C for the determination of MDA, SOD, GSH, CAT, glucokinase, and glucose-6-phosphatase.
Determination of Biochemical Biomarkers
Insulin was measured by the Enzyme-Linked Immunosorbent Assay (ELIZA) kit. Homeostasis model assessment insulin resistance (HOMA-IR) was calculated by the formula: HOMA-IR = Insulin (μU/ml) × glucose (mM)/22.5 20 and HOMA-ß = 20 × insulin (μU/mL)/glucose (mM/L) - 3.5. 21 Lipidic profile assay: triglyceride (TG), total cholesterol (TC), LDL-c, and VLDL-c were obtained using the colorimetric enzymatic method described by Richmond and Trinder.21,22 HDL-c was assayed by the Human kit. The atherogenicity index (AI) and coronary risk index (CRI) were calculated by log(TG/HDL-c) 23 and TC/HDL-c, respectively. 24 ALT and AST were determined by the kinetic method according to the recommendation of the International Federation of Clinical Chemistry and Laboratory Medicine (IFCC) by the Human kit. Glucokinase was determined by the method described by Brandstrup et al (1957). 25 Glucose-6-phosphatase was assayed by the method Koide and Oda (1959). 26
The determination of MDA was performed. 27 SOD was performed. 28 CAT activity was determined tissues. 29 The GSH was also determined. 30
Statistical Analysis
Different results obtained were expressed as Mean ± SEM by the Graph Pad (version 8.0.1) software. Data analysis was performed by one-way ANOVA Tukey’s post-hoc test. Significance was considered at 5%. Correlation between the blood glucose and antioxidant ensile activity was estimated by Pearson’s correlation.
Results
Polyphenols, Flavonoids, Saponins, Tannins Content, and In Vitro Antioxidant Potential (FRAP) and Scavenging Activities (ABTS and DPPH) of AESS
Polyphenols (PPC), flavonoids (FLAC), saponins (SAPC), tannins content (TANC), and in vitro antioxidant potential (FRAP) and scavenging activities (ABTS and DPPH) of AESS.

Values are means ± SEM. Data analysis was performed by one-way ANOVA followed by Turkey’s post-test. ABTS = 2.2′-Azinobis (3-éthylBenzoThiazoline)-6-Sulfonic), DPPH = 2.2-diphényl-1-picrylhydrazyl, FRAP = Ferric Reducing Antioxidant Potential and DM = Dry matter.
The scavenging activity to DPPH and ABTS of phenolic compounds in vitro from the AESS was evaluated. These results showed antiradical activity with a good capacity at DPPH (34.64 ± .75 gET/100gDM) and ABTS (44.03 ± .38 gET/100gDM). In addition, the reducing activity of phenolic compounds from the aqueous extract of S. setigera by FRAP method showed significant reducing activity (55.50 ± .54 gET/100gDM).
Inhibitory Activity of α-Amylase (A) and α-Glucosidase (B) In Vitro
The results in Figure 1 revealed an inhibitory activity of α-amylase by acarbose and AESS. Both acarbose and AESS showed significant inhibitory potential towards α-amylase 27.01 ± .02% to 59.17 ± .45% and 18.78 ± .12% to 55.91 ± .08%, respectively. Inhibitory activity of aqueous extract of S. setigera (AESS) on α-amylases (A) and α-glucosidases (B). Values are expressed as mean ± SEM. Data analysis was performed using one-way ANOVA followed by Tukey’s post-hoc test. AESS: Aqueous Extract of S. setigera.
This figure shows significant inhibitory activity of α-glucosidase by acarbose and AESS. Acarbose showed significant inhibition ranging from 31.76 ± .62% to 73.16 ± .11%. This was also the case for AESS with an inhibitory potential ranging from 23.91 ± .22% to 67.76 ± 2.15%.
Evaluation of Body Weight, Body Mass Index, Visceral, and Subcutaneous Fat Deposits
Body weight, body mass index, visceral, and subcutaneous fat deposits of the treated rats.

All results were expressed as mean ± SEM (n = 5). Data analysis was performed using one-way ANOVA followed by Tukey’s post hoc test. βP<.01 δP<.0001 statistically significant compared with the normal control. aP<.05, bP<.01, cP<.001, dP<.0001 statistically significant compared with the DC group. BMI: Body mass index; BW: Body weight; HFD: High-fat diet and AESS: Aqueous Extract of S. setigera.
Furthermore, these results show that AESS 200 and 400 mg/kg significantly reduced visceral fat (P < .01), (P < .0001, respectively, compared to DC receiving HFD throughout the experiment. A significant accumulation of visceral and subcutaneous fat was noted compared to the NC. AESS 400 mg/kg better reduced this subcutaneous fat mass with a CI difference (1.5 to 5.8%) in relation to the DC (Table 2).
Effect of AESS on Blood Glucose Changes
After 21 days of treatment, AESS 200 and 400 mg/kg more significantly decreased blood glucose (P < .0001) by IC: 53.75 and 62.1%, respectively (Figure 2). On the 21st day of the end of experimentation, metformin as well as the different doses of the extract significantly reduced blood glucose levels in a highly significant manner (P < .0001). Effects of aqueous extract of S. setigera on blood glucose changes. Results are expressed as mean ± SEM (n = 5). Statistical analysis was performed by one-way ANOVA Tukey’s post hoc test. aP<.05, bP<.01, cP<.001, dP<.0001 statistically significant compared with the diabetic control group. δP<.0001 statistically significant compared with the normal control group. AESS: Aqueous Extract of S. setigera.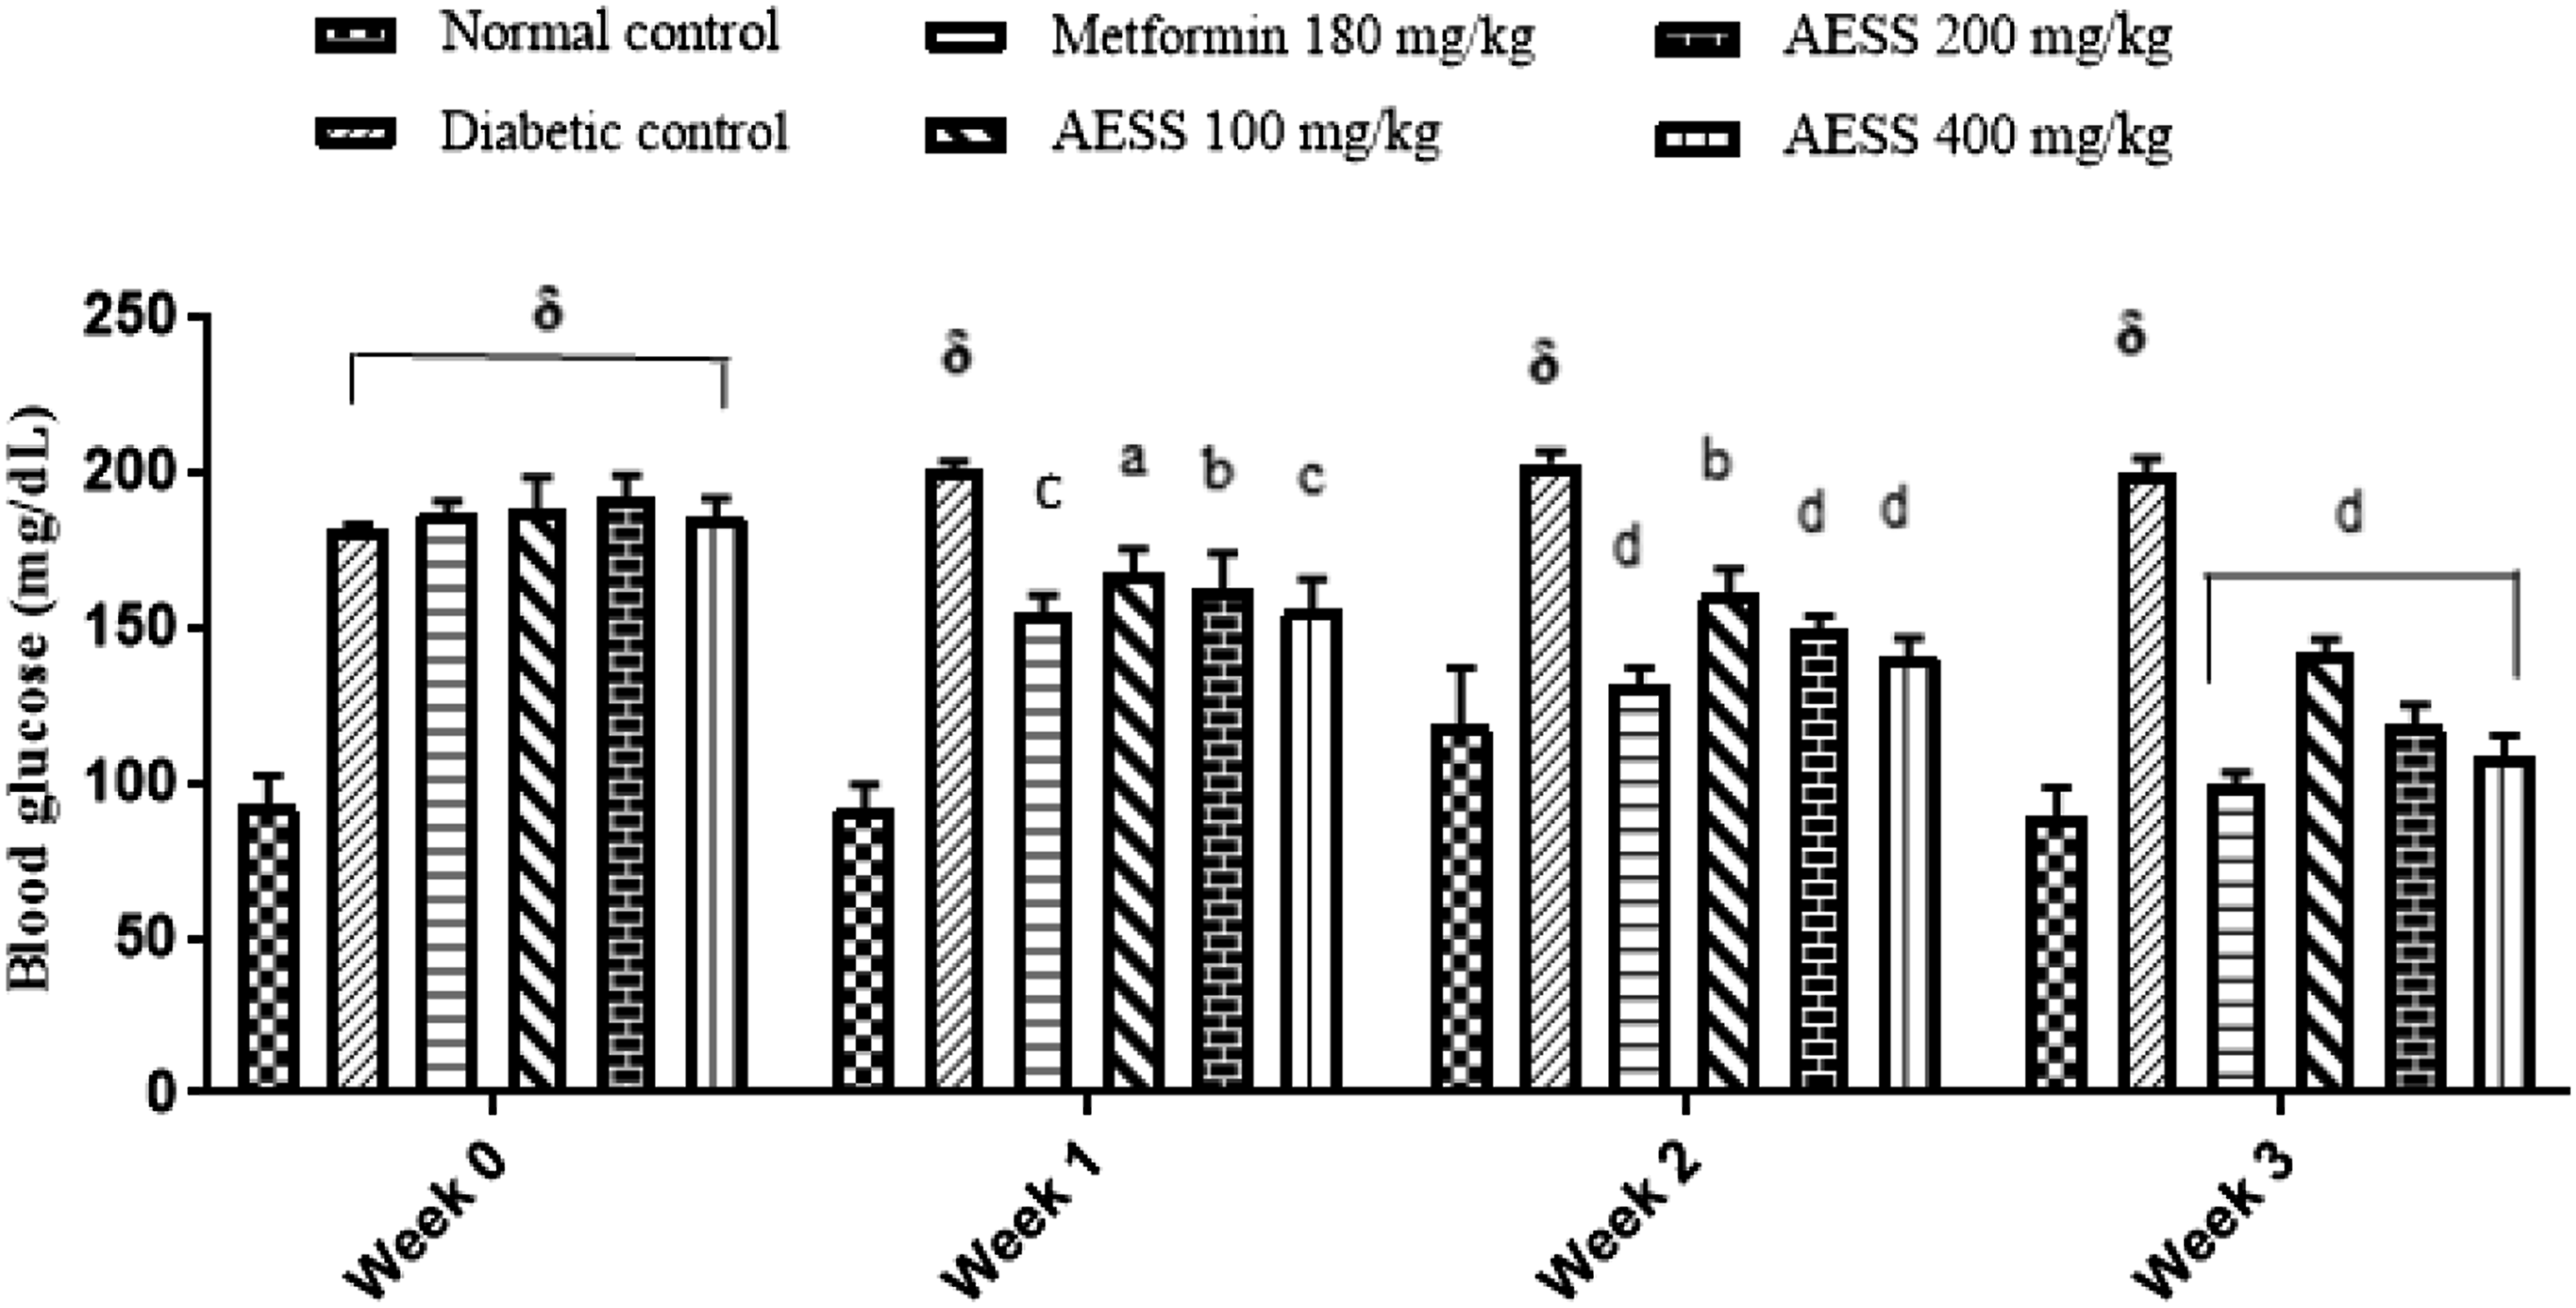
Effect of AESS on Serum Insulin, HOMA-IR, and HOMA-β
After 6 weeks of HFD followed by injection of streptozotocin 35 mg/kg, treatment with metformin 180 mg/kg and AESS 200 and 400 mg/kg for 21 days showed a significant decrease in serum insulin level P < .001, P < .05, and P < .01, respectively, in relation to DC rats (Figure 3A). Animals which were tested positive to diabetes showed a high level of serum insulin (P < .01) in relation to NC rats (Figure 3A). Effect of aqueous extract of S. setigera (AESS) on variations in serum insulin level (A), HOMA-IR (B) and HOMA-ß (C). Statistical analysis was performed by one-way ANOVA Tukey’s post hoc test. Results are expressed as mean ± SEM (n = 5). δP<.01, ∂P < .0001 statistically significant compared with the normal control group. aP<.05, bP<.01, cP<.001, dP<.0001 statistically significant compared with the diabetic control group. AESS: Aqueous Extract of S. setigera; HOMA-IR: Homeostasis Model of Insulin-Resistance; HOMA-ß: Homeostasis Model of Insulin Secretion and AESS: Aqueous Extract of S. setigera.
Effect of AESS on the Lipid Profile of HFD/STZ-Induced Rats
Effect of AESS on lipid, AI, and CRI profile of HFD/STZ induced rats.

All results were expressed as mean ± SEM (n = 5). Data analysis was performed by one-way ANOVA Tukey’s post hoc test. αp<.05, ∂P < .001, δp<.0001 statistically significant compared with normal control. aP<.05, bP<.01, cP<.001, dP<.0001 statistically significant compared with DC. NC: Normal control, DC: Diabetic control, AI: Atherogenicity index and CRI: Coronary risk index.
AESS 400 also reduced TC, LDL-c, VLDL-c (P < .0001), TG (P < .0001), AI (P < .0001), and CRI P < .05 with a notable increase in HDL-c (P < .0001) compared to DC. This result also show that AESS 200 reduced TC, LDL-c, VLDL-c (P < .001), TG, and AI (P < .05) but with a reduction in HDL-c (P < .001) relation to DC rats.
Effect of AESS on the Activity of Glucokinase, Hepatic Glucose-6-Phosphatase, and Transaminases (AST and ALT)
Effect of AESS on glucokinase, hepatic glucose-6-phosphatase, and serum transaminases (AST and ALT) activity in the treated rats.

All results were expressed as mean ± SEM (n = 5). Data analysis was performed by one-way ANOVA Dunnett’s post-hoc test, ∂P < .001, δP<.0001. Statistically significant compared with the NC. aP<.05, bP<.01, cP<.001, statistically significant compared with the DC group. AST: Aspartate-Amino-Transferase; ALT: Alanine-Amino-Transferase and AESS: Aqueous Extract of S. setigera.
Regarding transaminase activity, a significant increase in its activity including AST and ALT (P < .0001) of DC in relation to NC was identified. Thus, it is also evident from this observation that 100, 200, and 400 mg/kg extract significantly reduced AST activity (P < .01), (P < .001), and (P < .0001), respectively, compared to DC.
Effect of AESS on Activity MDA, SOD, CAT, and GSH of Liver of HFD/STZ-Induced Rats
Figure 4 show the illustration of hepatic MDA levels (Figure 4A). The DC rats showed an increase in the MDA activity (P < .01) of the liver in relation to NC rats. AESS 400 mg/kg reduced MDA activity of liver (P < .01) in relation to DC. Figure 4B shows the hepatic SOD activity. These results show a significant reduction in hepatic (P < .001) SOD activity in DC rats in relation to NC. The 200 mg/kg extract was able to significantly increase hepatic SOD activity (P < .05) in relation to DC. Effect of the aqueous extract of S. setigera (AESS) on MDA (A), SOD (B), CAT (C), and GSH (D) hepatic activity. Results are expressed as mean ± SEM (n = 5). Statistical analysis was performed by one-way ANOVA Tukey’s post hoc test. δP<.01 and statistically significant compared with the normal control group. aP<.05, bP<.01, cP<.001 statistically significant compared with the diabetic control group. SOD: Superoxide Dismutase; CAT: Catalase; GSH: Glutathione; MDA: Malondialdehyde and MET180: Metformin 180 mg/kg.
The results in Figure 4C show a decrease in hepatic CAT activity (P < .01) of the DC relation to the NC. The 400 mg/kg extract increased CAT activity in the liver (P < .01) and the 200 mg/kg extract increased catalase activity in the liver (P < .01) in relation to DC.
AESS 400 mg/kg increased (P < .01) hepatic GSH activity compared to diabetic control (Figure 4D), significant reduction in hepatic glutathione activity (P < .01) in relation to DC.
Correlation Between Body Weight Evolution and Hepatic Antioxidant Biochemical Biomarkers of HFD/STZ-Induced Diabetic Rats
Pearson’s correlation (r) is a quantification of the linear relationship between variables. It is based on the covariance calculation. These results show a positive correlation between SOD and hepatic MDA (r = .7911, P < .01), hepatic CAT and MDA (r = .7347, P < .01), and GSH and MDA (r = .6963, P < .01). However, a negative correlation was noted between body weight and the degree of lipid peroxidation (r = −.7889, P < .01) (Figure 5). Pearson correlation between body weight evolution and hepatic antioxidant biochemical biomarkers. Results are expressed as mean ± SEM (n = 5). Statistical analysis was performed by one-way ANOVA Tukey’s post hoc test. The data expressed are changes in body weight (g), SOD (U/mg protein), MDA (nmol/mg protein) and CAT (nmol H2O2/min/mg protein). Pearson correlations were made between SOD and MDA (n = 5, r = .7911, P < .01), CAT and MDA (n = 5, r = .7347, P < .01), and GSH and MDA (n = 5, r = .6963, P < .01), on the other hand, a negative correlation was found between body weight and the degree of lipid peroxidation (n = 5, r = −.7889, P < .01).
Discussion
This study was conducted to investigate the antidiabetic effects of AESS in type 2 diabetic rats induced by a high-fat diet and STZ. STZ is one of the most widely used substances to induce diabetes (type 1 or (2) in animals. 31 This study showed that the high-fat diet for 6 weeks generated significant (P < .0001) insulin resistance in DC compared to NC. In contrast, treatment with aqueous extract of S. setigera improved insulin resistance (HOMA-IR) and insulin secretion (HOMA-β). These observations are in agreement with those of Olokoba et al,3 32 who noted that type 2 diabetes is characterized by insulin resistance accompanied by insufficient insulin secretion from islet ß-cell.
In the diabetic control group, a gradual increase in blood glucose was observed due to the HFD and low-dose STZ administration. These results showed a notable presence of PPC (80.77 gEGA/100 g) and FLAC (41.16 gQE/100 g), which suggests an importance for this antidiabetic study. Flavonoids have hypoglycemic effects. Flavonoids from some plants have hypoglycemic effects. 32 Thus, the decrease in blood sugar in the groups treated with the extract would be due to the presence of these compounds. The polyphenols present in the aqueous extracts of certain medicinal plants have an activity similar to that of insulin in vitro. 33 These bioactive compounds are naturally occurring in most plant materials, known to be antidiabetic, thus conferring the antidiabetic property to plants. 33
This study showed an inhibitory activity towards α-amylase and α-glucosidase. α-amylase is responsible for the hydrolysis of starch, which breaks down into glucose prior to absorption. 34 α-glucosidase is an enzyme found in the small intestine, used for the cleavage of disaccharides into glucose. 35 Inhibition of these enzymes can lead to a reduction in postprandial hyperglycemia. 36 Some conventional drugs such as acarbose are used for this purpose. Unfortunately, they have revealed various side effects and poor exacerbation control. However, it has been reported that natural digestive enzyme inhibitors with fewer side effects have been found in various medicinal plants. 37 S. setigera is a considerable example with inhibitory action on α-amylase and α-glucosidase.
HFD induces insulin resistance by different mechanisms but is considered mainly through the glucose-fatty acid cycle. 38 The presence of high TG levels due to excess fat could be a source of increased fatty acid availability and oxidation. Preferential use of fatty acid oxidation blunts hepatic insulin-mediated reduction of glucose production and reduces glucose uptake or utilization in skeletal muscle leading to compensatory hyperinsulinism, a common feature of insulin resistance. 39 Excess TC and TG can increase blood lipoprotein levels and promote atherosclerosis formation, 40 which increases the risk of cardiovascular disease in diabetics. Therefore, AESS has the ability to significantly decrease serum TC and TG levels, thereby limiting thrombus formation in the vessel and preventing the development of atherosclerosis.
The activities of glycolytic enzymes (glucokinase and glucose-6-phosphatase) are significantly altered during diabetes. 41 This reflects the hyperglycemia and insulin resistance observed in this study. The elevation of these gluconeogenic enzymes such as glucose-6-phosphatase contributes to hyperglycemia in the diabetic state. 42 S. setigera therefore significantly normalized the activities of these gluconeogenic enzymes in STZ-treated diabetic rats fed with HFD. S. setigera has a protective effect against disrupted carbohydrate metabolic enzymes; this is probably due to increased insulin action.
AESS treatment improved antioxidant enzyme activity to near-normal values. SOD and CAT are the two main endogenous scavenging enzymes that remove toxic free radicals and protect cells from the deleterious effects of ROS. 43 GSH of the endogenous non-enzymatic antioxidant system plays an important role, acting mainly as a reductant and detoxifies hydrogen peroxide with the help of glutathione peroxidase. 44 It has been shown that the decrease in GSH may be due to its degradation by oxidative stress in HFD- and STZ-induced hyperglycemic rats. 45 Indeed, hyperglycemia can inactivate SOD and CAT, thus promoting the generation of free radicals, resulting in lipid peroxidation. 46 Flavonoids have the ability to reduce tissue MDA content on the one hand and increase the activity of SOD, CAT, and GSH on the other. 47 Using the coefficient (r) approach, we found that diabetes in AESS-treated rats is associated with an increase in antioxidant enzyme activity, as well as a decrease in the level of lipid peroxidation, indicating that AESS has a hypoglycemic and antihyperlipidemic profile. This may justify the antiradical DPPH power noted in the plant extract tested. The FRAP dosage is a good indicator to assess the antioxidant potential of a plant or food. We can suggest that the different phenolic compounds present in our extract act as reducing agents which transform the radicals into stable compounds. 48
The increase in transaminase activities (AST and ALT) shows that diabetes induces liver dysfunction leading to liver necrosis in diabetic patients. Therefore, it has been shown that the increase in serum transaminase activity is mainly due to the leakage of transaminases from the liver cytosol into the bloodstream. 49 AESS treatment protects liver integrity by reducing transaminase levels. 50 Livers from rats fed with high-fat diet have shown that insulin resistance is associated with dyslipidemia associated with increased transaminases. The high-calorie diet may reduce the insulin sensitivity of liver cells, thereby decreasing glucose uptake and causing defects in insulin suppression of hepatic glucose production. 51 However, a significant decrease in dyslipidemia was observed, indicating that AESS may improve hepatic lipid metabolism.
Conclusion
AESS corrected the disorders and improved the resistance to insulin. AESS have the ability to protect cells from reactive oxygen species induced damages by improving cellular antioxidant defenses, normalizing blood glucose, and lipid profile biomarkers in. The extract showed significant inhibitory potential towards α-amylase and α-glucosidase. This study provides evidence and information to justify the use of S. setigera in the traditional treatment of T2D and its complications. The results obtained during this work lead to other complementary studies, in order to allow the optimal use of S. setigera in the management of patients suffering from type 2 diabetes.
Footnotes
Acknowledgments
The authors are grateful to the Laboratory of Biochemistry and Biological Chemistry of the University of Maroua which provided the necessary materials for the realization of this work. We also thank Agborbock Cliford for English language revision.
Author Contributions
Conception, data collection and interpretation; data analyses; manuscript draft and critical review: all authors. Final approval of the study content and manuscript and accountability for data integrity: all authors. All authors read and approved the final manuscript.
Zacharie Tchoubou: Writing-Original draft preparation, Investigation, Conceptualization, Development of search strategy, Formal analysis.
Benoît Bargui Koubala: Conceptualization, Development of search strategy, Writing-Original draft preparation, Resources, Validation, Formal analysis.
Dieudonné Ndjonka: Writing-Original draft preparation, Investigation, Formal analysis.
Declaration of Conflicting Interests
The author(s) declared no potential conflicts of interest with respect to the research, authorship, and/or publication of this article.
Funding
The author(s) received no financial support for the research, authorship, and/or publication of this article.
Ethical Approval
The Bioethics Committee of Cameroon (No. FWA-IRB00001954), eighth edition has approved this work.