
Abstract
Excessive manganese (Mn) exposure produces neurotoxicity with mitochondrial damage. Mitophagy is a protective mechanism to eliminate damaged mitochondria to protect cells. The aim of this study was to determine the dose-response of Mn-induced mitochondria damage, the expression of mitophagy-mediated protein PINK1/Parkin and mitophagy in dopamine-producing SK-N-SH cells. Cells were exposed to 0, 300, 900, and 1500 μM Mn2+ for 24 h, and ROS production, mitochondrial damage and mitophagy were examined. The levels of dopamine were detected by ELISA and neurotoxicity and mitophagy-related proteins (α-synuclein, PINK1, Parkin, Optineurin, and LC3II/I) were detected by western blot. Mn increased intracellular ROS and apoptosis and decreased mitochondrial membrane potential in a concentration-dependent manner. However, at the low dose of 300 μM Mn, autophagosome was increased 11-fold, but at the high dose of 1500 μM, autophagosome was attenuated to 4-fold, together with decreased mitophagy-mediated protein PINK1/Parkin and LC3II/I ratio and increased Optineurin expression, resulting in increased α-synuclein accumulation and decreased dopamine production. Thus, Mn-induced mitophagy exhibited a novel biphasic regulation: at the low dose, mitophagy is activated to eliminate damaged mitochondria, however, at the high dose, cells gradually loss the adaptive machinery, the PINK1/Parkin-mediated mitophagy weakened, resulting in neurotoxicity.

Highlights
• Mn concentration-dependently produced cytotoxicity in SK-N-SH cells • Mn concentration-dependently increased ROS and mitochondria damage • Mn markedly induced mitophagy at low dose, but it was attenuated at high doses • PINK1/Parkin and LCII/I decreased with increased Mn concentrations • Mn increased α-synuclein and decreased dopamine in concentration-dependent manner
Introduction
Manganese (Mn) is an essential trace element to humans, and plays roles in the development, metabolism and antioxidation. 1 Human exposure to Mn mainly through the air, food, drinking water, and skin contact.2,3 Excessive Mn exposure could result in neurological dysfunction,4,5 especially from occupational settings. 6
Our prior studies have shown that in chronic Mn-exposed smelting workers, the expression of PARK2 mRNA in the blood decreased, accompanied by neurological dysfunction; 7 In cultured SH-SY5Y cells, Mn exposure produced mitochondrial damage, decreased PARK2 expression, and dopamine production. 8 The decreased Park2 mRNA and histopathological changes in the brain of rats could be recovered at the early stages with the removal of Mn exposure. 9 Knockdown of PARK2 increased intracellular ROS and cell death in SK-N-SH cells, while PARK2 overexpression could increase the level of Parkin-mediated mitophagy to eliminate damaged mitochondria to protect cells. 10
PARK2 gene encoded Parkin protein plays important rules in activating mitophagy to eliminate damaged mitochondria to protect cells from Mn toxicity.10,11 Continuous Mn overload could inhibit mitophagy-lysosomal degradation, resulting in the accumulation of damaged mitochondria. 12 Mitochondria are double-membrane-bound organelles involved in a variety of cellular events such as energy conversion, calcium homeostasis, 13 amplification of programmed cell death cascades, metabolic synthesis and other cellular events, and have been in a dynamic state of changing shape, size, and subcellular location. 14 Major features of mitochondrial dysfunction include excessive production of reactive oxygen species (ROS), ATP depletion, mitochondrial DNA depletion, caspase release and electron transport complex enzyme defects. 15 Mitophagy dysfunction could impact the clearance of damaged mitochondria, and further exacerbate neuronal death.16,17
Although the relationship between Mn and mitophagy has been reported, and the interaction pathway has been studied, it is not yet known the dose-response relationship between Mn exposure, PARK2/Parkin expression, and mitophagy. Therefore, it is of great significance to define the dose-response mechanism of Mn-induced neurotoxicity. Human neuroblastoma (SK-N-SH) cells are expressing higher level of dopamine, and are a good cell model for studying the function and protection of dopaminergic neurons. 18 Therefore, this study utilized SK-N-SH cells to study dose-response of Mn-induced cell viability and apoptosis, mitochondrial damage and mitophagy, ROS production, α-synuclein accumulation and dopamine production, importantly, the expression of PINK1/Parkin and Optineurin, and autophagy-related proteins LC3II/I were also examined. The results demonstrated Mn concentration-dependently produced neurotoxicity, mitochondrial damage and α-synuclein accumulation, with biphasic mitophagy regulation.
Materials and methods
Reagents
Manganese (II) chloride tetrahydrate (MnCl2·4H2O) was purchased from Sigma (St. Louis MO), All other reagents were of high grade.
Cell Culture
Human neuroblastoma SK-N-SH cells were purchased from Shanghai Heyuan Biotechnology Co., Ltd. (Shanghai, China), cultured in MEM medium containing 10% fetal bovine serum (FBS) and 1x Penicillin-Streptomycin solution, and placed in 37°C, 5% CO2 incubator. When the cells reached 80-90% confluency, the cells were digested with .25% trypsin and passaged 1:2∼1:3 or frozen.
Mn Concentration Selection
SK-N-SH cells were seeded into a 96-well plate at a density of 1 × 10⁵/mL with 100 μL per well, and subjected to 2% serum starvation to study autophagy. 19 Based on the literature 20 and our prior publication, 10 the Control, Low (Mn2+ 300 μM), Middle (Mn2+ 900 μM), and High (Mn2+ 1500 μM) groups were selected.
Cell Apoptosis Detection
After cell digestion, centrifugation and washing, cells were resuspended in 250 μL of binding buffer at a concentration of 1 × 10⁶/mL. 100 μL of cell suspension was taken into a 5 mL flow tube, 5 μL Annexin V/PE and 10 μL 7AAD solution were added, mixed and incubate at room temperature in dark for 30 min, and 400 μL of PBS was added to the reaction tube, and analyze by flow cytometry (FACS).
ROS and Mitochondrial Membrane Potential Detection
For intracellular ROS detection, 20 μL of ROS Detection Reagent Stock Solution was added in10 mL of Assay Buffer to prepare a staining solution, then add 1 mL staining solution to cover the cells to incubate for 1 h in a 5% CO2, 37°C incubator. Add 2 mL of PBS to wash the cells, digest the centrifuged cells with .25% trypsin, discard the supernatant, resuspend the cells with 500 μL of PBS, and detected by FACS.
For mitochondrial membrane potential detection, cells were washed twice with PBS, and suspended in 1 mL of cell culture medium. Then, 1 mL of JC-1 staining working solution was added, mixed thoroughly and incubated at 37°C for 20 min. Finally, discard the supernatant, wash cells twice with JC-1 staining buffer (1×), and collect the cells for FACS.
Transmission Electron Microscopy (SEM)
Cells were washed twice and fixed with 2.5% glutaraldehyde solution and 1% osmic acid fixative. Cells were then dehydrated with absolute ethanol, embedded overnight with spur epoxy resin, and finally cured in an incubator, sliced (70 nm), stained with 7.3% uranyl acetate-lead citrate, and observed with Transmission electron microscopy.
Western Blot Analysis
The total protein was extracted from SK-N-SH cells with RIPA containing phenylmethanesulfonyl fuoride (PMSF) and proteinase inhibitors. Total protein concentration was measured with the BCA protein assay kit. Equal amounts of protein (20 μg) were separated by sodium dodecyl sulfate/polyacrylamide gel electrophoresis and transferred to a polyvinylidene fluoride membrane. The membrane was blocked in 5% nonfat dry milk for 2 h and probed with primary antibodies against PINK1 (CST6946, 1:1000, Cell Signal Technology, Boston, MA), Parkin (CST4211, 1:1000), Optineurin (ab213556, 1:1000, Abcam, Waltham, MA), LC3 (ab192890, 1:2000, Abcam), α-Synuclein (ab32127, 1:20000, Abcam), overnight at 4°C. After washing with TBST, the membranes were incubated for 1 h with a horseradish-peroxidase-conjugated anti-rabbit/mouse IgG (GB-2301/GB-2305, 1:10000, ZSGB-BIO, Beijing, China). Protein bands were visualized using the enhanced ECL reagent and quantified with Quantity One.
Dopamine Content Detection
Cellular dopamine (DA) contents were determined by commercial ELISA kit (Sangon Biotech, Shanghai, China). Briefly, cell culture supernatant was centrifuged for 20 min to remove impurities and cell debris, and 50 μL of cell suspensions was mixed with 50 μL of biotin-labeled dopamine antibody solution, and incubated at 37°C for 45 min. After washing, 100 μL of horseradish peroxidase-labeled streptavidin (1:100) was added and incubated at 37°C for 30 min. After washing, 90 μL of chromogenic substrate TMB was added and incubated at room temperature in the dark for 15 min. The OD value was measured at 450 nm, and calculated from DA standard curve.
Statistics
The data was entered into SPSS22.0 for statistical analysis. The results were described in terms of Mean ± SEM (standard error of the mean). Comparisons between groups were analyzed by one-way analysis of variance, followed by multiple range tests. The difference between Mn-intoxication was tested by the t-test. The significance level was set at P < .05.
Results
Effects of Mn on Cell Apoptosis
SK-N-SH cells in 2% FBS medium were treated with 0, 300, 900, and 1500 μM Mn for 24 h. After double-staining of cells with Annexin V-PE/7-AAD, apoptosis was detected by flow cytometry (Figure 1A). The lower right quadrant represents early apoptotic cells, while the upper left quadrant represents late apoptotic cells. Combine the early and late apoptotic cell portion together, the apoptosis rate of 300 μM was 8.2%, significantly increased over Control (0 μM, 2%). The apoptosis rate increased to 9.2% and 14% after Mn 900 and 1500 μM, respectively (Figure 1B). Effect of Mn on cell apoptosis. SK-N-SH cells in 2% FBS medium were treated with 0, 300, 900, and 1500 μM Mn2 + for 24 h and apoptosis was determined by Annexin V-PE/7-AAD double staining. A, Flow cytometry images; B, apoptosis rate quantitation. Data are expressed as mean ± SEM, n = 3. *Compared with the control group, P < .05.
Effect of Mn on ROS Production
Fluorescence probes were used to detect intracellular concentration of ROS. With the increase of Mn, the intracellular ROS increased as indicated by the peak shifted to the right (Figure 2A). Compared with 0 μM (6464 RFU), Mn 300 μM increased ROS by 29% (8334 RFU), Mn 900 μM increased ROS by 37% (8824 RFU), and Mn 1500 μM increased ROS by 45% (9391 RFU) (Figure 2B) Effects of Mn on intracellular ROS levels. A, Flow cytometry; B, quantitation of ROS. Data are expressed as mean ± SEM, n = 3. *Compared with the control group, P < .05.
Effects of Mn on Mitochondrial Membrane Potential
SK-N-SH cells in 2% FBS medium were treated with 0, 300, 900, and 1500 μM Mn2 + for 24 h. The mitochondrial membrane potential was detected with the JC-1 fluorescent probe (Figure 3A). With the increase of Mn concentration, the JC-1 polymer/monomer fluorescence ratio decreased gradually. Compared with the control group (5.07), the membrane potential of Mn 300 μM was slightly decreased to 4.70, but significantly decreased to 2.82 and 1.41 after Mn 900 and 1500 μM, respectively (Figure 3B). Effects of Mn on mitochondria membrane potential. A, Flow cytometry; B, quantitation of mitochondria membrane potential via JC-1 polymer/monomer fluorescence ratio. Data are expressed as mean ± SEM, n = 3. *Compared with the control group, P < .05.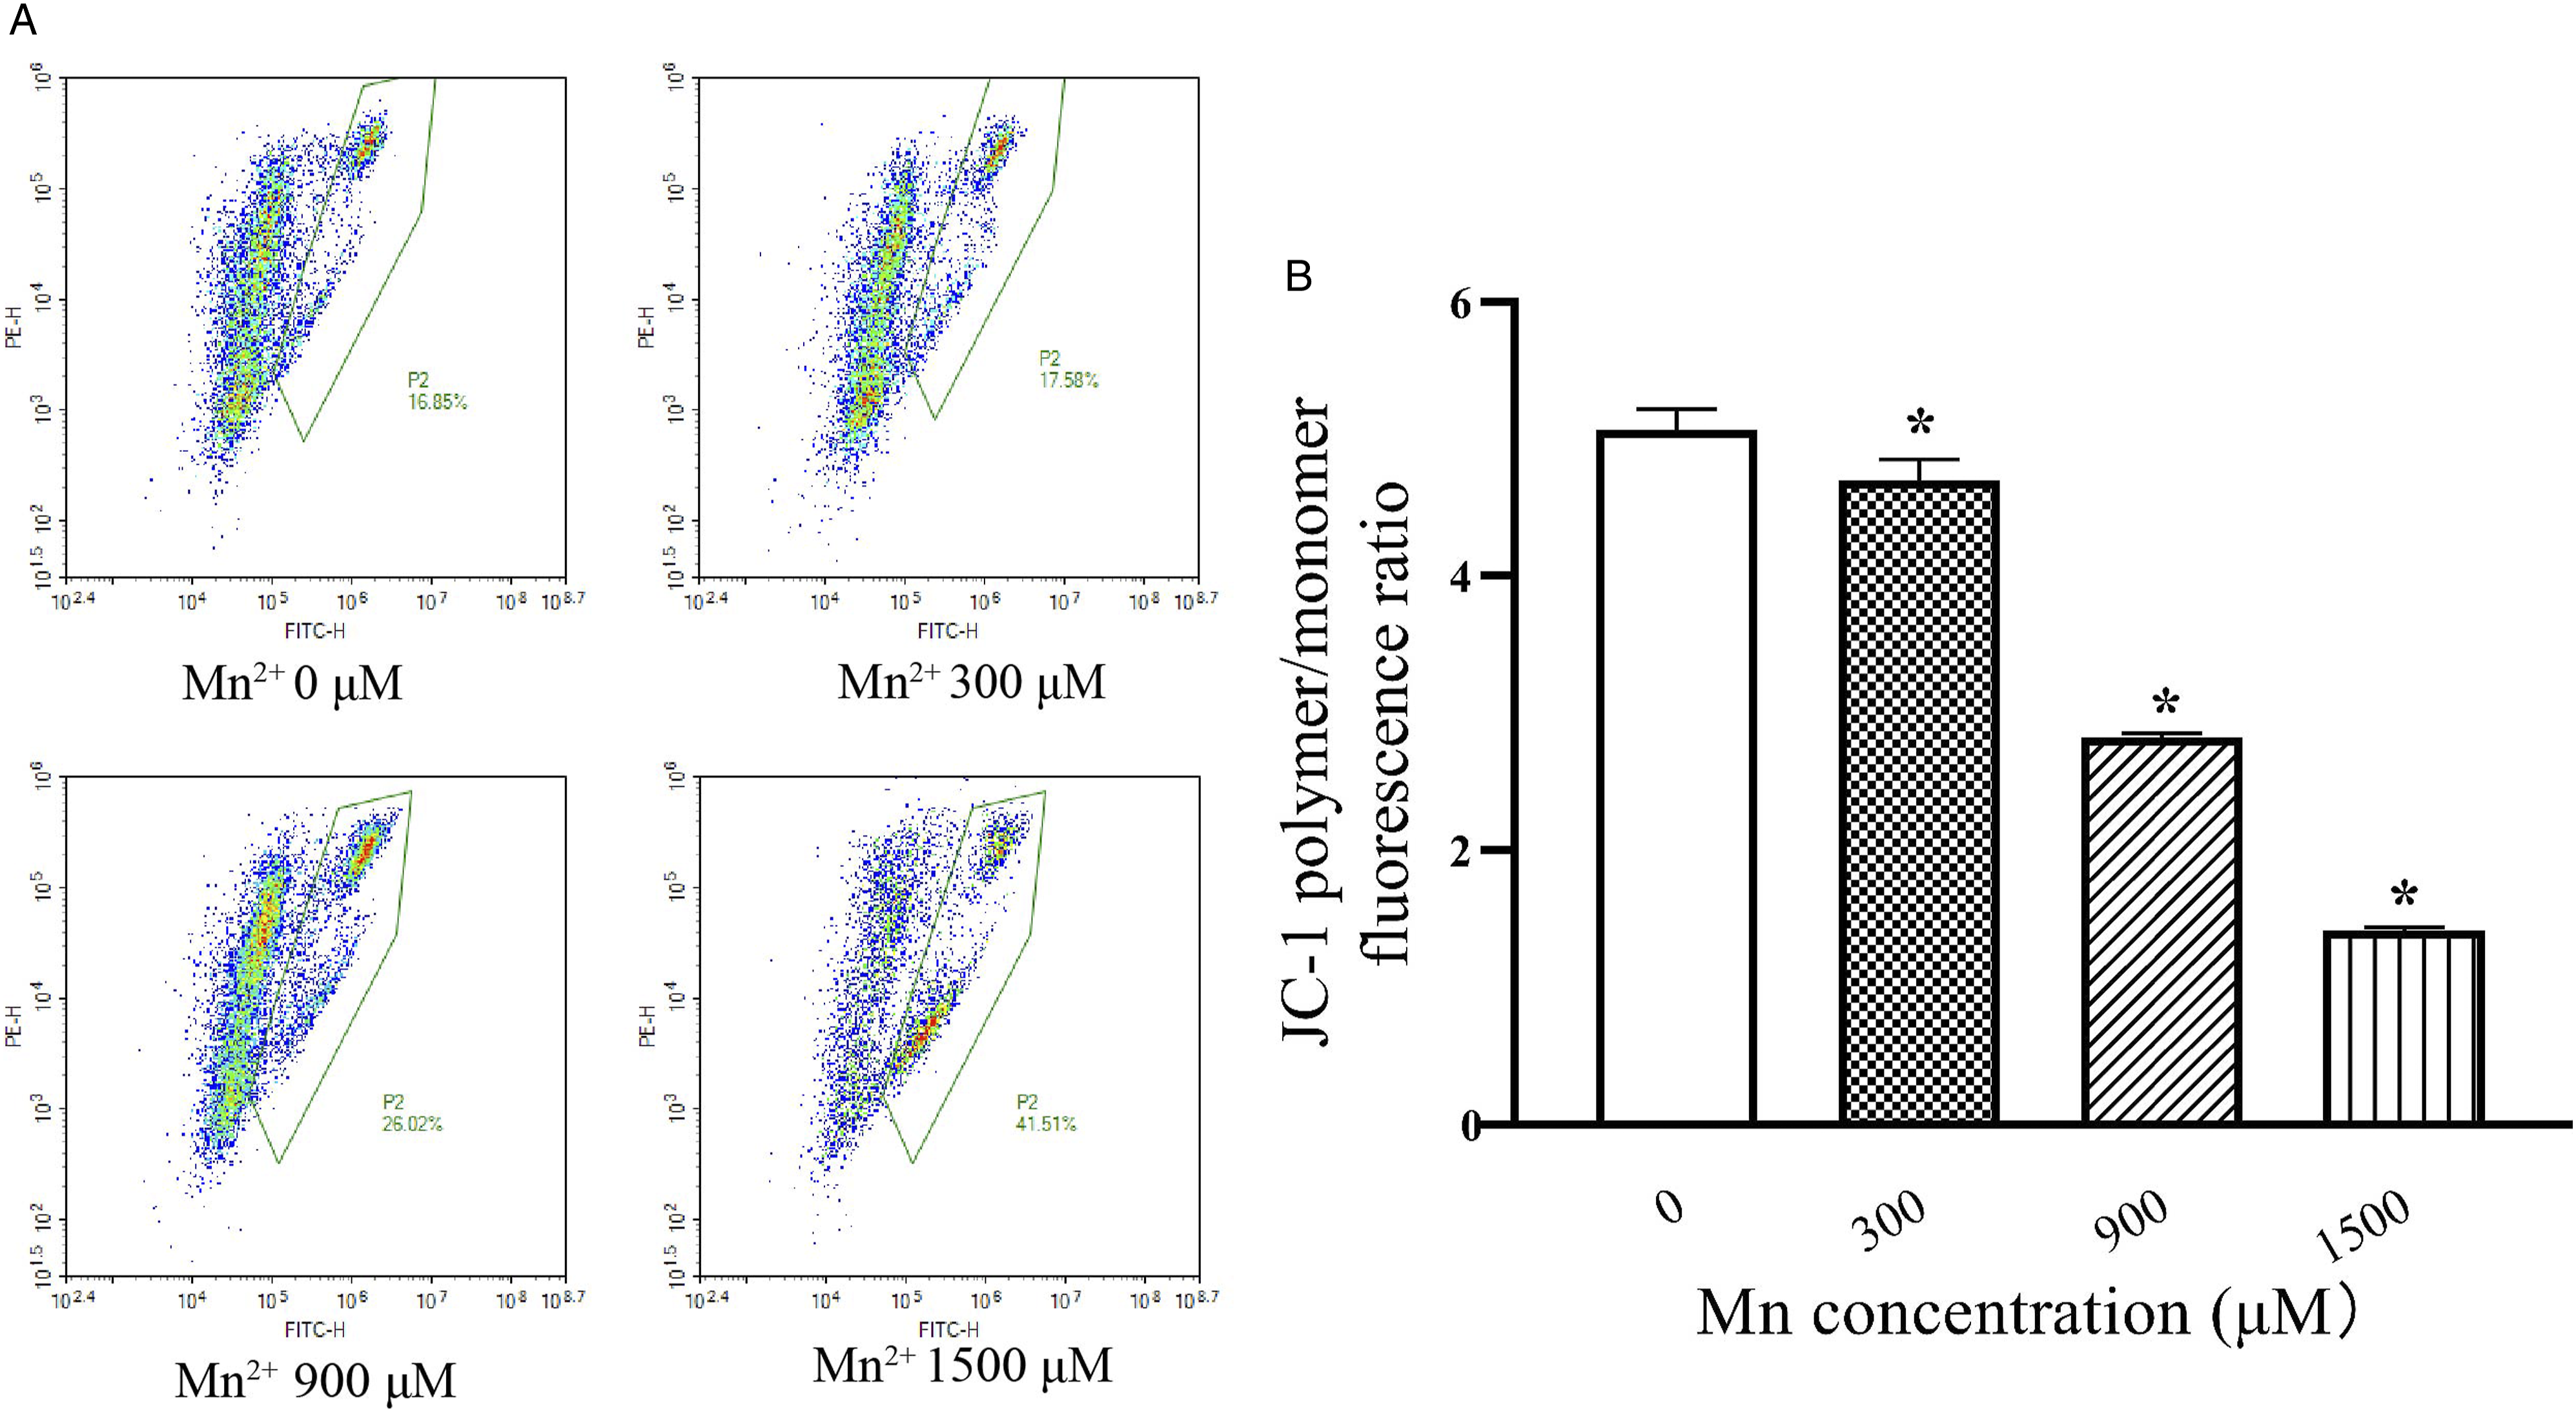
Effects of Mn on Mitochondria and Autophagosomes
After treatment of cells with Mn for 24 h, mitochondrial and autophagosomes morphology were observed by transmission electron microscope. The morphology of mitochondria gradually changed with the increase of Mn. Compared with the Control (0 μM) group, the mitochondria in the Mn groups were swollen, the outer membrane was uneven, and the cristae gradually decreased until disappeared in a Mn concentration-dependent manner (Figure 4A). The numbers of autophagosomes were also increased with Mn treatment (Figure 4B). However, 300 μM of Mn increased the most (11-fold), 900 μM of Mn the modest (6-fold), while the high dose of 1500 μM of Mn the least (4-fold) (Figure 4C). Effect of Mn on mitochondrial and autophagosomes. SK-N-SH cells in 2% FBS medium were treated with 0, 300, 900, and 1500 μM Mn for 24 h. A, Morphology of mitochondria, 10000x, enlarged pictures are in red circle. B, Morphology of autophagosomes, 10000x, arrows indicate autophagosomes. C, The quantitation of autophagosomes. Data are expressed as mean ± SEM, n = 3. *Compared with the control group, P < .05.
Effect of Mn on PINK1, Parkin, and OPTN Expression
The expression of PINK1, Parkin, and OPTN protein in SK-N-SH cells were examined by Western Blot (Figure 5A). The PINK1/GAPDH ratios were .77, .68, and .29 of Control in 300, 900, and 1500 μM of Mn groups, respectively (Figure 5B); The Parkin/GAPDH ratios were .44, .38, and .37 of Control after 300, 900, and 1500 μM of Mn treatment, respectively (Figure 5C); The OPTN/GAPDH ratios were 1.27, 1.60, and 2.59 for control after 300, 900, and 1500 μM of Mn treatment, respectively (Figure 5D); Compared with the control group, the expression of PINK1 protein decreased in a concentration-dependent manner, and decreased by 70% at 1500 μM of Mn2+ group; Parkin protein decreased by 60% in Mn-treated groups; the expression of OPTN protein displayed the trend of increase in Mn-treated groups, and increased 2.6-fold at 1500 μM of Mn2+ group. Effects of Mn on PINK1, Parkin, and OPTN protein expression in SK-N-SH cells. A, The representative image of PINK1, Parkin, and OPTN via Western Blot; B, Parkin expression; C, PINK1 expression; D. OPTN expression. Data are expressed as mean ± SEM, n = 3. *Compared with the control group, P < .05.
Effects of Mn on LC3II/I Expression
The expressions of LC3Ⅱ, LC3Ⅰ protein in SK-N-SH cells 24 h after Mn treatment were examined by Western blot (Figure 6A). The LC3Ⅱ/LC3Ⅰ ratios were 1.37, .76, and .76 of Control in 300, 900, and 1500 μM of Mn groups, respectively (Figure 6B). Compared with the Control group, the LC3Ⅱ/LC3Ⅰ ratios increased 1.37-fold at 300 μM of Mn2+. However, it decreased to 75% of Control in Mn 900 μM and 1500 μM groups. Effects of Mn on LC3 protein expression. A The representative western blot image of LC3Ⅱ/LC3Ⅰ 24 h after Mn treatment in S-K-SH cell; B LC3Ⅱ/LC3Ⅰ expression. Data are expressed as mean ± SEM, n = 3.*Compared with the control group, P < .05.
Effect of Mn on α-Synuclein Expression and Dopamine Levels
The expression of α-synuclein (α-syn) and GAPDH protein in S-K-SH cells were examined by Western Blot (Figure 7A). The α-syn/GAPDH ratios were 1.00, 2.36, and 2.09 of Control in 300, 900, and 1500 μM Mn groups, respectively. Compared with the Control group, the expression of α-syn protein increased in 900 and 1500 μM of Mn groups (Figure 7B). The concentration of dopamine (DA) levels in cells were examined by ELISA. Compared with the Control group (400 pg/mL), 300 μM of Mn2 + slightly increased it to 432 pg/mL, while 900 and 1500 μM Mn2 + decreased it to 389 and 372 pg/mL, respectively (Figure 6C). Effects of Mn on expression of α-synuclein and dopamine levels in SK-N-SH cells. SK-N-SH cells in 2% FBS medium were treated with 0, 300, 900, and 1500 μM Mn for 24 h A, western blot detection of α-synuclein (α-syn) and GAPDH; B, quantitation of α-syn expression; C, dopamine (DA) concentration determination; Data are expressed as mean ± SEM, n = 3. *Compared with the Control group, P < .05.
Discussion
In our previous studies in Mn-exposed smelting workers, 7 rats,9,21 PC12 cells 22 and SH-SY5Y cells, 8 there is a relationship between Mn-induced dopaminergic neurons damage and the reduced level of Park2 (Parkin), but the mechanism of how Parkin as a biomarker is involved in Mn-induced dopaminergic neurons damage is still unclear. This study using SK-N-SH cells demonstrated that Mn produced cytotoxicity, ROS production, and mitochondrial damage in a concentration-dependent manner. However, mitophagy exhibited a biphasic manner: at the low concentration of Mn (300 μM), mitochondrial autophagosome increased 11-fold, but at the high concentration of Mn (1500 μM), the increase of mitochondrial autophagosome was attenuated to 4-fold, accompanied by reduced expression of PINK1/Parkin and LC3Ⅱ/Ⅰ. These results suggest that mitophagy was activated to protect the cells, but at the high dose, more damage occurred and the mitophagy-mediated protein PINK1/Parkin decreased to weak the compensation mechanism through mitophagy, resulting in increased apoptosis and the level of α-synuclein, with dec. reased dopamine production. This study is among the first to elucidate the dose-response relationship of Mn exposure, mitochondrial damage, PINK1/Parkin expression, and mitophagy.
Excessive Mn2+ exposure produces cytotoxicity to various neuron cells, including PC12 cells,22,23, SH-SY5Y cells, 8 and dopamine-producing SK-N-SH cells. 24 It is known that Mn(II) as Mn chloride is more cytotoxic than Mn(III)-pyrophosphate. 25 This study found that the viability of SK-N-SH cells decreased gradually with the increase of Mn2+ concentration, accompanied by increased ROS production, apoptosis, and mitochondrial damage.
Mitochondria are essential for cells to maintain physiological state and are the main source of ROS production.17,26 ROS play an important role in maintaining homeostasis and are also involved in the pathogenesis of various diseases through direct oxidative damage or activation of cell signaling pathways. 27 Michael Aschner pointed out that mitochondria are potential targets of Mn.4,28,29 Mn accumulates in the mitochondrial matrix through calcium (Ca2+) transporters, damages the mitochondrial membrane, and impairs cellular energy (ATP) metabolism. 26 The present study demonstrated that cellular ROS level increased with mitochondrial membrane potential decreased in a Mn concentration-dependent manner. Importantly, ultrastructural morphology clearly demonstrated the originally uniform-arranged mitochondrial cristae expanded, the membrane boundary was blurred, and mitochondrial autophagosome formed, indicating that the ROS production and mitochondrial damage are the main mechanisms of Mn-induced toxicity in SK-N-SH cells
Mitophagy is an intracellular degradation system. Unfolded proteins and damaged mitochondria in cytoplasm are wrapped by the isolation membrane to form mitophagosomes, which are then fused with the lysosomal membrane. After the contents are degraded, they provide energy and raw materials for intracellular organelle biogenesis, which is an important way of mitochondrial quality control. 30 The elimination of damaged mitochondria in mammals is mediated by a pathway comprised of PTEN-induced putative protein kinase 1 (PINK1) and the E3 ubiquitin ligase Parkin, and PINK1/Parkin-mediated mitophagy plays a protective role against Mn-induced toxicity in cells.11,17
Mitophagy induction emerges as a therapeutic strategy for neurodegenerative disease. 31 PARK2 encoded protein Parkin plays a downstream role of PINK1 which senses mitochondrial damage and activates Parkin to translocate from the cytoplasm to the damaged mitochondrial outer membrane to initiate mitophagy to eliminate damaged mitochondria, 32 and loss of PINK1 causes mitochondrial dysfunction and increased sensitivity to ROS. 33 In the present study, the expressions of PINK1 and Parkin decreased with the increase of Mn2+ concentration, resulting in attenuated mitophagy and increased cell death. This observation is consistent with our prior observations in Mn-exposed humans, animals, and cells,7–9 and in agreement with the literature.11,12,34 Knockdown PARK2 aggravated Mn toxicity, while PARK2 overexpression increased Parkin-mediated mitophagy to eliminate damaged mitochondria as an adaptive mechanism against Mn-induced cytotoxicity. 10
The cytosolic form of LC3 (LC3I) is converted to LC3 phosphatidylethanolamine conjugate (LC3II) and recruited to the autophagosome membrane, and LC3II/I often acts as an important reference index of autophagic flux. 35 When autophagic flux was blocked, LC3II/I was significantly inhibited, and the level of P62 was increased. 36
Optineurin (OPTN) proteins are mainly distributed in cytoplasm and are involved in multiple cellular pathways and are a selective autophagy receptor. 37 OPTN mutations and abnormal expression could block efficient autophagosome formation such as in amyotrophic lateral sclerosis, 38 and neurodegenerative diseases due to misfold proteins 39 due to defective mitophagy and accumulation of damaged mitochondria. 40 The present study found the level of OPTN increased gradually with the increase of Mn2+ concentration, suggesting the OPTN is associated with Mn toxicity with mitophagy attenuation.
Lewy bodies caused by misfolding and aggregation of α-syn protein are typical pathological features of Parkinson’s disease PD. 41 Overexpression or accumulation of α-synuclein protein repressed PINK1-Parkin-mediated mitophagy and exacerbated mitochondria damage in Mn toxicity. 42 Excessive Mn can induce neuroinflammation and autophagy dysfunction, 43 and autophagy dysregulation contributes to Mn-induced dopaminergic neurodegeneration. 34 The present study found that the level of α-synuclein protein increased with concomitant decreased in cellular dopamine content, and this defection could be due, at least in part, to compromised mitophagy with high dose of Mn exposure.
Conclusion
The study using SK-N-SH cells demonstrated that Mn dose-dependently decreased cell viability, increased ROS production and mitochondria damage. On the other hand, the PINK1/Parkin-mediated mitophagy showed a novel biphasic pattern: at the Mn low dose, mitophagy is activated to eliminate Mn-damaged mitochondria, but at the high dose, PINK1/Parkin decreased to attenuate mitophagy, resulting in increased apoptosis and the α-synuclein accumulation, leading to cell death.
Footnotes
Author Contributions
Yue Zhang: Conceptualization, Methodology, Data curation, Writing – original draft Visualization. Hong-Tao Hu: Investigation, Writing – review and editing, Visualization. Yu-Min Cao: review and editing, Visualization. Zhi-Gang Jiang: review and editing. Jie Liu: review and editing. Qi-Yuan Fan: Conceptualization, Writing – review and editing, Project administration, supervision, fund acquisition.
Declaration of Conflicting Interests
The author(s) declared no potential conflicts of interest with respect to the research, authorship, and/or publication of this article.
Funding
The author(s) disclosed receipt of the following financial support for the research, authorship, and/or publication of this article: This work was supported by National Natural Science Foundation of China (81860568).
Ethics in Publishing
All authors have read and approved the final version of manuscript. The manuscript is not submitted to other journals.