
Abstract
Purpose
Dose-response curves, which fit a multitude of experimental data derived from toxicology, are widely used in physics, chemistry, biology, and other fields. Although there are many dose-response models for fitting dose-response curves, the application of these models is limited by many restrictions and lacks universality, so there is a need for a novel, universal dynamical model that can improve fits to various types of dose-response curves.
Methods
We expand the hormetic Ricker model, taking the delay inherent in the dose-response into account, and develop a novel and dynamic delayed Ricker difference model (DRDM) to fit various types of dose-response curves. Furthermore, we compare the DRDM with other dose-response models to confirm that it can mimic different types of dose-response curves.
Data analysis
By fitting various types of dose-response data sets derived from drug applications, disease treatment, pest control, and plant management, and comparing the imitative effect of the DRDM with other models, we find that the DRDM fits monotonic dose-response data well and, in most circumstances, the DRDM has a better imitative effect to non-monotonic dose-response data with hormesis than other models do.
Results
The MSE of fits of the DRDM to S-shaped dose-response data (DS2-G) is not lower than those for four other models, but the MSE of fits to U-shaped (DS7) and inverted U-shaped dose-response data (DS10) were lower than for two other models. This means that the imitative effect of the DRDM is comparable to other models of monotonic dose-response data, but is a significant improvement compared to traditional models of non-monotonic dose-response data with hormesis.
Conclusion
We propose a novel dynamic model (DRDM) for fitting to various types of dose-response curves, which can reflect the dynamic trend of the population growth compared with traditional static dose-response models. By analyzing data, we have confirmed that the DRDM provides an ideal description of various dose-response observations and it can be used to fit a wide range of dose-response data sets, especially for hormetic data sets. Therefore, we conclude that the DRDM has a good universality for dose-response curve fitting.
Keywords
Introduction
Toxicology is concerned with the side effects of exogenous factors such as chemistry, physics, and biological factors on biological systems. One of the basic principles of toxicology research is the relationship between the toxic reaction (response) and the amount of the toxicant (dose), namely, the dose-response relationship. 1 The dose-response relationship usually depends on the time and route of exposure to the agents, involving many fields such as biology, medicine, pharmacology, and chemistry, with the dose being an important factor in determining the damage response to foreign compounds or physical stimulation. The concept of dose is relatively broad, it can refer to the amount given to the organisms, the amount of foreign compounds in contact with the organisms, the amount of foreign compounds absorbed into the organisms, or the concentration or content of foreign compounds in the target organs or organism fluids. Examples include the concentration of drugs or hormones, the intensity of radiation, the concentration of fertilizers and pesticides, and the amount of pesticides sprayed. 1 The response refers to the biological changes caused by a certain dose of foreign compounds or physical stimulation in contact with the organisms. The response can be almost anything such as the number of individuals, enzyme activity, the number of colonies, changes in organ noise, cell survival rate, accumulation of secondary messengers in cells, membrane potential, heart rate or muscle contraction accumulation, root length or dry weight of plants, and the death or reproduction rates of pests. 2
Dose-response curves have the dose as the x-axis and the response as the y-axis to establish a plane rectangular coordinate system, with dose-response toxicological experiment data included on the coordinate system to which dose-response models are fitted.
3
Due to the complexity of biological systems, there are diverse relationships between the toxicant dose and the toxic response, but they are usually complicated non-linear relationships. Different foreign compounds and types of physical stimulation can result in different types of response under different conditions, and dose-response relationships can show different types of curves. Therefore, nonlinear dose-response curves are usually divided into three categories: S-shaped, inverted U-shaped, and U-shaped (Figure 1). The S-shaped dose-response curve increases or decreases monotonically as the dose increases. The inverted U-shaped and U-shaped dose-response curves are non-monotonic curves. The inverted U-shaped dose-response curve first increases and then decreases as the dose increases, which is referred to as “low promotion and high inhibition.” The U-shaped dose-response curve first decreases and then increases as the dose increases, referred to as “low inhibition and high promotion.” Types of classic nonlinear dose-response curves: (a) Monotonically increasing S-shaped, non-hormetic data. The increasing trend of the curve shows the positive effect which increases gradually as the dose of agonists applied to the organisms increases. (b) Monotonically decreasing S-shaped, non-hormetic data. The decreasing trend of the curve shows that the positive effect decreases gradually as the dose of agonists applied to the organisms increases. (c) Inverted U-shaped, hormetic data. This curve first increases and then decreases depicting how low-dose agonists promote the organisms, and high-dose agonists inhibit the organisms. (d) U-shaped, hormetic data. This curve first decreases and then increases, depicting how low-dose agonists inhibit the organisms, and high-dose agonists promote them.
The inverted U-shaped and U-shaped dose-response curves reflect the phenomenon of a “biphasic dose effect” caused by different doses of exogenous compounds and physical stressors acting on the organisms, known as a “toxicological effect” (hormesis). 3 The phenomenon of hormesis can occur in biological, chemical, physical, and toxicological studies. For example, modern western medicine, 2 traditional Chinese medicine,4-6 antibiotics,7-9 bacteria, 10 organic pollutants, 11 insecticides,12-15 herbicides,16,17 phenolic compounds,18-20 wastewater,21,22 heavy metals,23-25 and ionic liquids.26,27
In the past few decades, much attention has been paid to finding suitable dose-response models to fit to dose-response curves. S-shaped dose-response curves can be fitted by many monotonic dose-response models, such as the log-logistic model,28-30 Logit model, Probit model, Weibull model, Box-Cox Logit, and other nonlinear regression models in statistics,31,32 the Hill-slope equation of receptor dynamics, 33 and the Gompertz model, 1 which characterizes the growth of biological populations. Inverted U-shaped and U-shaped dose-response curves can be described by many non-monotonic hormetic dose-response models such as the Brain–Cousens model, 34 based on expansion of the Log-logistic model, an adjusted version, the Cedergreen–Ritz–Streibig model 35 and multiplicative and additive Bi-logistic models. 36 Although there are many types of traditional dose-response models, their application is subject to their own particular limitations. For example, the Log-logistic model is symmetric about the inflection point, and it is necessary to assume that the data approximately obey a normal distribution.35,37 When the Brain–Cousens model describes a dose-response relationship with hormesis, the parameters’ ranges are conditional. In addition, the model fits the dose-response data with a steep slope, and there may be problems when the hormetic area is large and the effect increases rapidly at lower doses in the early stages.35,38 The Cedergreen–Ritz–Streibig model has uncertain parameters in parameter estimation, which cannot fully describe steep hormetic data in the hormetic zone, 38 and the goodness of the fit is poor in comparison with several other different models. 39
Traditional dose-response models have the following disadvantages. On the one hand, as the amount of experimental data increases, the traditional dose-response models are very varied and have become more and more complex. Specific dose-response models need to be used to fit different types of dose-response curves, but all of these model types lack universality. On the other hand, the above dose-response models are static models, which are nonlinear regression models based on the simple shape characteristics of the dose-response curves. The parameters of such models lack specific biological significance and cannot describe the internal dynamic growth and changes of the research subjects. Thus, given these disadvantages, there is, so far, no uniform and representative dose-response model suitable for fitting to various nonlinear dose-response curves. To deal with these problems, the purpose of the research presented here is to develop a highly flexible and universal dynamic model that can not only reflect the internal dynamic trend of the research subjects affected by exogenous compounds or physical stressors, but is also suitable for describing various types of dose-response curves.
The research builds on the article of Tang et al. 40 regarding models of living organisms responses to applications of exogenous compounds or physical stimulation. First, we derive a simple discrete intergenerational single-population model with three parameters. Second, considering the practical application, the adjustment factor of the intrinsic growth rate of the population is dependent on the instantaneous density of the population, and this adjustment response will have a delayed effect. For example, when drugs, pesticides, or other compounds act on a living body, they need to be metabolized and absorbed for a certain period before they can take effect. Therefore, we introduce a delayed effect parameter of the dose into the model. Next, we derive a novel, universal, and dynamic discrete delayed Ricker difference model (DRDM) that is suitable for modeling various types of dose-response curves, especially hormetic dose-response curves. Finally, we perform numerical simulation, parameter estimation and statistical analysis on multiple dose-response experimental data sets that involve the fields of drug application (including modern Western medicine and traditional Chinese medicine),4-6 disease treatment (including tumor, cancer, and other diseases),41-44 pest control,13-15 plant management16,17 etc., to verify the applicability and universality of the proposed DRDM for fitting different types of dose-response curves, especially those with hormesis. The DRDM not only has biological significance in its parameters and can dynamically monitor the internal dynamic development process of experimental subjects at the corresponding dose, but it also has universal applicability for fitting dose-response curves. The DRDM is convenient for modeling many different types of dose-response relationships in toxicology and biomedicine and is thus a ground-breaking addition to the dose-response model family.
Delayed Ricker Difference Model
For convenience, we collectively refer to exogenous chemical agents and physical stressors as agonists. Taking agonist-acting organisms as the research subject (i.e., a biological population), a single population biological model is established. Assuming that agonists act instantaneously on living organisms, consider discrete generations of a single species population, modeled by the following formula
40

The piecewise constant method
40
is employed in this subsection to derive the discrete Ricker model with instantaneous perturbations within each generation. We consider the following piecewise single species logistic model


Let X(s) = X s be the population size at time s, henceforth X s is the population size at time s and Xs+θ is the population size at time s + θ, θ ∈ [0, 1]. K ∈ (0, ∞) represents the carrying capacity of the environment.
Solving equation (2) yields


In equation (5), the regulatory factor of the intrinsic growth rate r of the population is the function

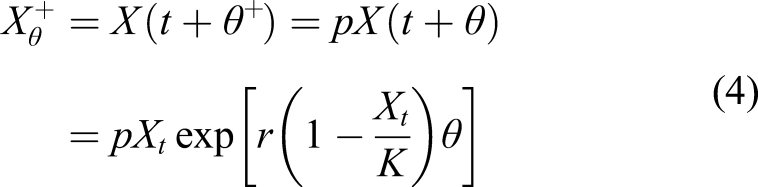
We designate equation (6) as the discrete-time delayed Ricker difference model (DRDM) for instantaneous disturbance control between generations. DRDM is a further expansion of the classic single-species Ricker model. It clearly reflects the intraspecific competition that restricts population growth after the agonists are applied at time t + θ. From the expression of the DRDM, it can be seen that it is a nonlinear combination of the growth function of the organism before the agonist action and the growth function after the agonist action.
Under usual circumstances, the greater the dose of the agonists, the higher the killing rate q and the lower the survival rate p of the population. At the same time, combined with the phenomenon of resistance of living organisms to acting agonists, as the dose increases, the decrease in survival rate p slows down. When the applied dosage of the agonists is large enough, the survival rate of the population tends to a stable value. In general, the survival rate p can be modified by incorporating the decay effect of the agonists as a negative exponential function about the agonists’ dose.
45
Specifically, the survival function p is given as equation (7) The relationship between the survival rate p and the dose Ds generated from equation (7). The solid line has parameter values of p
m
= .2, ν = .6, the dashed line has parameter values of p
m
= .2, ν = 1.5.


The DRDM defines the response in terms of six critical parameters: the intrinsic growth rate r of the biological population acted on by exogenous chemical agents or a physical stressor, the dose timing response θ (from the time when the organism receives the exogenous stimulation to the time when the experimental response data are recorded), the carrying capacity of the environment K, the lower bound p m of the survival rate function p, the slope parameter ν (which determines how steep the survival rate curve is), and the delayed effect τ of the agonists. Among them, the six parameters mainly represent four meanings: intrinsic growth rate, dose response, dose timing response of an intervention, and the delayed effect.
Compared with the traditional static dose-response models,1,28-36 the DRDM is a universal and dynamic time-delayed difference model taking biological significance, dose-response, and a delayed effect into account, which reflects the internal dynamic trend of the population and the biological effectiveness of the agonists. The main purpose of this is to show that the DRDM is suitable for fitting all kinds of non-linear (S-shaped, inverted U-shaped, and U-shaped) dose-response curves. In general, the DRDM is also helpful to further analyze the dynamic properties of living organisms after being acted on by agonists and thus represents a significant breakthrough in toxicology research.
Universal Curve Fitting
In this section, we apply the DRDM to fit 15 dose-response data sets to verify the universality of the DRDM. The 15 data sets embody different types of nonlinear dose-response curves and involve drug applications (including Chinese medicine), disease treatment (including tumor and cancer treatment), pest control, plant management, and other fields.
Data and Fitting Methods
Interpretations of the Data Sets.

DS1–DS3 are three representative data sets of S-shaped dose-response relationships obtained by a variety of toxicology experiments,33,46,47 which are all suitable for fitting S-shaped dose-response models. Among them, DS2 is about the application of herbicides. DS3 concerns toxicological effects of selenium. DS1 and DS3 are data suitable for monotonically increasing S-shaped dose-response curve fitting, and DS2 can be described by a monotonically decreasing S-shaped dose-response curve.
DS4–DS9 are six inverted U-shaped dose-response data sets displayed by plenty of experimental models and chemical agents.2,5,6,13 The dose-response data sets we fitted the DRDM to are from traditional Chinese medicine (DS4 and DS5), Western medicine (DS6), chemical agents (DS7), plant cultivation (DS8), and pest control (DS9).
DS10–DS15 are six U-shaped dose-response data sets displayed by a variety of experimental models and chemical agents, which all involve hormesis2,6,10 and are from traditional Chinese medicine (DS10 and DS11), tumor therapy (DS12), disease induction (DS13), Western medicine (DS14), and toxicological effects of chemical reagents (DS15).
The specific fitting methods used in this study are as follows:
Initial Values: Initially, the 6 parameters r, θ, K, p m , ν, and τ are given arbitrary values, and the initial iteration function is defined as a constant X0 at interval [− τ, 0] of the DRDM. The corresponding upper and lower bounds are adjusted within the specific ranges according to the parameters’ meanings;
Target Function:
Central Methods: We carry out 500 iterations of the DRDM at each fixed dose value and regard the final stable function value X500 as the estimated response value
Algorithm Description: The data fitting part of the research is implemented in MATLAB. The key point is to solve values of parameters minimizing target function in a predefined range with the fmincon in MATLAB. The target function is the sum of squares of the difference between the estimation and the real value. The fmincon can give a local optimum value after multiple iterations of selections on initial values of parameters. 51 When the value of target function locates within the acceptable range, the corresponding values give the estimation result. Due to the randomness of the selection of initial values of parameters, the estimation result is not unique. The specific algorithm is explained in the program.
S-shaped Dose-response Curves
S-shaped dose-response relationships exist widely in toxicology research. Here, we select dose-response experimental data that are appropriate for the two types of S-shaped dose-response curves and fit them with the DRDM for obtaining specific parameter estimates.
DS1: The static model used by Beam et al. to fit DS1 is the classic Hill equation
33

Dose-response Data from Applications of Two Herbicides, Glyphosate and Bentazone, to White Mustard (Sinapis alba). 46

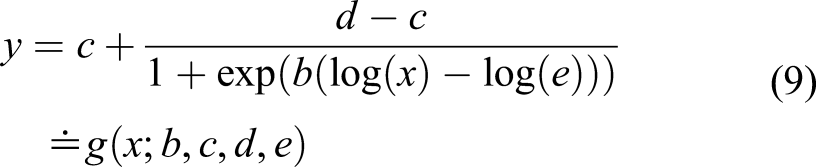
In the log-logistic model, x is the dose, y is the response, c is the response at infinite dose, d represents the response of the untreated control (y at x = 0), e is the effective dose at which the value of d − c is reduced by 50% (ED50), and b is the relative slope around ED50. 35
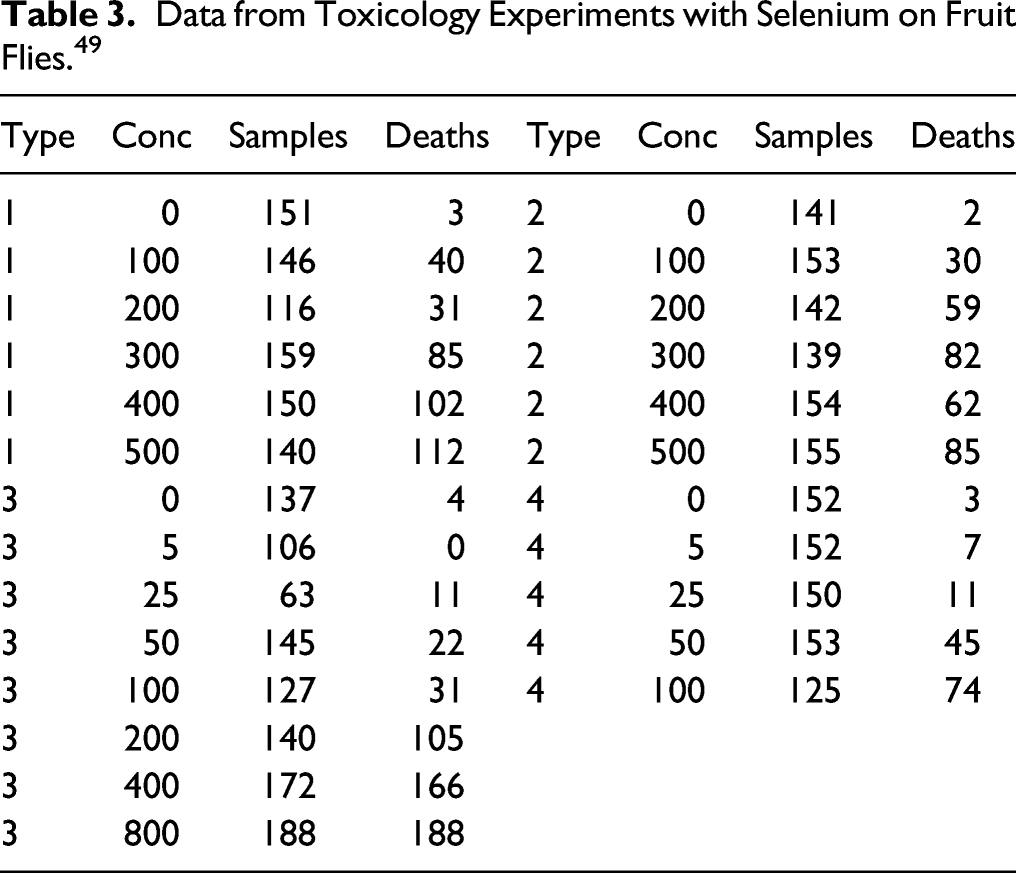
DS3: These data are from experiments to compare the toxicity to fruit flies of four different forms of selenium (selenate, selenite, selenomethionine, and selenocysteine). 47 Selenium is a metalloid with several valence states, each of which occurs in the environment at a significant concentration. Selenium is a non-metallic element, which can be used as a photosensitive material, a catalyst in the electrolytic manganese industry, an essential nutrient for animals, and a beneficial nutrient for plants. Christian et al. fitted the DS3 data with a 2-parameter static log-logistic model, with c = 0, d = 1 in equation (9). 49
Data from Toxicology Experiments with Selenium on Fruit Flies. 49
For a particular type of selenium, when the concentration of selenium is x
i
, the corresponding response y
i
can be determined as follows
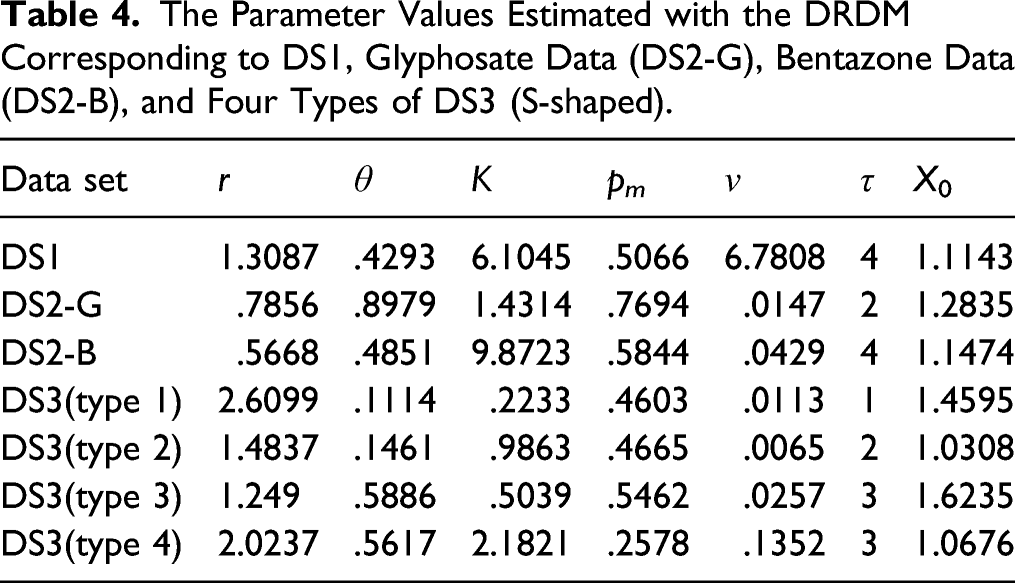
We used the DRDM derived in this paper to re-describe data sets DS1–DS3, respectively, as shown in Figures 3 and 4. The parameter estimation results for them are shown in Table 4. S-shaped dose-response data and DRDM model fits. Black dots and lines are original data; red squares and lines are the fitted DRDMs. (a) Monotonically increasing S-shaped dose-response data (DS1). (b) and (c) are monotonically decreasing S-shaped dose-response data and model for (b) DS2 (Glyphosate) and (c) DS2 (Bentazone). S-shaped dose-response data fitting with the DRDM. (a)-(d) The fitting results corresponding respectively to four different types of selenium in data set DS3. The black dots represent experimental data, and the red squares represent the fitting results of the DRDM models. The Parameter Values Estimated with the DRDM Corresponding to DS1, Glyphosate Data (DS2-G), Bentazone Data (DS2-B), and Four Types of DS3 (S-shaped).

Inverted U-shaped Dose-response Curves
Similar to the use of DRDM to fit the S-shaped dose-response curves, this section also selects multiple dose-response data sets from toxicology experiments, some with hormesis effects, suitable for fitting to inverted U-shaped curves.
DS4: Z-Ligustilide (Z-LIG) inhibits the survival rate of Acute Myeloid Leukemia cells (AML cells). 5 Specific AML cells include three types: HL-60 (human promyelocytic leukemia cells), KASUMI-1 (human acute myeloid leukemia cells), and U937 (human histiocytic lymphoma cells). Ligustilide is the main active ingredient of the volatile oil of Angelica sinensis (Umbelliferae), a traditional Chinese herbal medicine. It has a strong anti-spasmodic, anti-asthmatic, and sedative effect, and improves microcirculation, inhibits bacteria, relaxes smooth muscle, and improves the body’s immune regulation function. AML (acute myelocytic leukemia) is a general term for a type of leukemia. The cell survival rate is determined by the sulforhodamine B (SRB) colorimetric method, which is mainly used to detect cell proliferation.
DS5: This data set comprises experimental data on Ophiopogon japonicus saponin C (DT-13) inhibiting the survival rate of the same three types of AML cells (HL-60, KASUMI-1, and U937) as in DS4. 6 Ophiopogon japonicus saponins C is an extraction of the dried roots of Ophiopogon japonicus, a traditional Chinese medicine, which has anti-tumor effects. The survival rate of AML cells is also measured by SRB. Specifically, the dose for this data set is the concentration of DT-13, and the response is the survival rate of the three types of AML cells.
DRDM models were used to fit the three AML dose-response data in DS4 and DS5, and the fitting results are shown in Figures 5A–F, respectively. The parameter estimators are shown in Table 5. The Parameter Values Estimated with DRDMs Corresponding to DS4–DS9 (Inverted U-shaped).

DS6: These data come from a toxicological experiment on effects of sodium hypochlorite solution on human fibroblast protein. 2 Sodium hypochlorite solution is used for disinfection, sterilization, and water treatment. It is highly corrosive.
DS7: This data set comprises toxicological data on effects of penicillin on bacteria. 2 Penicillin, an antibiotic extracted from the fungus Penicillium, is anti-bacterial and commonly used in Western medicine.
DS8: This data set comes from an experiment on the effect of mercury on duckweed (subfamily Lemnoideae). 2 Mercury is the most toxic heavy metal element. After ingestion by a vertebrate animal, mercury goes directly to the liver, causing major damage to the brain, nerves, and vision. The mercury in natural rivers mainly comes from pollution originating from the chlor-alkali industry. The purpose of the experiment was to explore the effect of mercury in the water on the growth of duckweed plants.
DS9: This data set comes from a toxicology experiment that studied the effect of the insecticide deltamethrin against corn weevil pests Sitophilus zeamais. 13 The corn weevil is a pest of stored grains including corn (maize) Zea mays. Deltamethrin is the most toxic of the pyrethroid insecticides. It has swift contact killing and stomach poisoning effects. Guedes et al. fitted the DS9 data to simple static regression models (linear and quadratic), based on simplicity, high F-values, and steep increases of adjusted-R2 values with model complexity. 13
We fitted the DRDMs to the DS6–DS9 data sets, as shown in Figures 6A–D. The parameter estimation results are shown in Table 5. By observing the imitative effect of DRDM on data set DS6–DS9, it can be found that the imitative effect of DS6 is significantly worse than that of DS7–DS9. The difference is mainly due to two reasons. On the one hand, the fitting difficulty increases with volatile and large amount of data, in which more than one hormesis exists. On the other hand, the LSE method is sensitive to the initial value of parameters.
48
Only with good initial value can the imitative effect becomes better. Therefore, it infers that the selection of the initial value of parameters needs improvement for DS6. Inverted U-shaped dose-response data fitting with the DRDM. Black dots are experimental data, and the red squares are results of fitting the DRDM models. (a)-(d) Data and fits for DS6-DS9, respectively.
U-shaped Dose-response Curves
Figure 1D is the U-shaped dose-response curve, in which as the dose increases, the positive response first decreases and then increases. Both the U-shaped dose-response curves and the inverted U-shaped dose-response curves are data with hormetic responses, which are suitable for describing toxicological relationships with biphasic dose responses at different doses.
It is obvious that the U-shaped dose-response curve and the inverted U-shaped dose-response curve can be converted into each other by regarding the positive response of the U-shaped curve as the negative response of the inverted U-shaped curve. For example, the positive response corresponding to the inverted U-shaped data is the survival rate of the cells, and the positive response corresponding to the U-shaped data is the mortality of the cells. Similar to the use of the DRDM to fit the S-shaped and inverted U-shaped dose-response curves, in this section, we also select multiple dose-response data sets suitable for U-shaped curve fitting in toxicology experiments and use the DRDM to fit them and to estimate the corresponding parameter values.
DS10 and DS11: This data set is experimental data of Ophiopogon japonicus saponin C (DT-13) affecting the death rate of AML cells. 6 DS10 corresponds to the HL-60 (human primary myeloid leukemia cells) of the AML cells. DS11 refers to the U937 (human tissue cell lymphoma cells) of the AML cells. Ophiopogon japonicus saponins C is an extract of the dried roots of Ophiopogon japonicus, a traditional Chinese medicine, which has anti-tumor effects. The death rate of AML cells is also measured by SRB.
DS12: This data set comprises experimental data on the toxicological effects of γ rays (Gamma rays) inducing malignant tumors. 2 Gamma rays are electromagnetic waves with a wavelength shorter than .01 Å. They have strong penetrating power and can be used for flaw detection or automatic control of assembly lines in industry. They are also harmful to cells and are used medically to treat tumors.
DS13: Biological cells within a body will be inhibited, destroyed, or become necrotic when irradiated with X-rays, resulting in different degrees of physiological, pathological, and biochemical changes such as hair loss, skin burns, visual impairment, pneumonia, and leukemia. X-rays can also be used to treat some human diseases, especially tumors. The purpose of the experiment from which the data were derived was to explore the effect of X-rays on the probability of pneumonia in organisms. The amount of X-ray exposure to a whole mouse body was converted into the numerical range [0,1] (0 means no irradiation and 1 means the whole body is irradiated).
DS14: Phenobarbital is a barbiturate sedative and sleeping pill. It can be used for sedation, hypnosis, anticonvulsive therapy, anti-epileptic therapy, pre-anesthetic administration, treatment of neonatal hyperbilirubinemia, and is compatible with antipyretic analgesics. In the experiment, male rats were given different doses of phenobarbital to study its effects on sedation and anesthesia, measured by altered hepatic foci relative to a control group.
DS15: This data set comprises acute toxicity test data of 1-ethylpyridinium chloride ([epy]CI) on Vibrio qinghaiensis sp.-Q67 (Q67), 10 involving exposure at 12 different concentration levels for 12h. [epy]CI is a toxic pyridine compound, which can irritate the eyes, respiratory system, and skin of living organisms. Q67 is a freshwater luminous bacterium, which emits light. The luminescence of Q67 is constant in clean water, but is inhibited when affected by pollution, with the degree of inhibition related to the concentration of poisons in the water. Therefore, the toxicity of water samples can be evaluated by photometric measurements of the Q67 luminescence to provide a Q67 luminescence suppression ratio in relation to values for clean water.
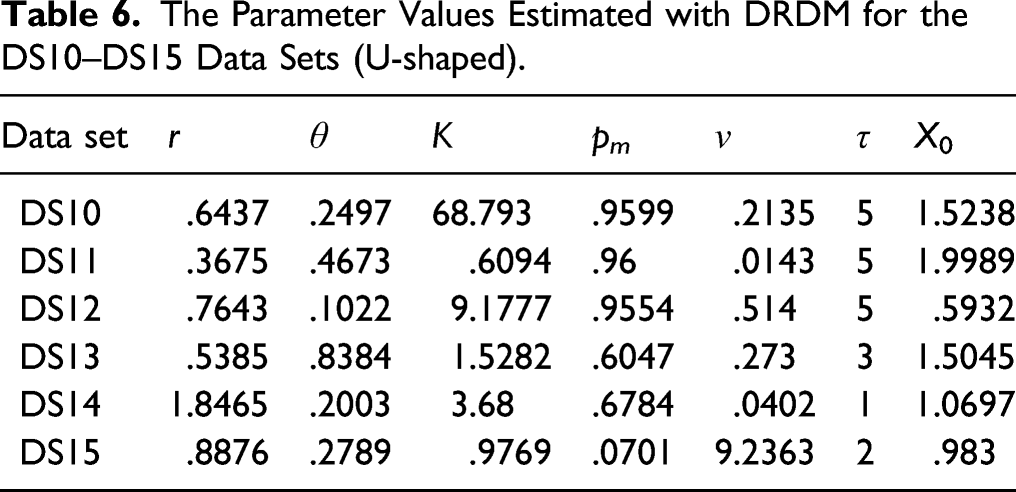
We fitted the DRDM to the data sets DS10–DS15, respectively. The fitting results are shown in Figure 7, and the parameter estimation results are shown in Table 6. U-shaped dose-response data fitting with the DRDM. (a)-(f) The fitting results corresponding to DS10-DS15, respectively. The black dots represent the experimental data, and the red squares represent the fitted DRDM model. The Parameter Values Estimated with DRDM for the DS10–DS15 Data Sets (U-shaped).
Results
A variety of commercial statistical software packages that can be used to analyze dose-response data are already available such as the expansion package drc, DoseFinding, drfit, grofit, MCPMod, and nstools provided in the statistical software R. 49 In this section, we compare the performance, in terms of the mean-square error (MSE) of the predicted models, of the DRDM model results with results from several well-recognized models. In this way, we verified the universality of our DRDM model for fitting dose-response data and the goodness of the various fits.
First of all, we choose to use the drc package in the R software to fit and analyze dose-response data using other models. Many more or less well-known model functions are built into the drc package. Specifically, we make use of four S-shaped dose-response models: generalized log-logistic model, log-logistic model, Weibull I model, and Weibull II model, and two hormetic dose-response models (Inverted U-shaped and U-shaped): the Brain-Cousens model and the Cedergreen–Ritz–Streibig model.
The log-logistic function, currently the most popular dose-response model, expresses dose-response as a monotonically increasing or decreasing sigmoidal curve that is symmetric about its point of inflection and assuming approximately normally distributed data.29,30,35 The model function of the 4-parameter log-logistic model is given by equation (9).
The generalized log-logistic model is similar to the log-logistic model, but has five parameters and its function is as follows
The Weibull I and Weibull II models are also suitable for describing monotonic dose-response data.
49
The model functions are

Figure 8 summarizes the parameters involved in simulations of these monotonic dose-response relationships in schematic diagrams which reflect the biological significance of the model parameters. Schematic diagrams of curves corresponding to the monotonic dose-response models and their parameters. (a) Monotonically increasing S-shaped dose-response curves. (b) Monotonically decreasing S-shaped dose-response curves.
Another model was first proposed by Brain and Cousens in 1989.
1
The Brain–Cousens model extended the original 4-parameter logistic model (9) by introducing the term fx to allow for hormesis. The model function is shown as equation (14).
In equation (14), the parameters c and d are as defined in equation (9). However, the parameters e and b lost their interpretations as the ED50 and relative slope at ED50, respectively, and thus have no straightforward biological meanings.35,37 The parameter f denotes the rate of stimulation of the response at low doses. If f = 0, equation (14) reduces to the 4-parameter logistic model equation (9). Thus, f ≠ 0 is a necessary condition for the presence of hormesis. The model can be used to describe typical inverted U-shaped (f > 0) and U-shaped (f < 0) curves describing actions of pharmaceuticals. 3
Consequent upon the inadequacies of the Brain–Cousens model as observed by Cedergreen and her co-workers, they modified the model by replacing the term fx in equation (14) with 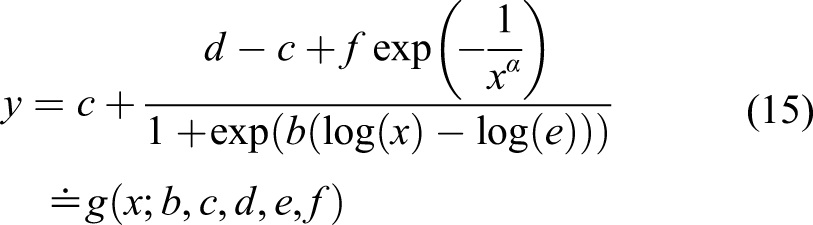
The U-shaped hormetic pattern of the Cedergreen–Ritz–Streibig model is shown in equation (16).
50

In summary, the schematic diagrams of the parameters in dose-response relationships simulated from these non-monotonic models are shown in Figure 9, which reflect the biological significance of their parameters. Schematic diagrams of curves and their parameters corresponding to non-monotonic dose-response models. (a) Non-monotonic inverted U-shaped dose-response curve. (b) Non-monotonic U-shaped dose-response curve.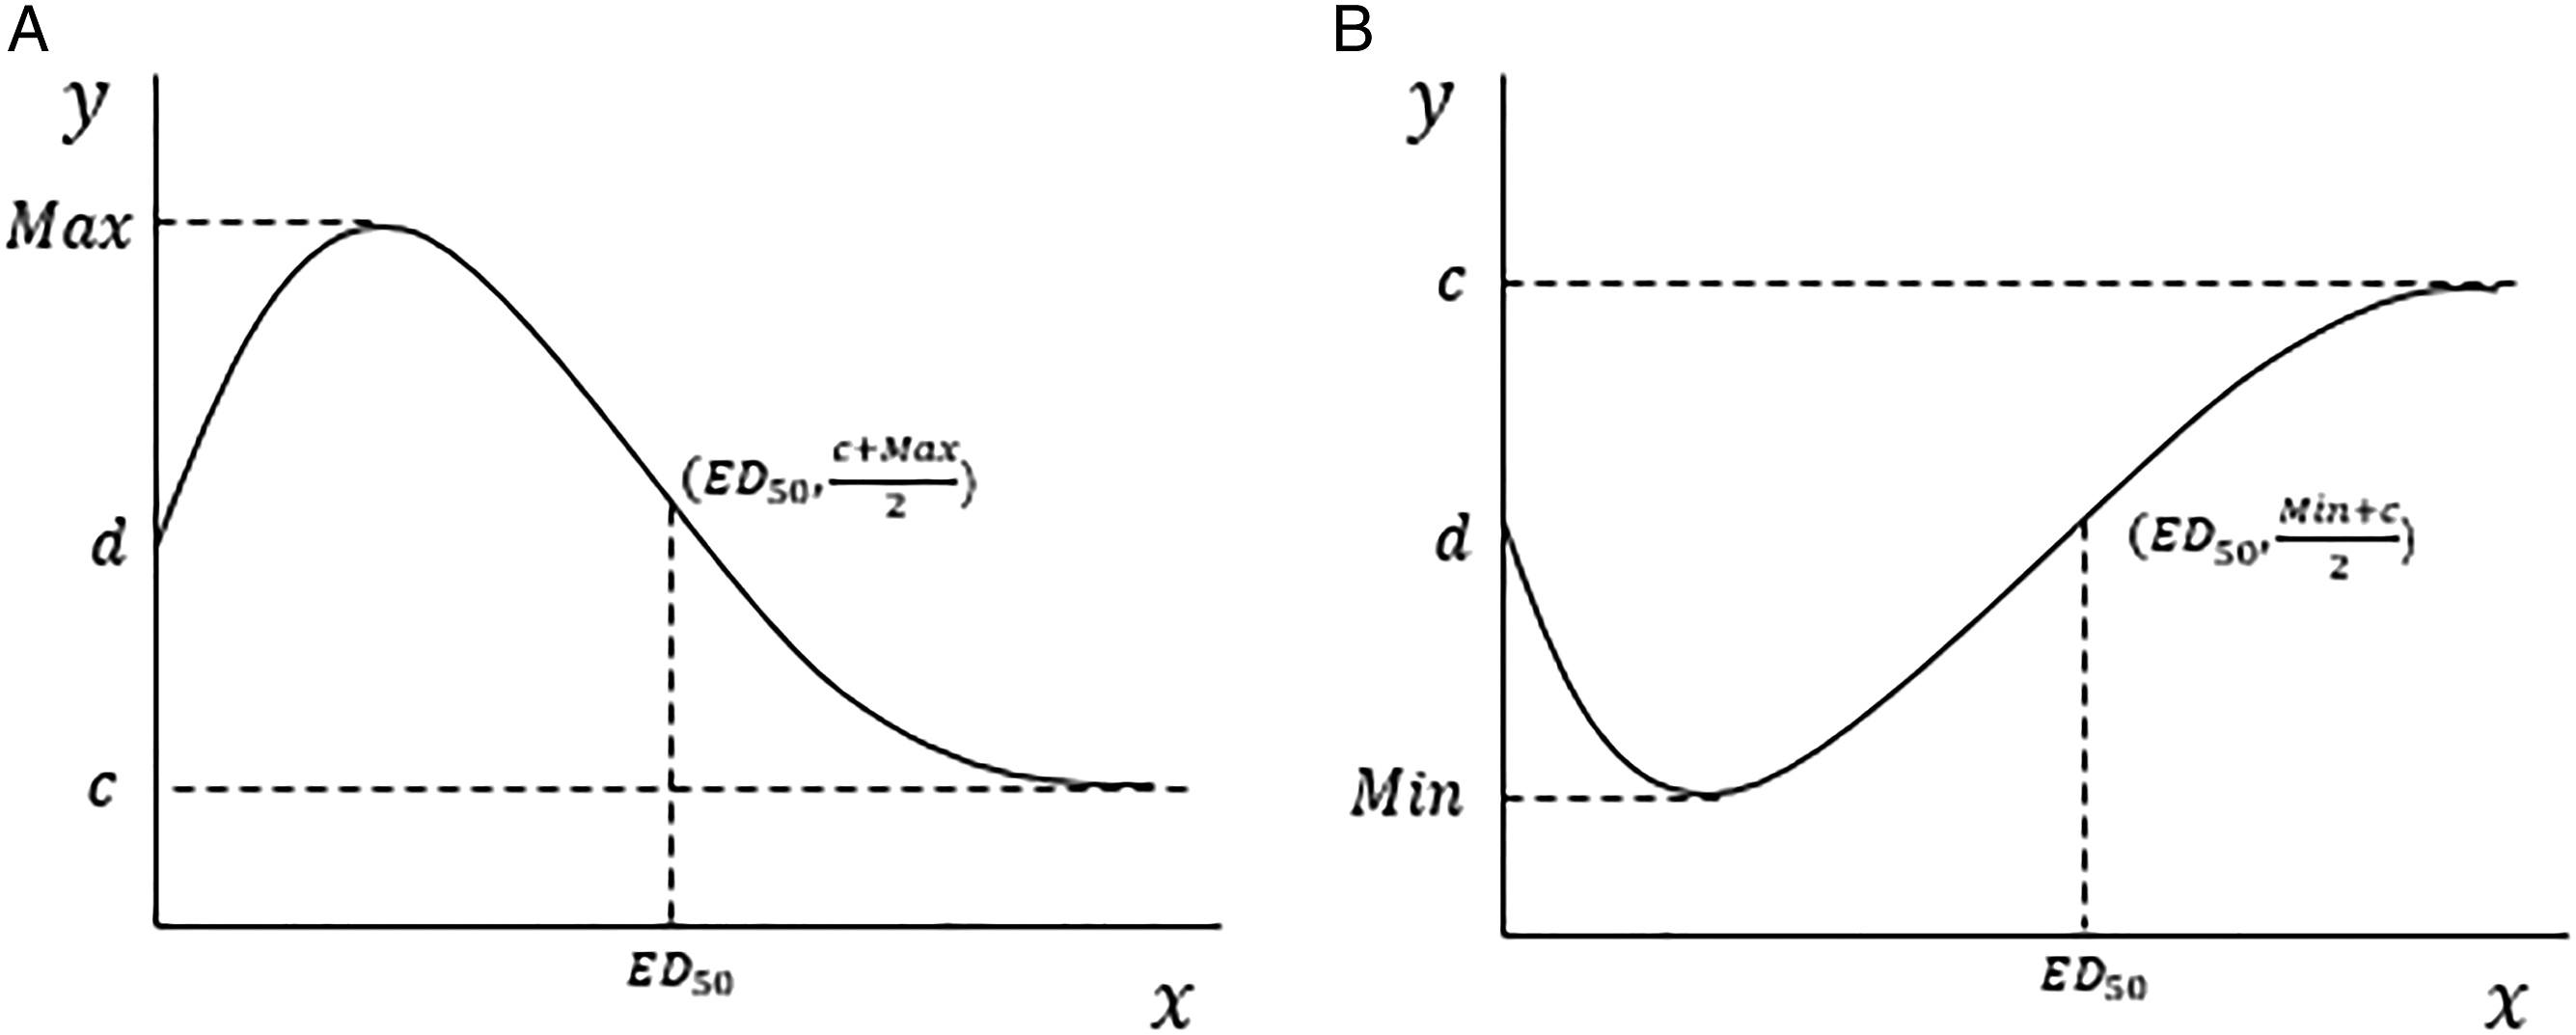
Next, we applied the DRDM, generalized log-logistic model, log-logistic model, Weibull I model, and Weibull II model, respectively, to simulate the DS2-G (S-shaped) data set. The DRDM, Brain–Cousens and Cedergreen–Ritz–Streibig models were used to simulate the DS7 (inverted U-shaped) and DS10 (U-shaped) data sets, respectively.
MSE is a measure that reflects the degree of difference between the estimated values and the true values. This statistic is the mean value of the sum of squares of the errors of the predicted data and the corresponding points of the original data. MSE can evaluate the degree of data change. The smaller the value of MSE, the better the accuracy of the predictive model to describe the experimental data.
51
The calculation of the MSE is shown in equation (17).
MSE Values for DS2-G(S-shaped), DS7(Inverted U-shaped), and DS10(U-Shaped) Fitted by the DRDM and Other Models.

From Table 7, it is clear that although the MSE of data set DS2-G fitted to the DRDM is low, it is not as low as those for the other four static models. Hence for DS2-G, the fitting result of the DRDM is not as good as that of the generalized log-logistic model, the log-logistic model, the Weibull I model, and Weibull II model. For data sets DS7 and DS10, it can be seen that the DRDM fits have the lowest MSE compared to the other three static hormetic dose-response models. Compared with each of the other traditional static models that are suitable for modeling dose-response relationships, the DRDM has significant advantages. To sum up, for simple dose-response curves, we can use relatively simple traditional static models. For dose-response curves with complex structure (i.e., strong non-linearity), especially those with hormesis, the dynamic DRDM model has significant fitting advantages and universality.
To further illustrate the imitative effect of the parameters in DRDM, we select the data set DS2-B and plot the 95% confidence intervals of 7 parameters (r, θ, K, p
m
, ν, τ, X0), as shown in Figure 10, and the interval estimates are shown in Table 8. The parameters’ 95% confidence intervals and real parameter estimates of DS2-B. The red stars represent the realistic parameter estimates obtained by DRDM fitting, and the blue lines corresponding to the parameters 95% confidence intervals. The Parameters’ 95% Confidence Intervals of Data Set DS2-B.

Discussion
Research on dose-response models has paid attention to their application, adjustment, re-parameterization, and to statistical tests of their performance for several decades. 1 Authors of many review articles on dose-response models suggest that new dose-response models should be developed in the light of new toxicology experiments, especially for modeling dose-response curves with hormesis, which is challenging.1,2
The main purpose of this paper is to develop a novel and universal dose-response dynamic model that can better fit the various types of dose-response curves. At the same time, the model needs to conform to the population dynamics of individual organisms, and the parameters of the new model need to have biological significance. Therefore, in this study, we extend the classic single-population Ricker model from the perspective of the population dynamics of the affected organisms. In addition, the delayed factor of dose-response is added, and a new 6-parameter discrete Ricker difference model (DRDM) is established. The six parameters are (1) the intrinsic growth rate of the population r of the biological population acted on by exogenous chemical agents or physical stressors, (2) the dose timing response θ (the time from when an organism receives the exogenous stimulation to the time when data on an experimental response is obtained), (3) the carrying capacity of the environment K, (4) the lower bound p m of the survival rate, (5) the slope parameter ν (which determines how steep the survival rate curve is), and (6) the delayed effect τ of the response.
We fitted the DRDM that we derived to 15 toxicological data sets by estimating the appropriate parameters. These data sets included three suitable for S-shaped dose-response curves, six for inverted U-shaped dose-response curves, and six for U-shaped dose-response curves. From the graphical results of these data simulations, the DRDM fitted well to different types of dose-response data, and so it has a certain degree of universality. Furthermore, from the 15 data sets, we selected one from each of three types of dose-response curves for statistical analysis. By calculating the MSEs, the DRDM was compared to several other traditional dose-response models, and the results showed that the imitative effect of the DRDM for an S-shaped dose-response curve is not as good as fits of the log-logistic model, the generalized log-logistic model, the Weibull I model, and the Weibull II model, which may be because of the strong non-linearity between dose and response in this case. However, the imitative effects of the DRDM for modeling inverted U-shaped and U-shaped dose-response curves were significantly better than those of the Brain–Cousens model and the Cedergreen–Ritz–Streibig model, so the DRDM is more effective for fitting hormetic dose-response curves. Therefore, we conclude that the DRDM proposed in this study is a novel and universal dose-response model as our data simulation and comparative analysis showed the DRDM to be more convincing in fitting different types of dose-response curves.
For toxicology applications, on the one hand, the DRDM can help scholars to fit dose-response curves, predict the response values of different doses, and determine the hormetic area of the dose-response curve. On the other hand, parameter estimates of the DRDM can help in the analysis of characteristics of the population dynamics of organisms after being subjected to exogenous compounds or physical pressure. For example, the parameter
Although we have revealed results of importance, our research also has some limitations. First, according to the simulation results of multiple sets of toxicological experiment data and the comparative analysis based on MSE values, the DRDM is more applicable for fitting to dose-response data sets with hormesis than to those without hormesis, although it does fit monotonic dose-response curves too. Second, the DRDM has no explicit formula for the ED50 and other effective doses ED x , where x is the percentage decrease. It is necessary to estimate these parameters through re-parameterization or other mathematical methods and perform statistical tests on them. Third, the LSE method used for parameter estimation is sensitive to initial values. 48
In summary, our research has developed a novel and universal dose-response dynamic model that can be used for fitting non-linear dose-response curves. It provides a theoretical basis for research in toxicology, biology, chemistry, and other fields, and provides a universal dynamical model to address related dose-response curves issues. We also note that in toxicology experiments there are dose-response relationships affected by randomness due to environmental factors (temperature, humidity, soil, ultraviolet light, etc.), diet, resistance to pesticides, or drugs, and such random perturbations play significant roles in inducing toxicological effects (hormesis), which are challenging to characterize. Therefore, our next goal is to take random factors into account, develop a more general mathematical model with randomness to describe dose-response relationships and toxicological effects, and carry out further in-depth research on toxicological effects and dose-response models for expanding future research directions.
Program Accessibility
The major programs are freely available by email corresponding author Tang.
Footnotes
Acknowledgments
The authors thank Professor Hongyi Qi, School of Pharmacy, Southwest University, for facilitating our work by providing experimental data on traditional Chinese medicine.
Declaration of Conflicting Interests
The author(s) declared no potential conflicts of interest with respect to the research, authorship, and/or publication of this article.
Funding
The author(s) disclosed receipt of the following financial support for the research, authorship, and/or publication of this article: This work was supported by the National Natural Science Foundation of China [grant numbers 12031010, 61772017].