
Abstract
Introduction
Whole-body vibration (WBV) exercise is a form of exercise that has been shown to induce acute neuromuscular responses similar to those induced by resistance exercise (eg, temporary muscle fatigue and reduction in strength and power). 1 -4 Additionally, as with resistance exercise, acute exposure to WBV has been shown to increase serum anabolic hormone concentrations (ie, testosterone and growth hormone) 5 -9 and to cause muscle damage and inflammation. 10
In the extensive resistance training literature, the transient change in specific hormones following a single training session has led to the development of program designs and strategies that maximize acute physiological functions, which then lead to specific adaptations over time. 11,12
Since the mid-1900s, the body of knowledge of resistance training has received important contributions from several studies 13 ; conversely, the use of WBV for therapeutic and performance purposes 1,14 -16 has only been developed over the last 2 decades, and there is still limited consensus on how to appropriately design training programs. 17 Whole-body vibration exercise programs varied considerably across several investigations, yielding conflicting results. 16 The magnitudes of acute neuromuscular and hormonal responses are affected by WBV parameters, such as acceleration, 1,3 duration, 18 and whether they are in combination with a maximal voluntary contraction 19 -22 and/or external load. 23 The magnitudes of WBV training seem to be one of the main parameters used to quantify the WBV load. 2 Whole-body vibration training can also be individualized by modulating amplitude and frequency to maximize muscle activation 24 -28 and motor unit recruitment. 29 By individualizing the acceleration load, 26,27 greater recruitment of muscle fibers acts as a potent metabolic stressor and maximizes the neuroendocrine response. 12 This, in turn, mediates the integrated physiological events that are involved in the catabolic–anabolic process of tissue remodeling in a similar way to resistance training exercise prescription. 12
Recently, Di Giminiani et al 6 showed that the growth hormone (GH) response is particularly sensitive to WBV applied on the upper extremities in recreationally active subjects; the GH response to WBV with high acceleration (from 2.88 to 5.72 g) is greater (ie, a 40-fold increase) than that to WBV with low acceleration (from 0.12 to 0.36 g; ie, a 30-fold increase). The testosterone response to WBV was independent of the magnitude of WBV and similar for the 2 vibration interventions, suggesting that testosterone may not be affected by magnitude. In the latter study, the increase in circulating GH was similar to that induced by a conventional resistance exercise program aimed at improving hypertrophy. 30 However, in the study by Di Giminiani, it is important to emphasize that WBV was applied on the upper extremities; this condition resulted in an exhaustive vibration intervention, with muscle activation values (pectoralis major) not unlike those detected during maximal isometric voluntary contraction as well as the related fatigue effect. Based on these results, we hypothesized that individualized WBV applied to the lower body would maximize the biochemical response since the acceleration load would be determined relatively according to the subject response. In this way, the lower leg muscles would be activated to their highest values to dampen the sinusoidal waves, 27 inducing an increase in the concentrations of hormones (ie, GH, testosterone, and cortisol) that is proportional to the recruited muscle volume relative to exercise intensity. 12
To test our hypothesis, we investigated the acute residual hormonal (GH, testosterone and cortisol), biochemical (IL-6 and CK), and neuromuscular (maximal isometric voluntary contraction, power and muscle activation) responses to a single session of individualized WBV while maintaining an isometric half-squat position.
Methods
Experimental Design and Participants
A study design with 2 parallel groups and repeated measures was used. The participants were randomized into 2 groups, with randomization sequences generated using statistical software (Pass 13-NCSS, LLC Kaysville), and they were blinded to the study hypothesis. The assessors were blinded to the type of treatment received by the participants. The sample size estimation for the primary outcomes was computed a priori for within- and between-group comparisons. We used G-Power (G*Power 3.1.9.4; Heinrich Heine-Dusseldorf University), setting the effect size (ES) values to those of previous studies 6,8 and using the protocol for a power analysis (test attributes: t tests, nonparametric repeated-measures analysis, within-between groups, large ES [1.30 -1.60], α = 0.05, power [1-β] = 0.90, sample size n = 20 participants).
The exclusion criteria included a history of back pain, acute inflammation of the pelvis and/or lower extremities, acute thrombosis, tumors, recent fractures, recent implants, gallstones, kidney or bladder stones, any disease of the spine, peripheral vascular disease, and severely delayed muscle soreness in the lower extremities. Twenty male sport science students voluntarily participated in the present study, giving written informed consent, and the experiments were conducted at the Laboratory of Biomechanics of the University according to the World Medical Association Declaration of Helsinki. The Board of the University of L’Aquila approved the study. The participants were assigned to a whole-body vibration group (WBV), age: 22.7 (0.6) years; body mass: 72.8 (3.2) kg; height: 1.79 (0.02) cm; body mass index: 22.6 (0.6) kg m2; lean body mass: 58.2 (1.9) kg, or a control group (ISOM), age: 22.2 (0.8) years; body mass: 69.0 (1.9) kg; height: 1.76 (0.02) cm; body mass index: 22.3 (0.5) kg m2; lean body mass: 55.6 (1.5) kg. The lean body mass values were estimated using a semi-mechanistic model
31
Biochemical and Neuromuscular Variables (Baseline Measurements).
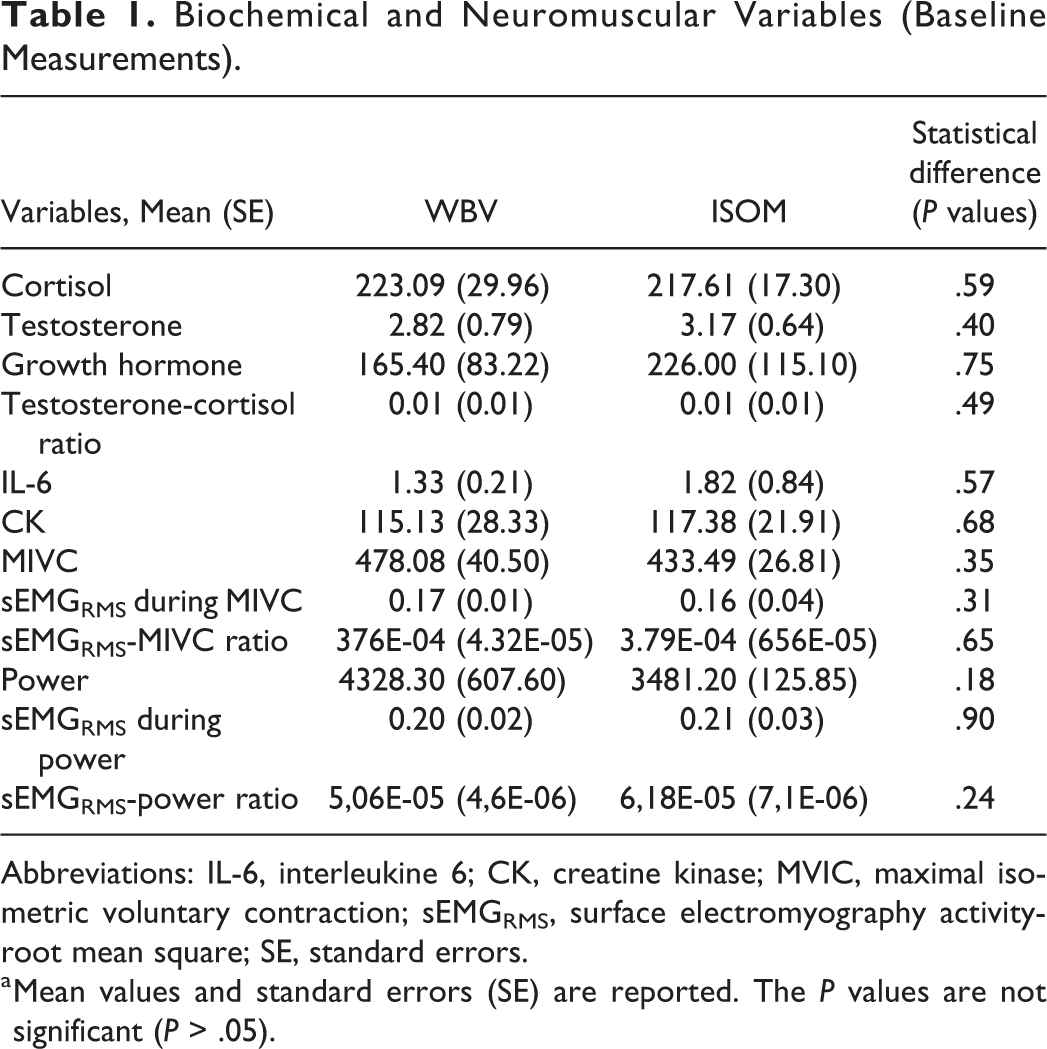
Abbreviations: IL-6, interleukine 6; CK, creatine kinase; MVIC, maximal isometric voluntary contraction; sEMGRMS, surface electromyography activity-root mean square; SE, standard errors.
a Mean values and standard errors (SE) are reported. The P values are not significant (P > .05).
Experimental Day Procedures
For each participant, the experiment was conducted over 2 laboratory visits (Figure 1) separated by at least 48 hours. On the first laboratory visit, the participants became familiar with the testing procedures, undertook the protocol to determine the individualized level of WBV by monitoring electromyography (EMG) activity at different acceleration loads and performed maximal voluntary contractions (MVCs) at the end of the laboratory visit. A rectangular protocol to determine the optimal vibration load was carried out by each participant (Figure 2). Each participant performed 7 trials in a random order (ISOM, 0.18, 0.30, 1.10, 1.90, 5.70 and 8.40 g, where g is the Earth’s gravitational field or 9.81 m·s−2). Each trial lasted 30 seconds, with a 4-minute rest between trials. The EMG activity of the vastus lateralis (VL), biceps femoris (BF), lateral gastrocnemius (LG), and tibialis anterior (TA) muscles was detected on the dominant leg, 32 which was determined by asking the participant which leg was preferred to kick a ball. Subsequently, the acceleration corresponding to the maximal EMG response was selected for the intervention in the WBV group (Figure 2). 25,26 The MVCs were performed during a leg extension (90°) for VL, a calf raise for the LG, ankle flexion for TA, and a leg curl for BF to normalize EMG activity 33 detected during WBV.
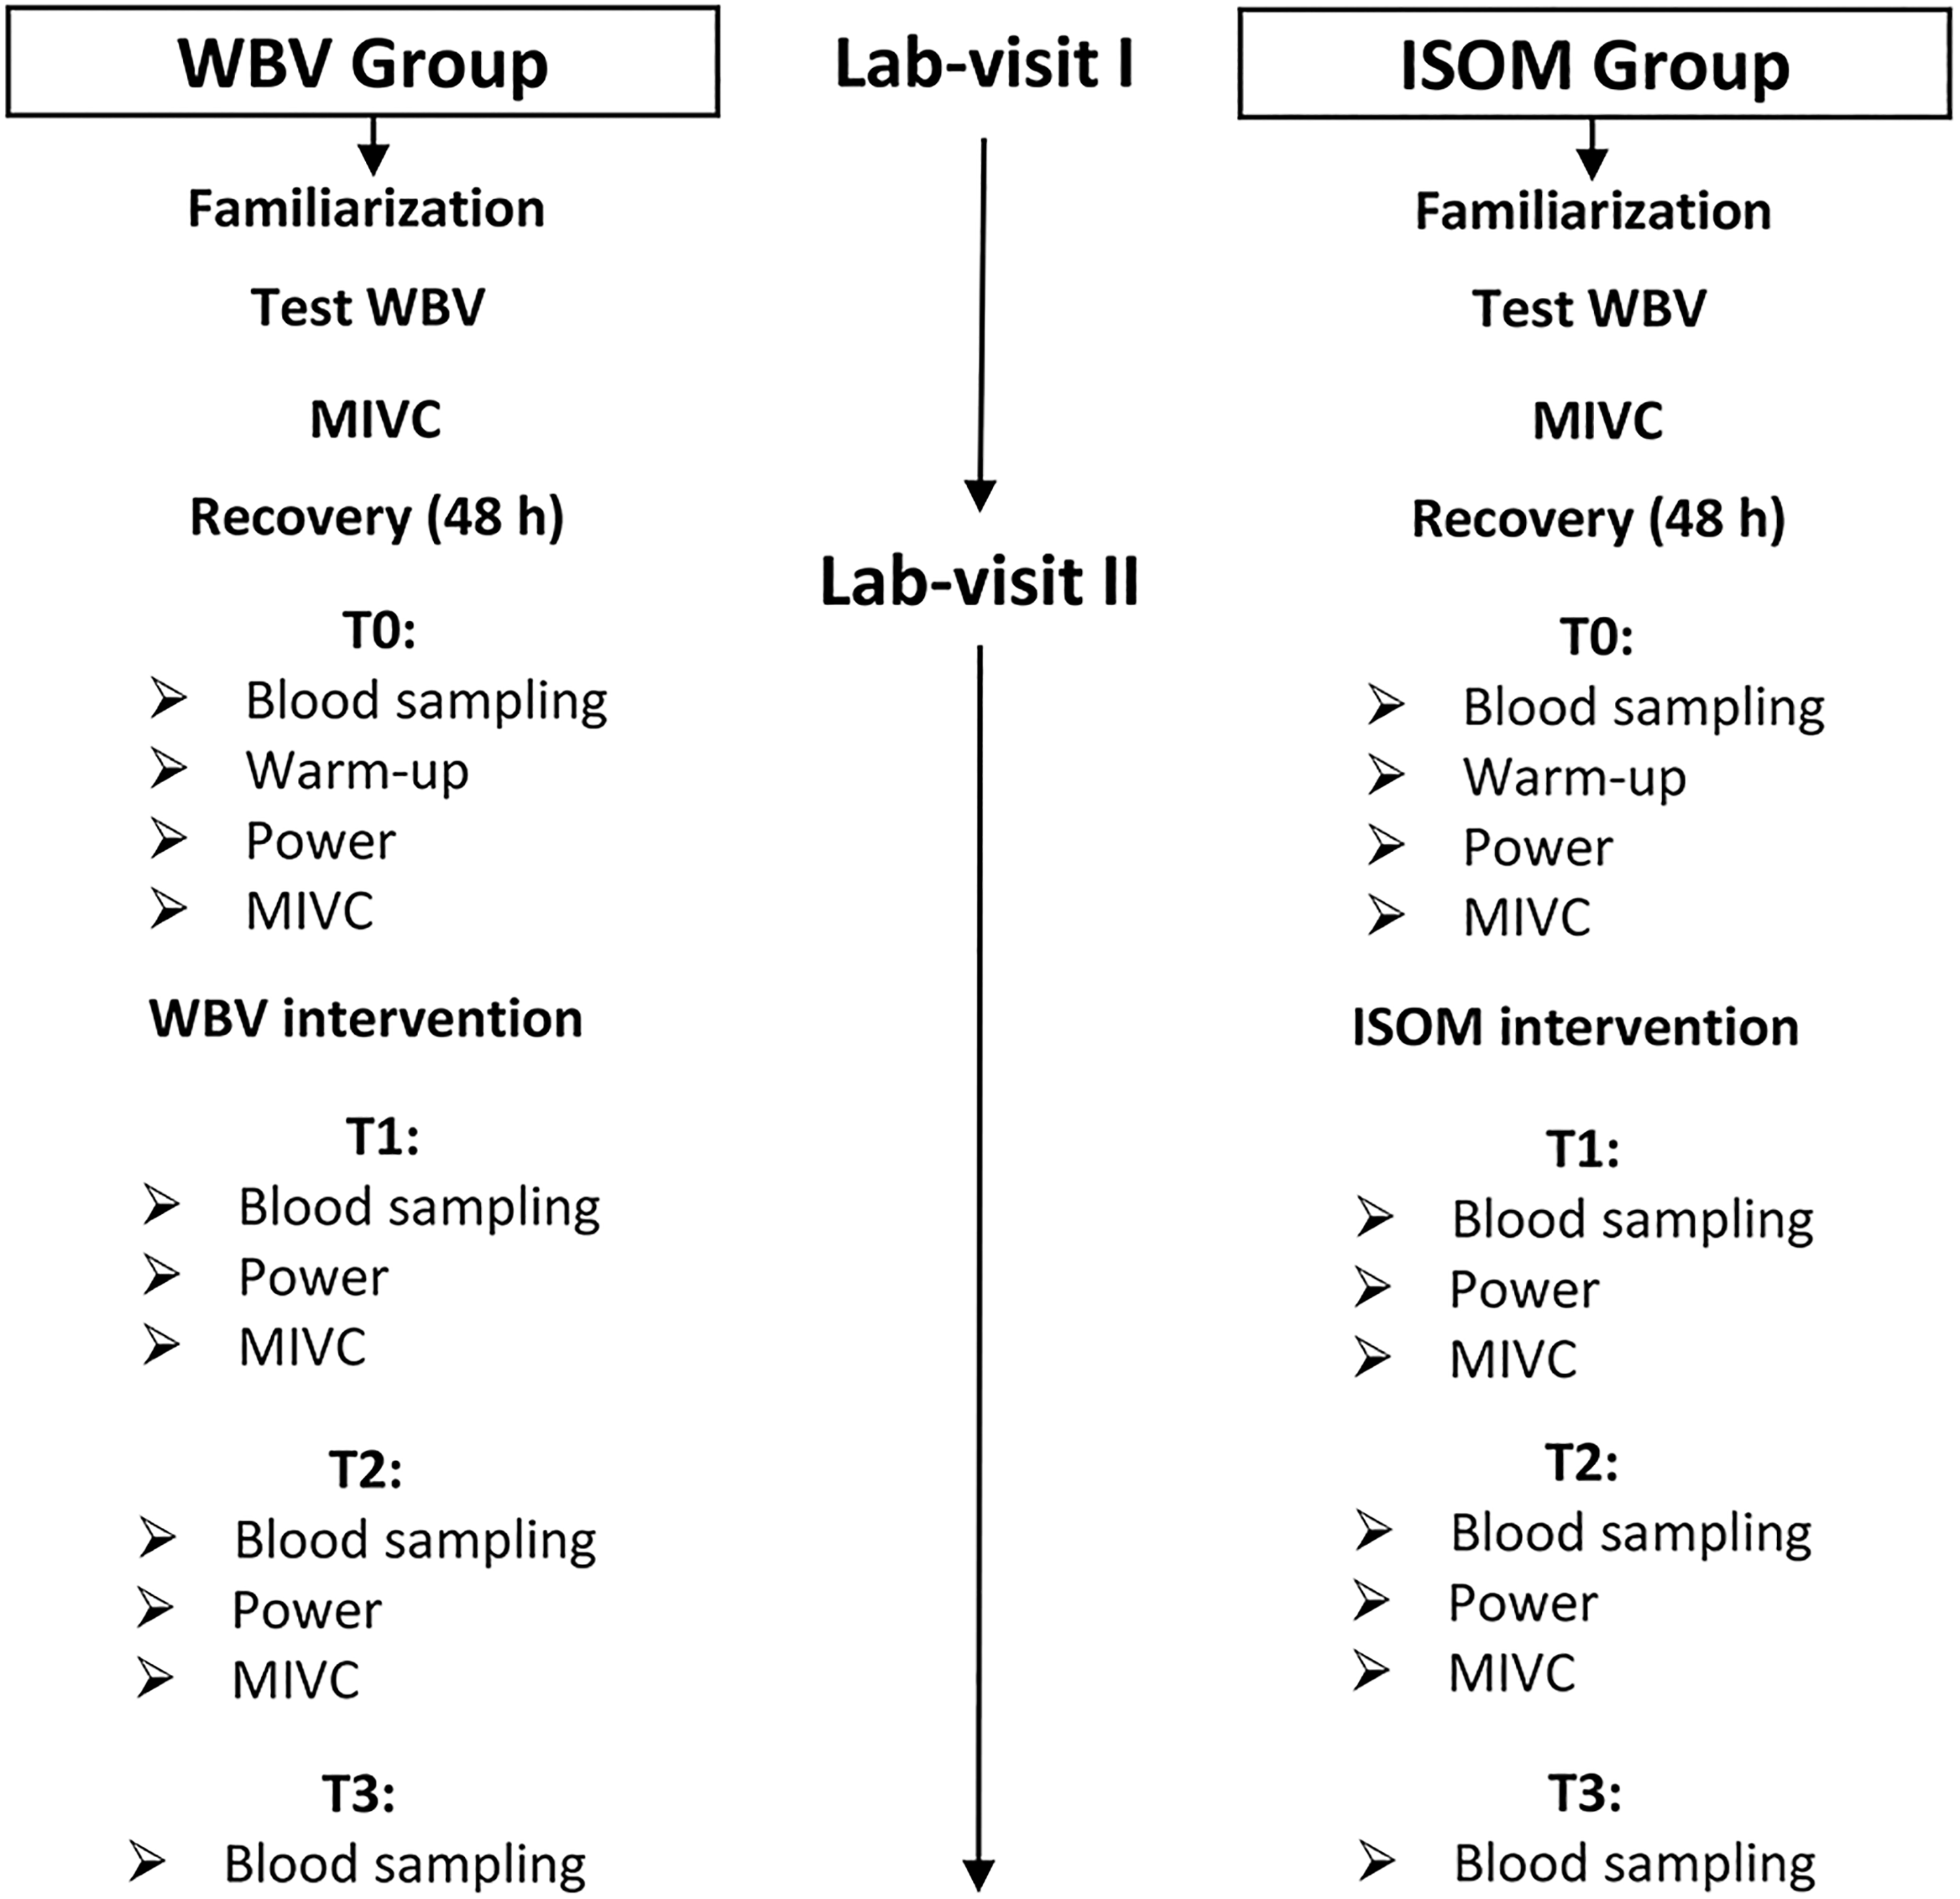
Flow diagram of the experimental procedure. Measurements were carried out during 2 laboratory visits at baseline (Time 0, T0), immediately after treatment (Time 1, T1), and 1 hour after treatment (Time 2, T2), and 2 hours after treatment (Time 3, T3), at which time point blood sampling was also performed. MIVC indicates maximal isometric voluntary contraction; Test WBV: protocol to determine the individual acceleration load during whole-body vibration.

(A-D) Relationship between acceleration (dose) and electromyography (EMG) activity (response) of leg muscles normalized to maximal isometric voluntary contraction (MIVC). EMG activity was recorded in the vastus lateralis (VL), biceps femoris (BF), tibialis anterior (TA), and lateral gastrocnemius (LG) during several trials at different acceleration loads (ISOMETRIC or 0, 0.18, 0.30, 1.10, 1.90, 5.70 and 8.40 g (where g is the Earth’s gravitational field or 9.81 m·s−2). The trials were performed in random order with a 4-minute rest between them, with each trial lasting 30 seconds. During the test (rectangular protocol), the participants assumed a half-squat position with heels raised on the vibrating plate. The arrows indicate the highest neuromuscular responses (optimal acceleration load). Examples for all the participants (mean and Standard error; A) and for participants (B), (C), and (D).
On the second laboratory visit (Figure 1), each participant visited the laboratory and rested for 30 minutes prior to the baseline blood sampling for biochemical analysis (Time 0, T0), and then there was a 15-minute warm-up (6 minutes of treadmill running at a speed of 6 km · h−1; 4 minutes of stretching and conventional leg exercises [skips, jumps, and rebounds]) before the other baseline measurements (T0) were taken. These included MVC (leg extension) and power (SJ) synchronized to EMG activities. Next, each participant undertook treatment (specific to his assigned group), and EMG activities were detected during the interventions. The measurements were repeated immediately after treatment (Time 1, T1), after 1 hour (Time 2, T2), and 2 hours after treatment (Time 3, T3), at which time point blood sampling was also performed; MIVC and power measurements were not carried out because these would have required an additional warm-up, and this lengthened the laboratory session too much, making it not feasible. All measurements were performed at consistent times of day (10:00-14:00) to reduce the potential effect of diurnal variation in hormone secretion and neuromuscular variables.
Serum Collection
On the second experimental day (Figure 1), participants visited the laboratory and rested for 30 minutes prior to the first blood sample being taken. Blood samples were drawn into vacutainers from the antecubital forearm vein using a 20-gauge needle for the biochemical measurements. Blood was collected into serum-separator tubes (Greiner Bio-One), allowed to clot for 30 minutes at room temperature, and then centrifuged at 2000 g for 10 minutes. Sera were then harvested in aseptic conditions and frozen at −80°C for storage.
Enzyme-Linked Immunosorbent Assay and Reflotron Assay
Serum samples were allowed to thaw in ice and then mixed thoroughly before assaying. Enzyme-linked immunosorbent assays (ELISAs) for testosterone (cat#ab108666; Abcam), cortisol (cat#ab108665; Abcam), growth hormone (GH, cat#ab190811; Abcam), and interleukin (IL)-6 (cat#D6050; R&D), and the Reflotron assay for creatine kinase (cat#11126695; Roche) were carried out following the manufacturer’s instructions. The sensitivities of these assays were 0.07 ng/mL, 2.44 ng/mL, 1.4 pg/mL, 0.7 pg/mL, and 24.4 U/L, respectively. The intra- and interassay variability coefficients for the ELISAs were 5.8% and 10.5% for testosterone, 9% and 9.8% for cortisol, 3% and 1.6% for GH, and 2.6% and 4.5% for IL-6. To calculate sample concentrations in ELISA, the optical density (OD) of the standards was zero-corrected for blank value and then regressed against their concentration using a 4-parameter logistic (4-PL) model. Once the standard curve had been obtained, unknown sample concentration was calculated by substituting their zero-corrected OD value in the standard curve equation. For Reflotron assays, the concentration was automatically determined by the Reflotron Plus device.
MVC and Power Measurements
MVCs synchronized to EMG activity (VL and BF) during unilateral leg extension were measured using a strain gauge (Ergotest Innovation) installed on a seated knee extension machine. The measurements were carried out on the dominant leg 32 with the knee bent at 90°. During MVC, each participant performed a maximum of 3 attempts without a time constraint, and the final average value was calculated. Each maximal attempt was separated by a 1- to 2-minute rest. The participants were instructed to contract their leg muscles as hard and as fast as possible, and strong verbal encouragement was provided during each MVC attempt. Verbal encouragement was given by an experimenter (the same person every time) who said to the participants “push, push, push…” for approximately 5 to 8 seconds. Participants began the task when the verbal encouragement began and continued until the end of the verbal encouragement. 34 The task ended when the force-time histories reached a plateau that was monitored real time through Muscle-Lab software (Muscle-Lab 4000e). The EMG activity (VL, BF, LG, and TA) and the peak power were assessed during a jump performance (SJ). The peak power was selected for analysis because it is most associated with vertical jump performance, 35 Additionally, muscle alterations resulting from fatigue and changes in hormone milieu could affect the ability to generate peak power. 36 Participants performed the SJ on a force platform 37 (Ergotest Innovation). Maximum knee flexion during the SJ (∼ 90°) was measured using an electrogoniometer connected to a Muscle-Lab (Ergotest Innovation). The participants were also instructed to place their hands on their hips and to extend their knees completely during the jump. Three repetitions were performed, and the jump with the highest power value was considered for analysis. MVC and power measurements were taken pre- (T0) and postintervention (T1: immediately after the end of the treatment; T2: 1 hour after the end of the treatments).
Electromyography Activity
The root mean square of the surface electromyographic activity (sEMGRMS) was detected by using triode electrodes (T3402 M, nickel-plated brass, electrode diameter = 1 cm, interelectrode distance = 2 cm; Thought Technology Ltd). The electrodes were placed on the dominant side 32 of the body, according to the sEMG for noninvasive assessment of muscle recommendations. 38 The skin was shaved and cleaned with alcohol prior to electrode placement to minimize impedance (<5 kΩ). The location of the sensors was marked with indelible ink to ensure consistent sensor positioning across the interday EMG recordings. The EMG electrodes and cables were secured with elastic bands to prevent motion artifacts. The technique for sEMG detection entailed full-wave true root mean square (RMS) conversion of the signal from the preamplifier with a sampling frequency of 100 Hz (sampling of the converted signal). The size of the averaging window was equal to 100 milliseconds (averaging is analogue) with a resolution of 16 bit A/D converter. The EMG preamplifier characteristics were as follows: voltage supply ±5 VDC; input impedance 2 GΩ; common mode rejection rate 100 dB; gain at 100 Hz 500; 3 dB low-cut frequency, 8 Hz; and 3 dB high-cut frequency 1.2 kHz (Muscle-Lab; Ergotest Innovation).
Hormonal and Neuromuscular Ratios
A testosterone–cortisol (T-C) ratio was used as a marker of the anabolic–catabolic balance induced by the intensity and duration of the WBV stimulus. 39 The EMG-MIVC and EMG-power ratios were used to indicate the neuromuscular efficiency during maximal and submaximal loads. 5
Whole-Body Vibration and ISOM Interventions
The participants underwent 10 series of 1-minute (10 × 1) WBV with a 1-minute pause between series and a 4-minute pause after the first 5 series of vibrations (5 × 1). The total duration was 24 minutes. 14 The acceleration load was set individually (Figure 2) for each participant. 26 The members of the ISOM group assumed the same isometric body position with knees flexed at 90° and heels raised, 27 but the vibrating plate was turned off (Ergotest Innovation). Electromyography activity (VL, BF, LG and TA muscles) was also detected in both groups during repetitions.
Statistical Analysis
Nonparametric procedures for statistical analysis were used because Shapiro-Wilks’s W test revealed that the data were not normally distributed. The effect of the independent variable (WBV) on the dependent variables (biochemical and neuromuscular responses) was tested by using a Friedman test for each group during the repeated measures over time by a Wilcoxon test for within-group comparisons and by a Kruskal-Wallis test for between-group comparisons to locate differences. A Bonferroni correction was used to adjust the P value in relation to the number of contrasts carried out. The analyses were executed using XLSTAT 13.02 statistical software (Addinsoft, SARL). Statistical significance was set at P < .05, and the meaningfulness of significant outcomes was estimated by calculating the ES of Cohen.
Results
Baseline Measurements
The differences between the 2 groups at baseline were not statistically significant in any of the measured variables (P > .05; Table 1).
Hormonal Responses
Cortisol increased significantly over time in both the WBV (P = .001) and ISOM groups (P = .010). The differences were located between T3 and T0 (P = .003, ES = 1.36) and between T3 and T1 (P = .006, ES = 1.04) in the ISOM group. Similarly, in the WBV group, significant differences were found between T3 and T0 (P = .004, ES = 1.22) and between T3 and T1 (P = .0001, ES = 1.35; Figure 3A). The testosterone response over time increased significantly in the WBV group (P = .035) but was insignificant in the ISOM group (P = .459; Figure 3B).

(A-D). The fold change (mean, standard error [SE]) in the hormone serum concentrations measured at Time 0 (T0; 5 minutes before the exercise intervention), T1 (immediately after the end of the exercise intervention), T2 (1 hour after the end of the intervention), and T3 (2 hours after the end of the exercise intervention). The shaded area represents the duration of the exercise intervention (24 minutes). Cortisol (A): P < .05: significant main effect over time in the isometric group; P < .01: significant main effect over time in the WBV group; a: significant difference between T3 and T0 (P = .003); b: significant difference between T3 and T1 (P = .006); c: significant difference between T3 and T0 (P = .004); d: significant difference between T3 and T0 (P = .0001). Testosterone (B): P < .05: significant main effect over time in the vibration group; NS: no significant effect over time in the isometric group (P > .05). T-C ratio (C): NS: no significant main effect over time in the ISOM group (P > .05); P < .01 significant main effect over time in the vibration group; e: significant difference between T3 and T0 (P = .007). Growth hormone (GH) (D): P < .05: significant main effect over time in the ISOM group; P < .01 significant main effect over time in the WBV group; f: significant difference between T1 and T0 (P = .004); g: significant difference between T3 and T1 (P = .007); h: significant difference between T3 and T1 (P = .002).
A significant T-C ratio increase over time was detected in the WBV group (P = .020), with a significant difference between T3 and T0 (P = .007, ES = 1.14). In the ISOM group, the T-C ratio increase did not reach significance (P = .093) (Figure 3C).
The GH response over time was significant in both the WBV (P = 0.007) and the ISOM groups (P = .015). The WBV group showed significant differences between T1 and T0 (P = .004, ES = 1.00) and between T3 and T1 (P = .007, ES = 1.23), whereas in the ISOM group, the difference was only significant between T3 and T1 (P = .002, ES = 1.42; Figure 3C).
Interleukin-6 and Creatine Kinase Responses
Interleukin-6 (IL-6) increased significantly over time in the WBV group (P = .029), and the differences were found between T2 and T0 (P = .011, ES = 1.07). There was no change in IL-6 concentration in the ISOM group (P = .206; Figure 4A). Similarly, creatine kinase increased significantly in the WBV group (P = .023) but not in the ISOM group (P = .918; Figure 4B).
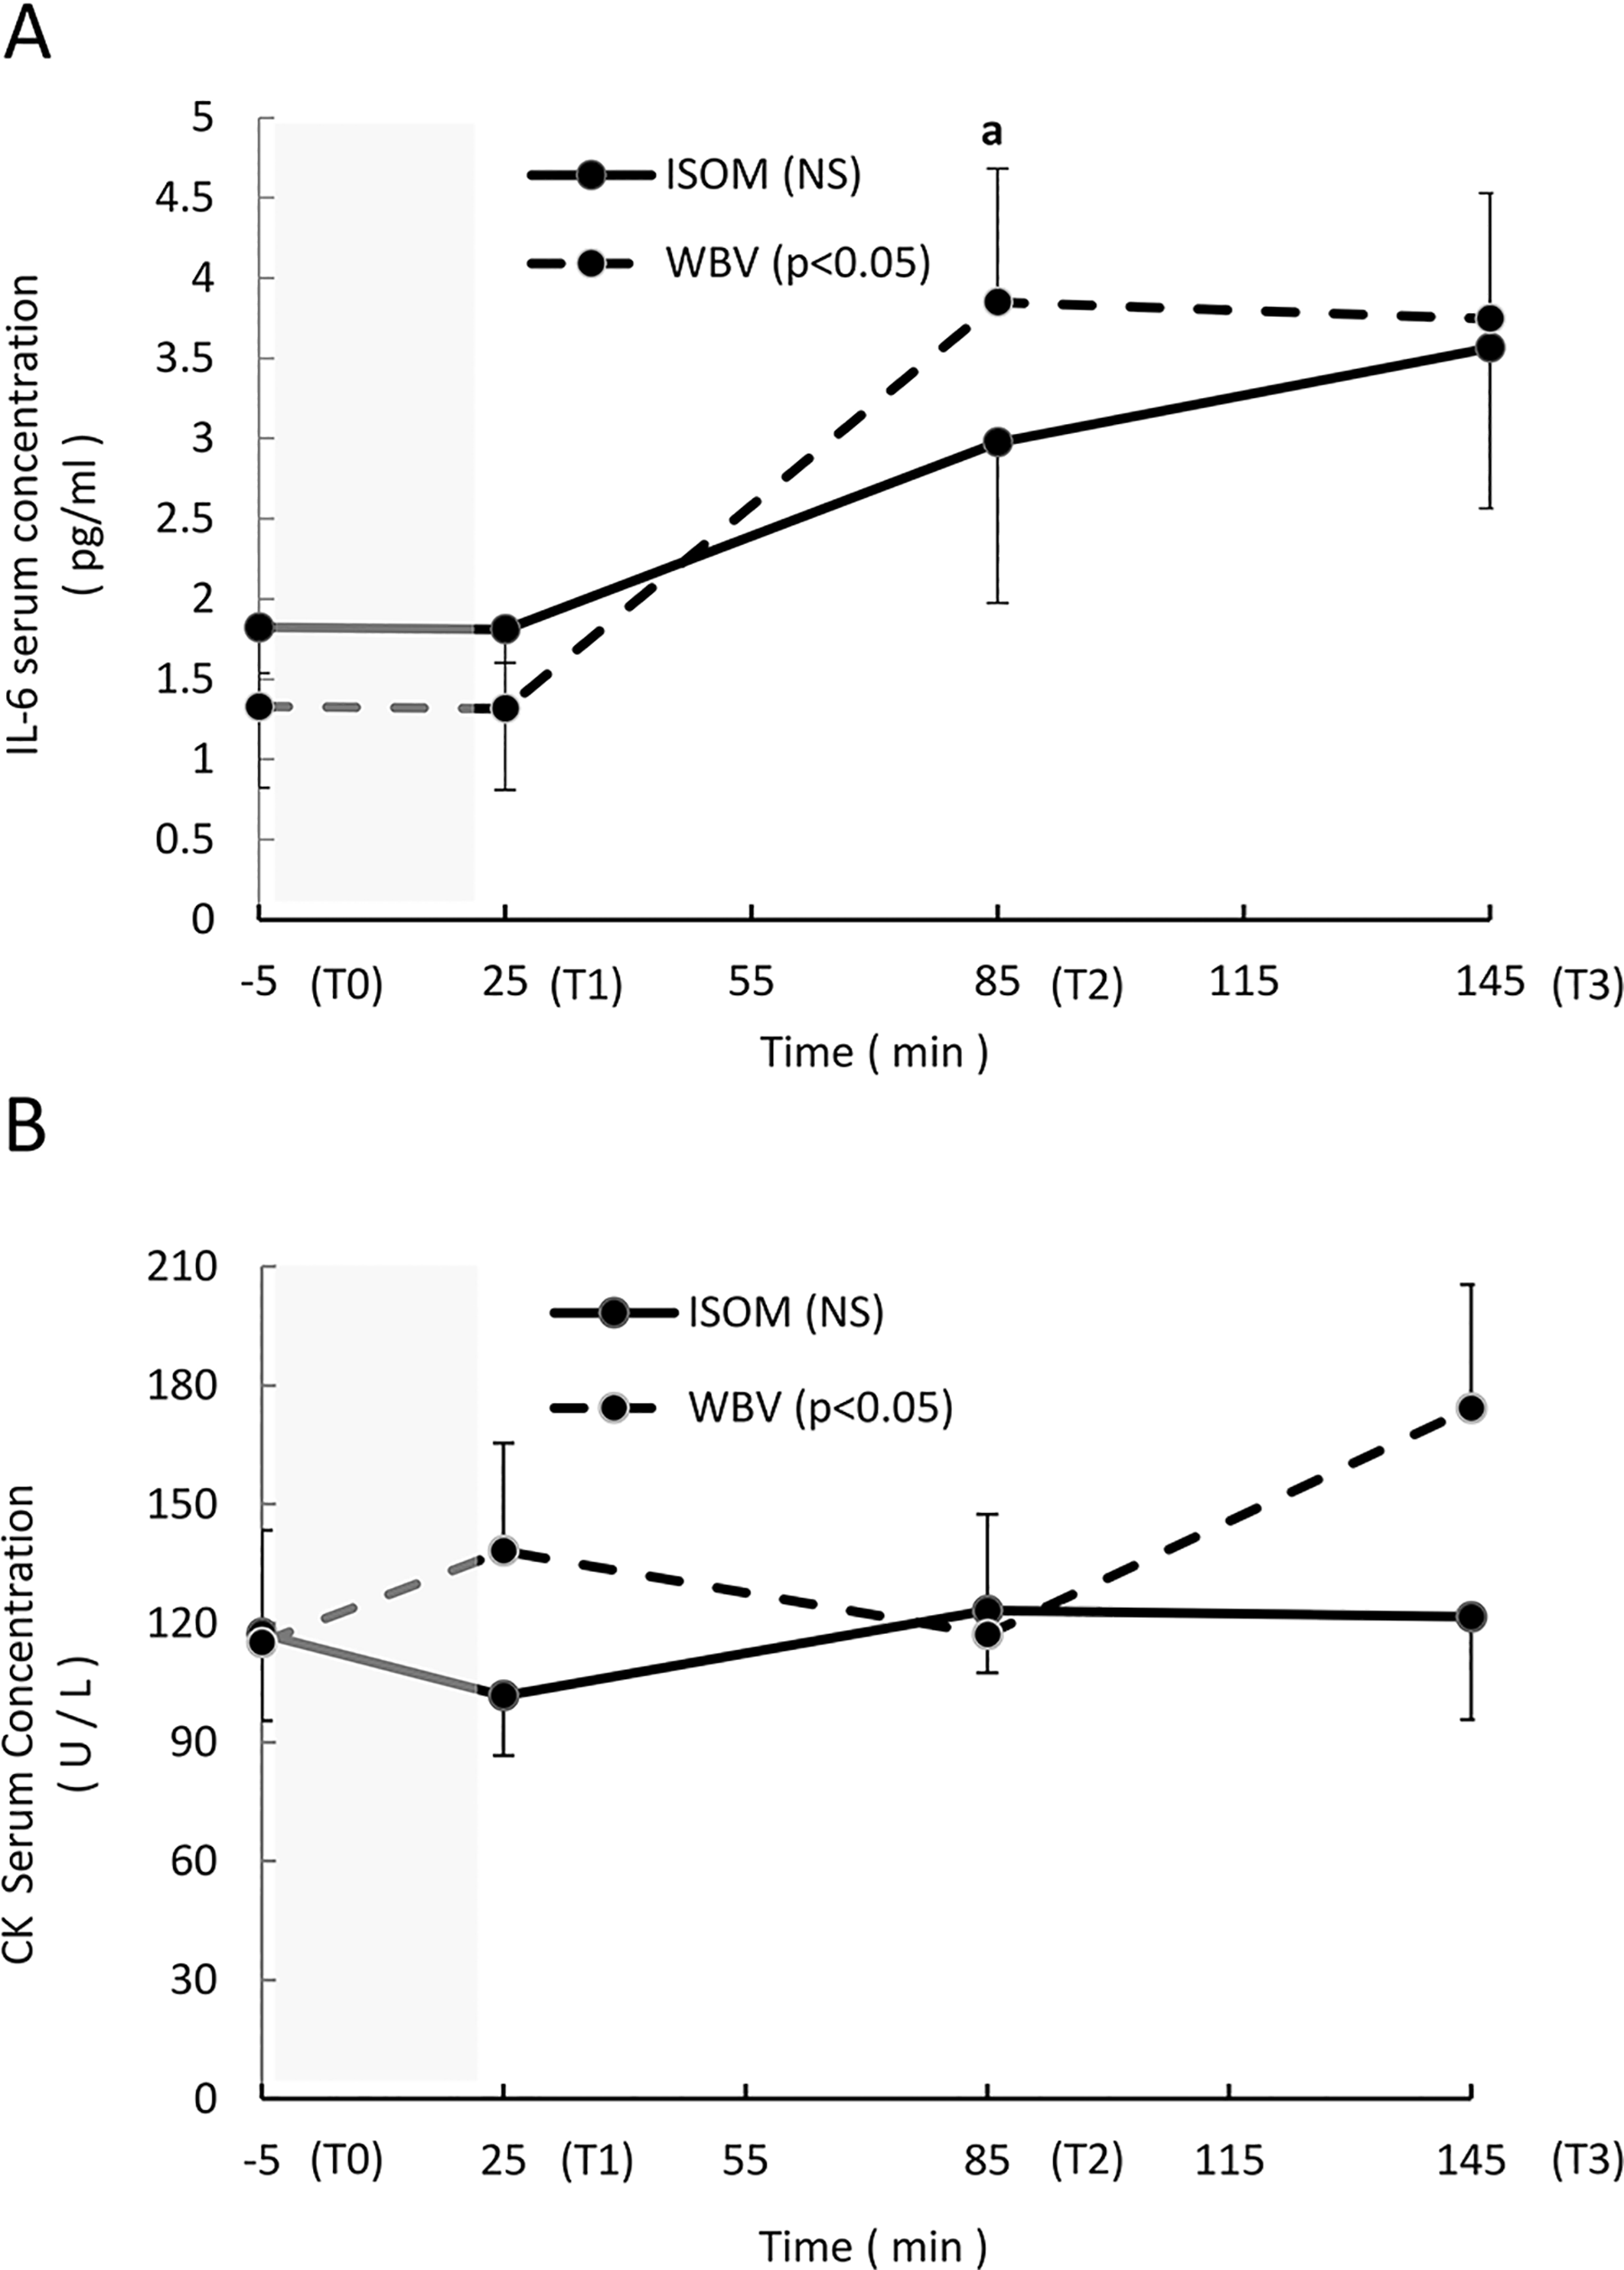
(A-B) Average absolute values (mean, standard error [SE]) of the interleukin-6 (IL-6) and creatine kinase (CK) serum concentrations measured at Time 0 (T0) (5 minutes before the exercise intervention), T1 (immediately after the end of the exercise intervention), T2 (1 hour after the end of the intervention), and T3 (2 hours after the end of the exercise intervention). The shaded area represents the exercise intervention (24 minutes). IL-6 (A): NS: no significant main effect over time in the ISOM group; P < .05: significant main effect over time in the WBV group; a: significant difference between T2 and T0 (P = .011). CK (B): NS: no significant main effect over time in the ISOM group; P < .05: significant main effect in the WBV group.
Maximal Isometric Voluntary Contractions (MIVCs), Synchronized SEMGRMS Activity, and the SEMGRMS-MIVC Ratio
The maximal isometric voluntary contractions decreased significantly over time in the ISOM group (P = .019), with a significant difference found between T1 and T0 (P = .005, ES = 0.42). The WBV group showed a borderline change (P = .05; Figure 5A).

(A-C) The relative change (mean, SE) in the maximal isometric voluntary contraction (MIVC), sEMGRMS activity, and EMG–MIVC ratio recorded during leg extension at Time 0 (T0) (5 minutes before the exercise intervention), T1 (immediately after the end of the exercise intervention), and T2 (1 hour after the end of exercise intervention). The sEMGRMS used to calculate the EMG–MIVC ratio is the average value calculated between VL and BF, as these muscles showed a similar pattern. The shaded area represents the exercise intervention (24 minutes). MIVC (A): P < .05: significant main effect over time in the ISOM group; P = .05: significant main effect over time in the WBV group; a: significant difference between T1 and T0 (P < .01). sEMGRMS (B): NS: no significant main effect over time in either group. sEMGRMS–MIVC ratio (C)-NS: no significant main effect over time in either group. The sEMGRMS reported in the figure is the average value calculated for VL and BF, as they showed a similar trend.
The synchronized sEMGRMS activity and the sEMGRMS-MIVC ratio did not show significant changes in the WBV group (P = .895 and P = .368, respectively) or the ISOM group (P = .264 and P = .717, respectively; Figure 5B and C).
Power, Synchronized SEMGRMS Activity, and the SEMGRMS–Power Ratio
Power did not change significantly in either the WBV (P = .402) or ISOM group (P = .153; Figure 6A).
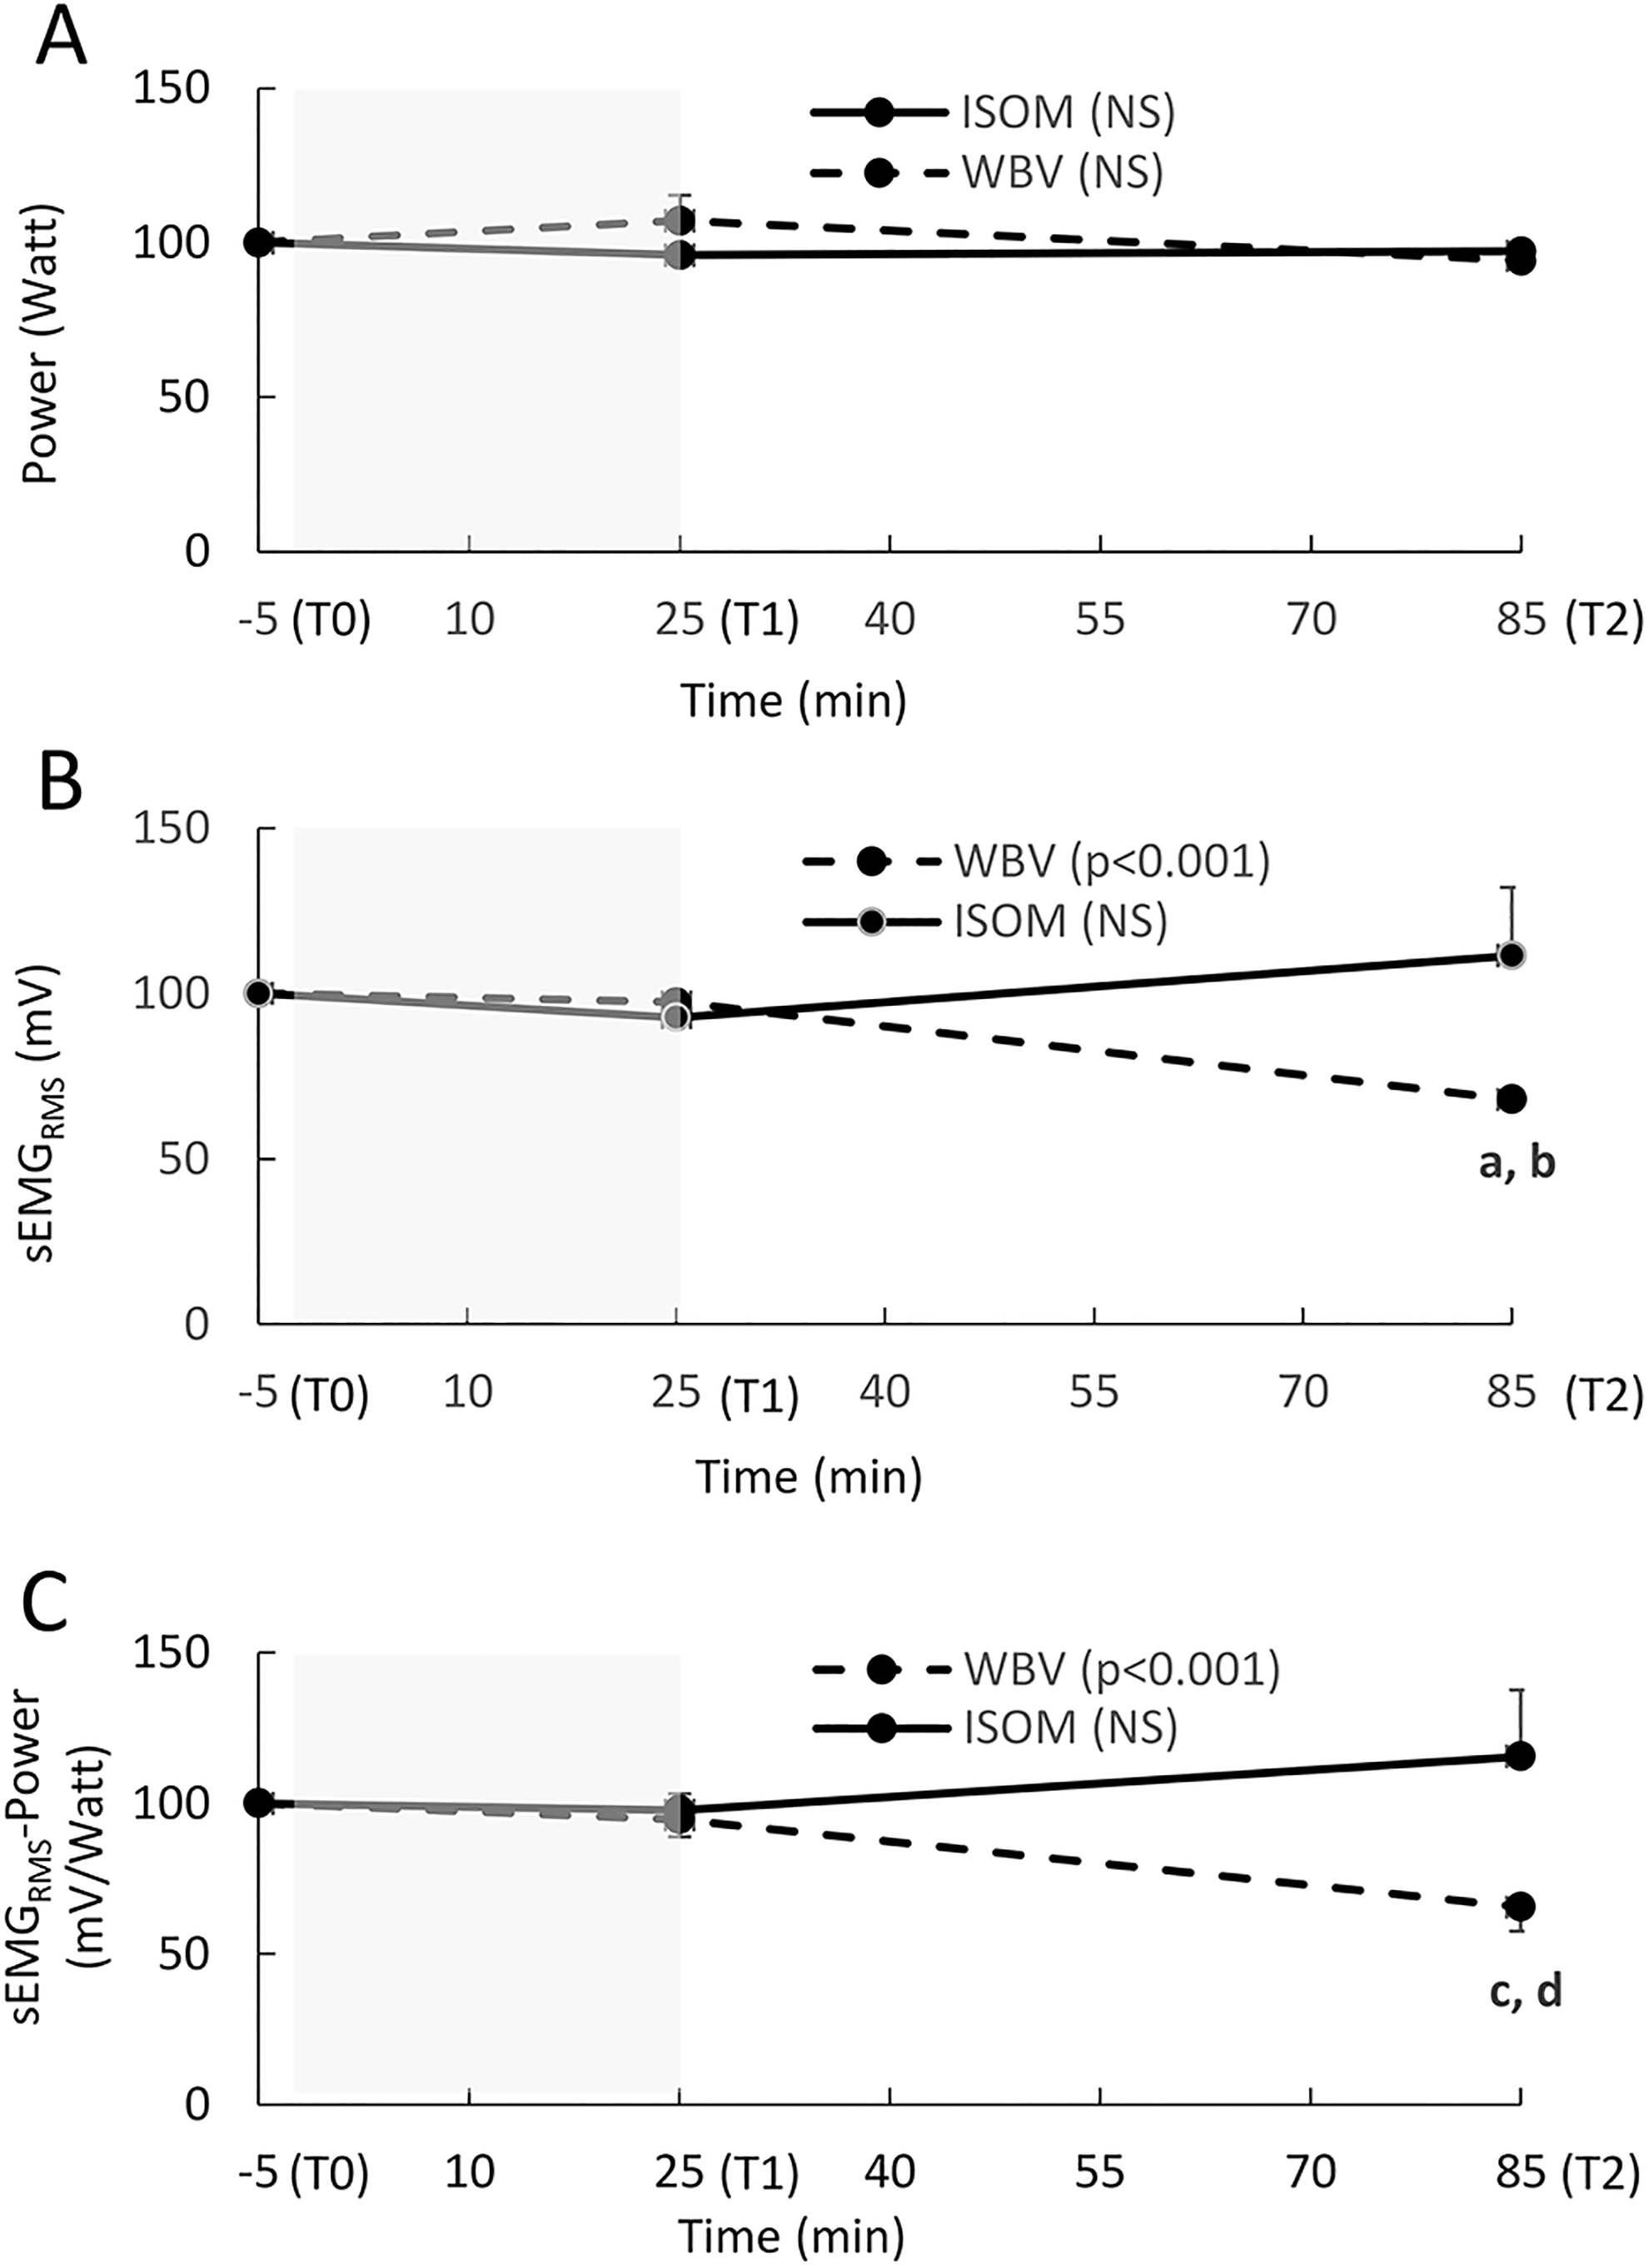
(A-C) The relative change (mean, SE) in power, sEMGRMS activity, and the sEMGRMS–power ratio recorded during a squat jump at Time 0 (T0; 5 minutes before the exercise intervention), T1 (immediately after the end of the exercise intervention), and T2 (1 hour after the end of the exercise intervention). The sEMGRMS used to calculate the sEMGRMS–power ratio is the average value recorded for VL and BF, as these muscles showed a similar pattern. The shaded area represents the exercise intervention (24 minutes). Power (A): NS: no significant main effect over time in either group (P > .05). sEMGRMS (B): P < .001: significant main effect over time in the WBV group; a: significant difference between T2 and T0 (P < .001); b: significant difference between T2 and T1 (P < .002); NS: no significant main effect over time in the ISOM group (P > .05). sEMGRMS power ratio (C): P < .001: significant main effect over time in the WBV group; c: significant difference between T2 and T0 (P = .002); d: significant difference between T2 and T1 (P = .001); NS: no significant main effect over time in the WBV group (P > .05).
Synchronized sEMGRMS activity decreased significantly in the WBV group (P = .001), and the differences were found between T2 and T0 (P = .001, ES = 1.19) and between T2 and T1 (P = .002, ES = 1.21). In the ISOM group, the increase over time was not significant (P = .399; Figure 6B). The sEMGRMS–Power ratio also decreased significantly over time in the WBV group (P = .001), and significant contrasts were found between T2 and T0 (P = .002, ES = 0.72) and between T2 and T1 (P = .001, ES = 0.57). The sEMGRMS–Power ratio did not increase over time in the ISOM group (P = .153) (Figure 6C).
Discussion
In agreement with our hypothesis and consistent with previous work, 6 individualized WBV applied during an isometric half-squat position induced a significant acute residual increase in hormonal serum concentration (GH, testosterone and cortisol). These large hormonal changes (ES ranged from 1.0 to 1.36) were associated with elevated IL-6 and CK concentrations (ES = 1.07) and a trend toward a reduced maximal force-generating capacity (P = .05).
The hormonal response, pre–post intervention, to individualized WBV was similar to that obtained with resistance training or hypertrophy schemes; 30 specifically, GH increased approximately 53-fold, cortisol 42% and testosterone 18%.
During exercise, endocrine secretion could be triggered by a “central command” that operates as a feed-forward control of hormonal and metabolic changes. 40 In other words, the action potentials that are generated in the central areas of the brain in response to an exercise stimulus activate both the motor cortex to cause muscle contraction and the hypothalamic neurosecretory centers in a parallel way. This “central command” mechanism would imply that the recruitment of a greater number of motor units, achieved by increasing the stimulus intensity, is related to a greater hormonal response. Consequently, hormone–tissue interaction is increased within a larger percentage of the total muscle mass. 41 However, hormonal responses can be further supported by afferent signals from proprio- and metaboreceptors from exercising muscles. 40
In the present study, neuromuscular activation was maximized by determining the “dose–response relationship” in each participant. 26 In fact, applying individualized WBV during an isometric squat position is optimized by the integration of the 2 mechanisms: the signals generated from the central command (voluntary isometric contraction) and the afferent signals from the reflex mechanism (WBV). By analyzing the dose–response relationships of the participants (Figure 2A), we can observe that there is great interindividual variability in neuromuscular strategies among leg muscles and that different acceleration values are necessary to stimulate the leg muscles maximally (relative to the stimulus) when applying WBV. From the latter relationships (Figure 2A), the optimum value cannot be discriminated, as the EMG activity increases with an acceleration load of 1.10 g and then remains elevated until 8.40 g. On the other hand, the individual relationships show different neuromuscular strategies and optimal acceleration loads; participant B (Figure 2B) maximized muscle activation in the tibialis anterior and lateral gastrocnemius at 1.90 g; the activation of the tibialis anterior peaked at 1.10 g in participant C (Figure 2C) and finally at 8.40 g in participant D (Figure 2D), who showed larger muscle activation than other participants in all leg muscles. This led us to use individualized acceleration loads to maximize muscle activation. Therefore, this feature of our protocol could partially explain the large effect of the present investigation in comparison to other studies that used acceleration loads that were either fixed or that increased progressively in the same manner for all participants (healthy individuals) 5,42 -45 without taking into account the magnitude relative to subject response.
However, other factors should be considered when analyzing the hormonal responses to WBV among different studies 12,19-21, 23 (ie, age, sex, health and training status, training volume, rest interval length, muscle mass involvement, muscle actions, time of day, genetics, nutritional intake, hydration, etc).
For example, the half squat position with heels raised, adopted in the present investigation, requires greater isometric tension than the high squat position 27 because the increase in resistant torque (moment arm × gravitational force) needs to be counterbalanced by the contraction of the quadriceps and triceps muscles (anti-gravitational muscles) of the participants to avoid loss of balance. The level of isometric tension determined in the latter conditions (the cumulative EMG activity recorded in the leg muscles, normalized to the maximal isometric voluntary contraction, was approximately 40%-45% on average) would have increased muscle spindle sensitivity, 46 which mediates the tonic vibration reflex response when an isolated muscle is vibrated 44 or when leg muscles are exposed to WBV. 29,47 Additionally, it was not surprising to observe an elevation in cortisol, GH and the testosterone-cortisol ratio pre-post intervention in the ISOM group (although not significant), since the cumulative EMG activity of the leg muscles, normalized to the maximal isometric voluntary contraction, was approximately 40%-45% on average and since the time under tension was not brief (each repetition lasted 60 seconds, and the total duration of the 10 isometric repetitions was 600 seconds). 48
Concerning the IL-6 and CK concentrations, both increased significantly in the WBV group, with relative changes of 270% after 1 hour and 128% after 2 hours; in the ISOM group, IL-6 increased but not significantly, while CK remained stable. Hazell et al 10 have not reported significant WBV effects on Il-6 serum concentration in a comparable experimental group (healthy male sport science students) but applied an a priori preselected magnitude for all the participants (f = 45 Hz, A = 2 mm, g = 8.14 g).
The biological action of IL-6 released from contracting muscle during exercise is hormone-like in fashion, inducing several metabolic effects (ie, lipolysis, fat oxidation, and glucose homeostasis), and the plasma concentration is related to exercise intensity, duration, and the number of muscle fibers recruited. 49 Furthermore, the IL-6 plasma concentration is more related to eccentric contractions than to concentric contractions, and it is also correlated with CK, which is a marker of skeletal muscle damage. 50 Specifically, IL-6 has a pleiotropic effect in regulating human satellite cell proliferation during the process of skeletal muscle growth following overload or injury. 51
The WBV effects that we found on serum IL-6 and CK concentrations are in agreement with those induced by applying high-intensity eccentric exercise associated with prolonged muscle damage. 50,52,53 The similarity of the effects induced by the 2 interventions could be explained by the active lengthening of muscle under an external load during WBV and during eccentric exercise. As stated previously, during WBV, the sinusoidal oscillations are transmitted via the feet to the lower leg, determining the alternation of phases with high and low ground reaction forces that are damped by means of a stretch-shorten cycle of the muscle–tendon complex in phase with the vibratory waves. 1,54 The forces involved during these fast and short changes in the length of the muscle–tendon complex are supposed to be much lower than those generated by eccentric or plyometric exercises, 55 but the high duration of the stimulus can compensate for the magnitude. In the present experiment, the total length of the WBV intervention was 10 minutes, which, multiplied by 30 or 45 Hz, results in 18 000 or 27 000 cycles. An equivalent length of stimulus using plyometric exercises can be reached by performing 400 drop jumps a week for 11 to 17 months, considering that the time spent performing a single drop jump is approximately 0.20 seconds. 5
The 2 interventions (ISOM and WBV) resulted in a very similar slight decrease in maximal force-generating capacity (MIVC; approximately 6%-7%) without significant changes in EMG activity, although the slight trend of the interventions was opposite at the end: an increase in the WBV group and a decrease in the ISOM group. This slight decrease can be accounted for by the fact that the force-generating capacity was measured during leg extension; only the quadriceps muscle is involved in this exercise, while the half squat position assumed during the interventions stimulates all the leg muscles. However, only the WBV intervention was associated with an elevation in CK and IL-6; this scheme depicts indirect evidence for muscle damage and inflammation induced by the stretch-shorten cycle of the vibratory waves.
Although the decrease in force-generating capacity can occur during isometric or concentric muscle contraction (neuromuscular fatigue), muscle damage is caused by an eccentric contraction when the external force applied is higher than the muscle force and the work is done on the muscle, resulting in a lengthening action 56 that, in turn, determines a series of events: overstretched sarcomeres, disrupted sarcomeres, membrane damage, and a delayed fall in tension. 57 Consequently, the decrease in contribution to force production from some damaged motor units is compensated for by means of increased recruitment and rate coding, as evidenced by the EMG amplitude increase, to achieve the required level of torque. 58 The decrease in maximal force-generating capacity after exercise-induced muscle damage persists for several days, while after either isometric or concentric exercises, it recovers almost completely within 10 to 60 minute. 58 Since WBV involves a stretch-shortening cycle (SSC), 1,54,55 it is not surprising that the eccentric component of the SSC muscle action causes muscle damage.
In contrast to the force-generating capacity decrease, maximal power output during the SJ remained unchanged after both interventions. In this type of movement, a smaller number of larger motor units are involved, as the power output is generated by the recruitment of type II fibers. 59,60 Experiments conducted to assess the power and maximal isometric force after eccentric exercise-induced muscle damage and fatigue have shown that muscle power and the shortening velocity are reduced to a greater extent than force 61,62 and that selective type II muscle fibers are preferentially damaged, 61 inducing an impairment in the process of excitation–contraction coupling. 63 Additionally, neural activation strategies (motor unit recruitment thresholds, discharge rates, and motor unit conduction velocities) are altered and determine an increase in surface EMG amplitude due to an increase in additional motor unit recruitment to compensate for the decline in some motor units that are fatigued and unable to generate force. 64
Conversely, a decrease in the EMG–power ratio after the WBV intervention was observed in our study; this result highlights an improved neuromechanical efficiency at submaximal loads that largely reflects the activity of high-threshold motor units 65 and results from a combination of 2 mechanisms. First, fatigue-induced reflex inhibition of the motoneuron pool excitability after WBV 66 could contribute to a reduction in the neural drive of agonist-antagonist thigh muscles (ie, the “numerator” of the EMG-power ratio); this peripheral inhibition could also explain the fatigue due to central components (central–peripheral interactions) as evidenced by the significant reduction in MIVC in the present study. In fact, when the discharge frequency of motoneurons declines toward low values, following the altered afferents induced by stretch-shorten cycles of WBV, 66 a higher central activation rate, through supraspinal projections of afferents, is delivered to motor units to exert the same relative level of strength; in this way, the central motor commands force the recruitment of new motor units, and central fatigue must appear in the task when the muscles work closest to their maximal levels. 67 In this regard, the MIVCs decreased significantly in both groups, but only in the WBV intervention did EMG activity and the EMG-MIVC ratio show an increasing trend (although not significant).
Second to the abovementioned neural mechanisms, the protective, nongenomic action of testosterone in fast twitch fibers could counteract the loss of power due to muscle fatigue (ie, the “denominator” in the EMG–power ratio) by increasing the intracellular calcium levels and mobilization from the sarcoplasmic reticulum to maintain the cross-bridge kinetics and the rate of shortening. 5,68 -71
Limitations
In the present investigation, only males were involved because sex is a confounder related to differences in hormonal responses during exercise and the menstrual cycle (ie, testosterone, cortisol, estrogen, and progesterone). Therefore, the generalizability of the results is limited to healthy male patients.
The kinetics during recovery were analyzed up to 1 hour for neuromuscular variables and up to 2 hours for biochemical variables after the end of the interventions. Therefore, this limitation does not allow us to compare our results with those obtained by applying eccentric exercise or to describe the typical pattern of muscle damage in terms of CK serum concentration (after 24-48 hours) and soreness.
Conclusions
Individualized WBV acutely maximizes serum hormonal concentrations similar to resistance training and hypertrophy exercises. The responses induced by individualized WBV appear to be a novel adaptive signal within the neuromuscular system in which an acute elevation in the hormonal profile and muscle damage is obtained by means of a strong proprioceptive stimulus. This form of stimulus is optimal, therefore, for people with disabilities and elderly individuals who are unable to sustain prolonged muscle contractions (ie, eccentric–concentric contractions) of moderate-elevated intensity.
Footnotes
Declaration of Conflicting Interests
The author(s) declare no potential conflicts of interest with respect to the research, authorship, and/or publication of this article.
Funding
The author(s) received no financial support for the research, authorship, and/or publication of this article.