
Abstract
Purpose:
To develop a patients-based statistical model of dose distribution among patients with nasopharyngeal cancer (NPC).
Methods and Materials:
The dose distributions of 75 patients with NPC were acquired and preprocessed to generate a dose-template library. Subsequently, the dominant modes of dose distribution were extracted using principal component analysis (PCA). Leave-one-out cross-validation (LOOCV) was performed for evaluation. Residual reconstruction errors between the doses reconstructed using different dominating eigenvectors and the planned dose distribution were calculated to investigate the convergence characteristics. Three-dimensional Gamma analysis was performed to investigate the accuracy of dose reconstruction.
Results:
The first 29 components contained 90% of the variance in dose distribution, and 45 components accounted for more than 95% of the variance on average. The residual error of the LOOCV model for the cumulative sum of components over all patients decreased from 8.16 to 4.79 Gy when 1 to 74 components were included in the LOOCV model. The 3-dimensional Gamma analysis results implied that the PCA model was capable of dose distribution reconstruction, and the accuracy was especially satisfactory in the high-dose area.
Conclusions:
A PCA-based model of dose distribution variations in patients with NPC was developed, and its accuracy was determined. This model could serve as a predictor of 3-dimensional dose distribution.
Introduction
Nasopharyngeal cancer (NPC) is highly prevalent among populations in China and the primary treatment strategy is radiotherapy. 1 Intensity-modulated radiotherapy (IMRT) and volumetric-modulated arc therapy (VMAT) are the standards of care for the treatment of NPC, which are able to minimize the dose to organs at risk (OARs) in close proximity to the planning target volume (PTV). However, treatment plan quality for NPC is very challenge due to the OARs’ complicated spatial distribution and highly depending on the each individual’s planning skills and experiences. 2 Although inverse-planned IMRT has been used for several decades, an efficient or quantitative approach is not available to ensure that the optimal IMRT plans are consistently achieved in the clinic. 3,4
Generally, the prescription of optimization goals is based on population-based data, Radiation Therapy Oncology Group (RTOG) guidelines or clinical knowledge provided to the planner by physicians. The clinical intent is converted to a dose–volume histogram (DVH) as constrained objectives and imported into an inverse-planning system. 2 The accuracy of DVH objective configuration and the relative priority are inhomogeneous among planners, which results in planned dose distribution variations. Furthermore, due to unique patient-specific anatomical features, the planning process involves iterative steps based on a number of subjective decisions and results in planned variations in dose distribution among patients.
Investigators have used prior knowledge of achievable DVHs to automatically estimate target DVH objectives for the inverse-planning optimization step to improve the consistency of the plan quality. 5 -7 Although these efforts have improved the plan quality and consistency, this approach constrains the planners’ ability to manipulate the voxel-by-voxel dose distribution based on DVH objective optimization. Three-dimensional dose distribution is necessary as a reference to perform voxel-by-voxel dose optimization to achieve an optimal plan. To generate 3-dimensional dose distribution, we performed a principal component analysis (PCA) to create a statistical model of dose distribution variations in NPC and investigate the information represented by dose distribution.
Methods and Materials
Data Acquisition and Preprocessing
A total of 75 patients having NPC with readily available data who were treated between June 2017 and February 2018 were enrolled in this study. Each patient underwent 1 computed tomography (CT) scan with a voxel size of 0.097 × 0.097 × 0.3 cm3 and received a treatment plan. The plan data set consisted of 55 VMAT plans and 20 IMRT plans. The targets, which included the gross tumor volume (GTV), high-risk clinical tumor volume (CTV1), low-risk clinical tumor volume (CTV2) and OARs for areas that included the brainstem, spinal cord, optic nerve, optic chiasm, lens, ears, larynx, and parotids, were delineated utilizing the Varian Eclipse treatment planning system (TPS, Varian Medical Systems, Palo Alto, California) with 6 MV photon beams from a Varian Clinac equipped with a Millennium Multileaf Collimator with 120 leaves for planning CTs. The PTVs that corresponded to the above targets were expanded to 2 to 5 mm.
The institutional planning criteria for NPC treatment were applied according to RTOG0615, and the prescription dose should cover at least 95% of the PTV. The recommended dose is 2.10 to 2.25 Gy/fraction for a total dose of 66 to 76 Gy for PGTVnx and PGTVrpn, 2.00 to 2.25 Gy/fraction for a total dose of 66 to 70 Gy for PGTVnd, 1.80 to 2.05 Gy/fraction for a total dose of 60 to 62 Gy for PCTV1, and 1.7 to 1.8 Gy/fraction for a total dose of 50 to 56 Gy for PCTV2. A significant dose gradient was observed between the target and normal tissues in NPC. The dosimetric constraints recommended for the organs were according to RTOG0615 and RTOG0225. 8
All IMRT plans share the same configuration of 9 equal angle beams, whereas the whole VMAT plans perform 2 full-gantry arcs. The plan dose matrices are calculated using the anisotropic analytical algorithm for IMRT plans and the Acurou XB algorithm for VMAT plans. 9 All physical dose matrices with a voxel size of 0.25 × 0.25 × 0.3 cm3 were exported using the export function of the TPS.
Preprocessing was performed to guarantee that all dose matrices had uniform dimensions since each dose matrix is inhomogeneous in dimension. The specific operation was as follows: the centroid for GTVnx i for the ith patient was calculated, and the corresponding index in the coordinates of the dose matrix was initially determined and noted as (x0 i, y0 i, z0 i ). The region of the union of the CTV was denoted as U{CTV i } and determined by overlaying the entire CTV with the alignments of the centroids of each GTVnx i . Regarding the economical memory size usage and fast calculation requirements, U{CTV i } was truncated to a matrix with dimensions X × Y × Z, and the voxel size was transformed to match the dose matrix. Next, each dose matrix was truncated such that it was centered on the centroid of GTVnx i (x0 i, y0 i, z0 i ), which also had dimensions of X × Y × Z and was denoted as Di p , where M = X × Y × Z was the total number of voxels and X = 69, Y = 53, and Z = 41.
The dose distributions among patients were described by a series of N patients’ dose matrices. Let di (j) represents the dose of the jth voxel for the ith patient; then, the dose matrix Di p could be parameterized with the set contained M voxels and expressed as the following vector:

The set of vectors {Di } i = 1,…, N was assumed to be sampled from a random process. The dose distribution was clearly affected by the shape of the target and the relative position of the OARs, which implied that the variable in this multivariate statistical problem was actually less than M. The PCA was performed to address the N samples with M dimensions to achieve the greatest reduction in dimensionality 10 and loss of information.
The PCA was summarized based on sampled vectors, and the corresponding centered vectors that represented the differences related to their averages were constructed. Then, a covariance matrix was generated utilizing the centered vectors, and the eigenvectors of the covariance matrix were calculated. The set of eigenvectors with the largest eigenvalues was the principal components that were included in the model. Additionally, the average vector

where
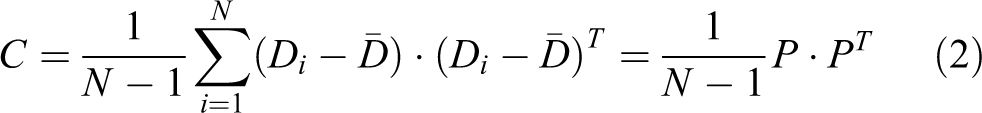
The PCA was performed by a singular value decomposition (SVD), which is a factorization of a real or complex matrix in linear algebra. This approach provides a computationally efficient method for finding the principal components. 11 The principal component transformation could be associated with the covariance matrix C via factorization, that is, the SVD of P, as follows:

where S is an M-by-N rectangular diagonal matrix, in which the diagonal entries σ k of S are known as the singular values of P; U is an M-by-M matrix, in which the columns are orthogonal unit vectors of length M that are called the left singular vectors of P; and V is an orthogonal matrix with the dimensions N × N, in which the columns are orthogonal unit vectors of length N that are called the right singular vectors of P.
In terms of this factorization, the matrix P T P can be written as follows:

where

This lower-dimensional subspace can represent the M-dimensional structure model by retaining the eigenvectors that are associated with the largest eigenvalues. Generally, this subspace is formulated by calculating the cumulative sum of the variance values that are larger than some fraction of the total sum of the variance values. The eigenvalues impose an importance ranking on the eigenvectors with respect to the representation of dose distribution variability. Specific to the dose vector, the PCA decomposes and reassembles Di into the mean vector over patients using a weighted sum of the L eigenvectors ql with the largest eigenvalues for reconstruction.

where the coefficients
Quantitative Evaluation
The ability of the PCA model to represent the dose distribution sampled using only a few dominating eigenvectors was evaluated. Moreover, leave-one-out cross-validation (LOOCV) was adopted to evaluate the accuracy of implementation. 12,13 For each dose matrix, we performed PCA with the remaining (N-1) patients’ dose matrices. The coefficients {wl }l=1,…, L were determined by applying the Di p of the left out patient to predict the resulting eigenvectors {ql }l=1,…, L. Subsequently, a dose matrix was reconstructed with the first L components using Equation 6 and denoted as Di L . The reconstructed dose matrix Di L better approximated Di p by increasing the number of components. The local residual was calculated as follows:

The average local residual for each voxel as a comprehensive measure of the quality of the PCA model with L eigenvectors was given by averaging the N different patients as follows:

The root mean square (RMS) over all voxels (M) of the standard deviation for N patients was calculated for each cumulative sum of the components as follows:

This implementation resulted in convergence characteristics that addressed the question of how many dominating eigenvectors were needed to produce a sufficient model of the individual dose distribution variability.
To investigate the accuracy of the dose reconstruction, we performed dose comparisons between the dose-reconstructed Di L and the planned dose Di p via 3-dimensional Gamma index tests with 3% and 3-mm criteria. 14,15 The corresponding Gamma index matrix was denoted as Gi L . Although the average Gamma index for each voxel was produced by averaging the N different patients as follows:

The proportion of the Gamma indices for voxels less than or equal to 1 was determined as the average Gamma pass ratio for the cumulative sum for the components used to determine the accuracy of the dose reconstruction. A series of average Gamma pass ratios was calculated and examined under combinations of varying numbers of eigenvectors L and varying dose regions (with doses ≥0 Gy to doses ≥70 Gy with step size 5 Gy in the average dose matrix over all patients).
Results
Figure 1 shows the average variances explained by each component and the cumulative sum of the components from the PCA results of the dose distribution over patients. The first component accounted for 26.1% of the variance on average. Each of the first 13 components contributed more than 1% to the variance on average and described 79.8% of the variance in total. Moreover, on average, the first 29 components contained 90% of the variance and 45 components were needed to account for more than 95% of the variance.
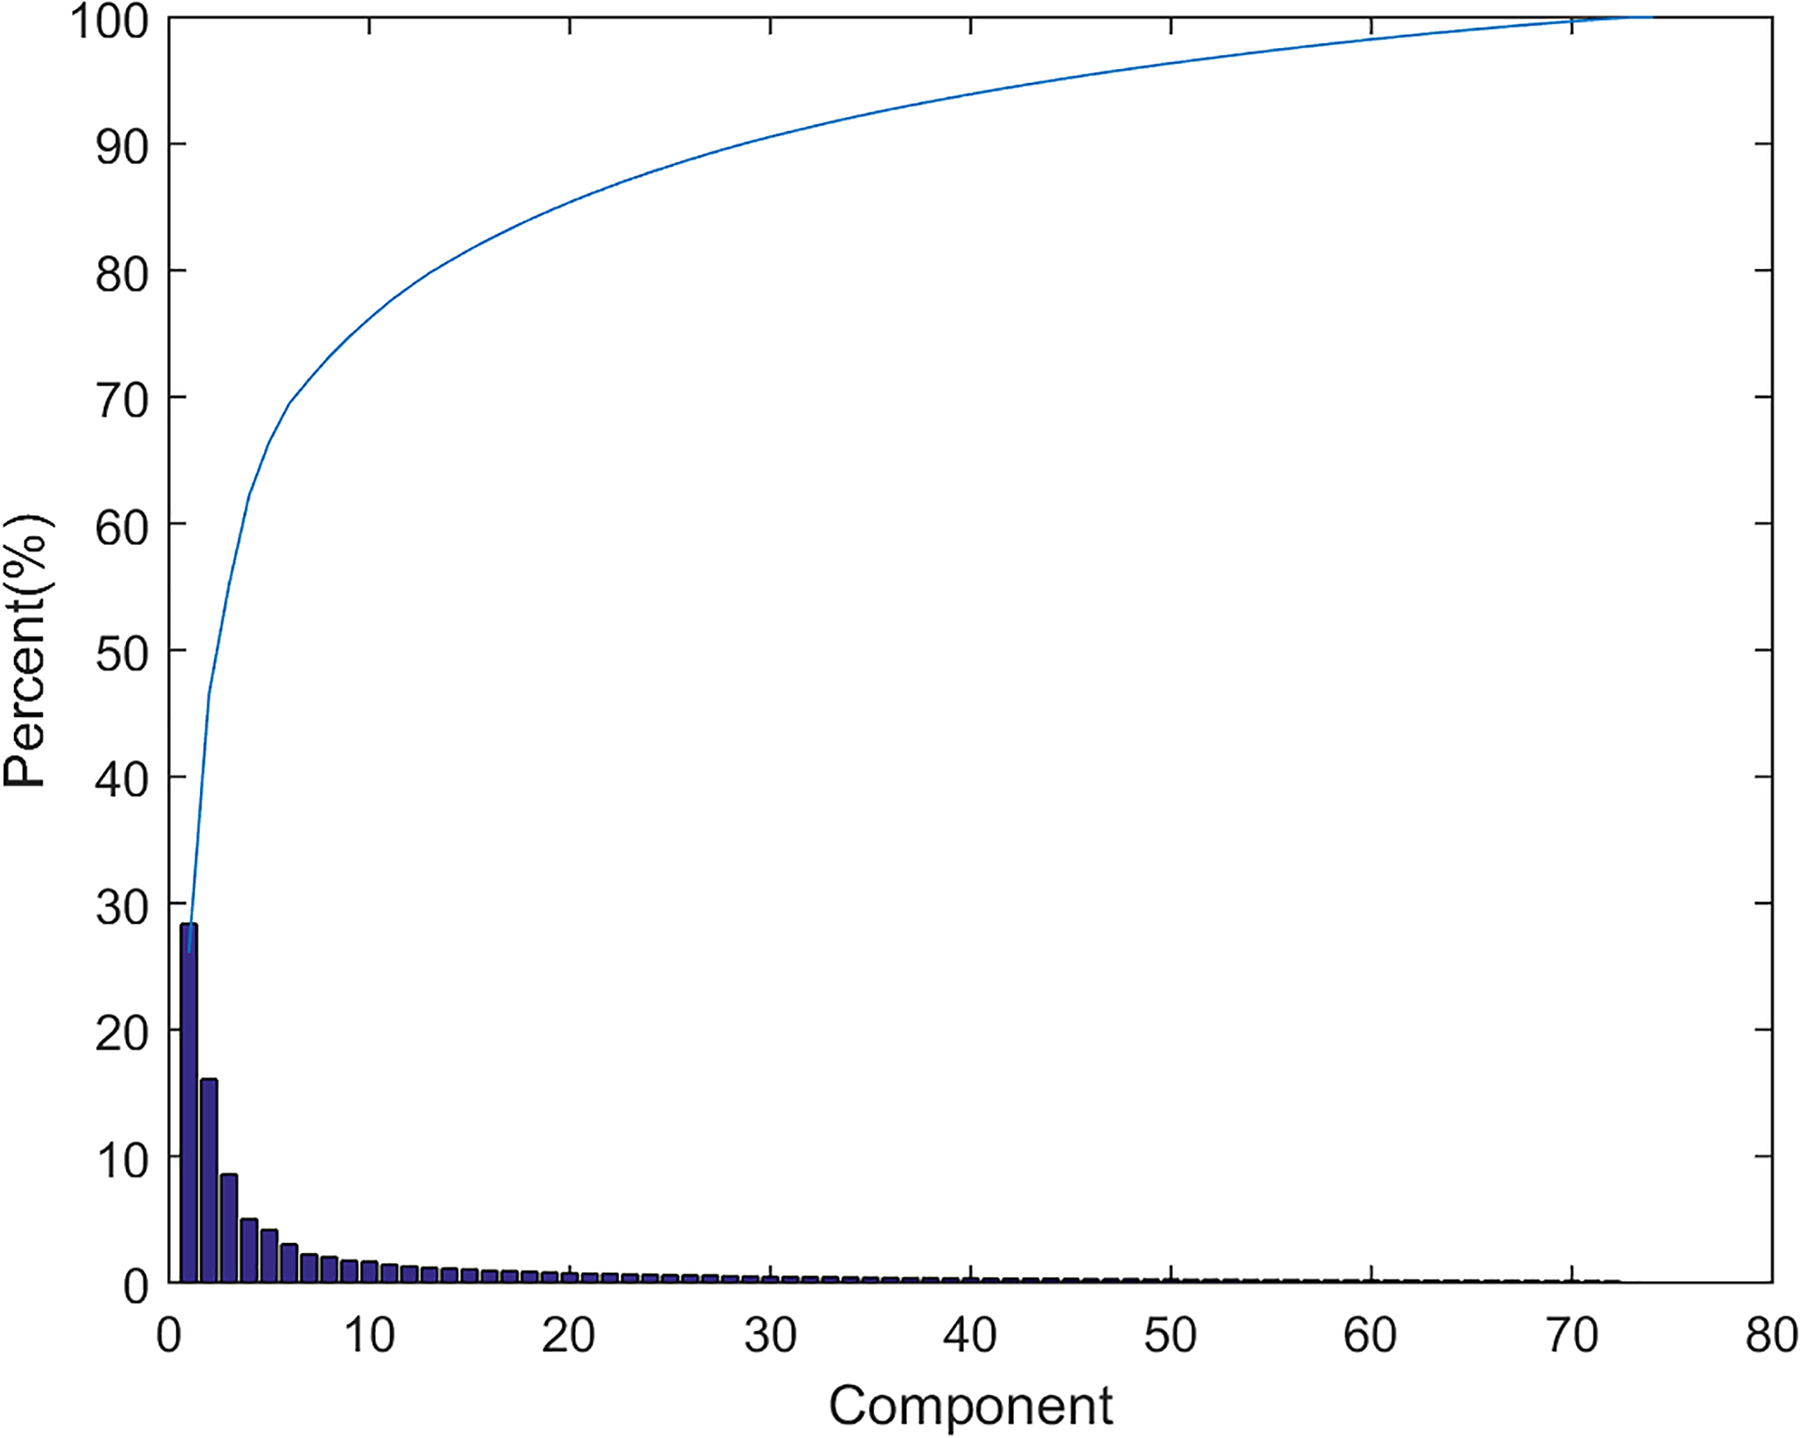
Average proportion of the variance explained by each principal component and the cumulative sum of the principal components over patients.
Figure 2 shows the residual errors of the LOOCV model for the cumulative sum of the components over all patients. The residual error decreased as the number of components increased, and the first 6 components strongly decreased the residual error. The residual error decreased from 8.16 to 4.79 Gy when 1 to 74 components were needed in the LOOCV model. The residual error appeared to vanish in the asymptotic case of an infinite number of components.

Overall patient residual error for the cumulative sum of components.
Figure 3A shows the average transverse dose over all patients. The average dose distribution becomes blurred over all patients, which results in a high dose that is concentrated in the middle area and surrounded by a low-dose area. An average Gamma map is displayed in Figure 3B, and it shows that the areas with Gamma indices lower than 1 are distributed in the middle and border areas while Gamma indices with higher values are distributed in the embedded area. Figure 3C displays the corresponding average Gamma index-density histogram and intensity map. The chart clearly shows that the areas with Gamma indices ≤1 are mainly distributed in the regions with doses ≥50 or ≤20 Gy, whereas Gamma indices >1 were distributed in the remaining areas. Notably, almost all Gamma indices in the regions with doses ≥65 Gy were less than 1.
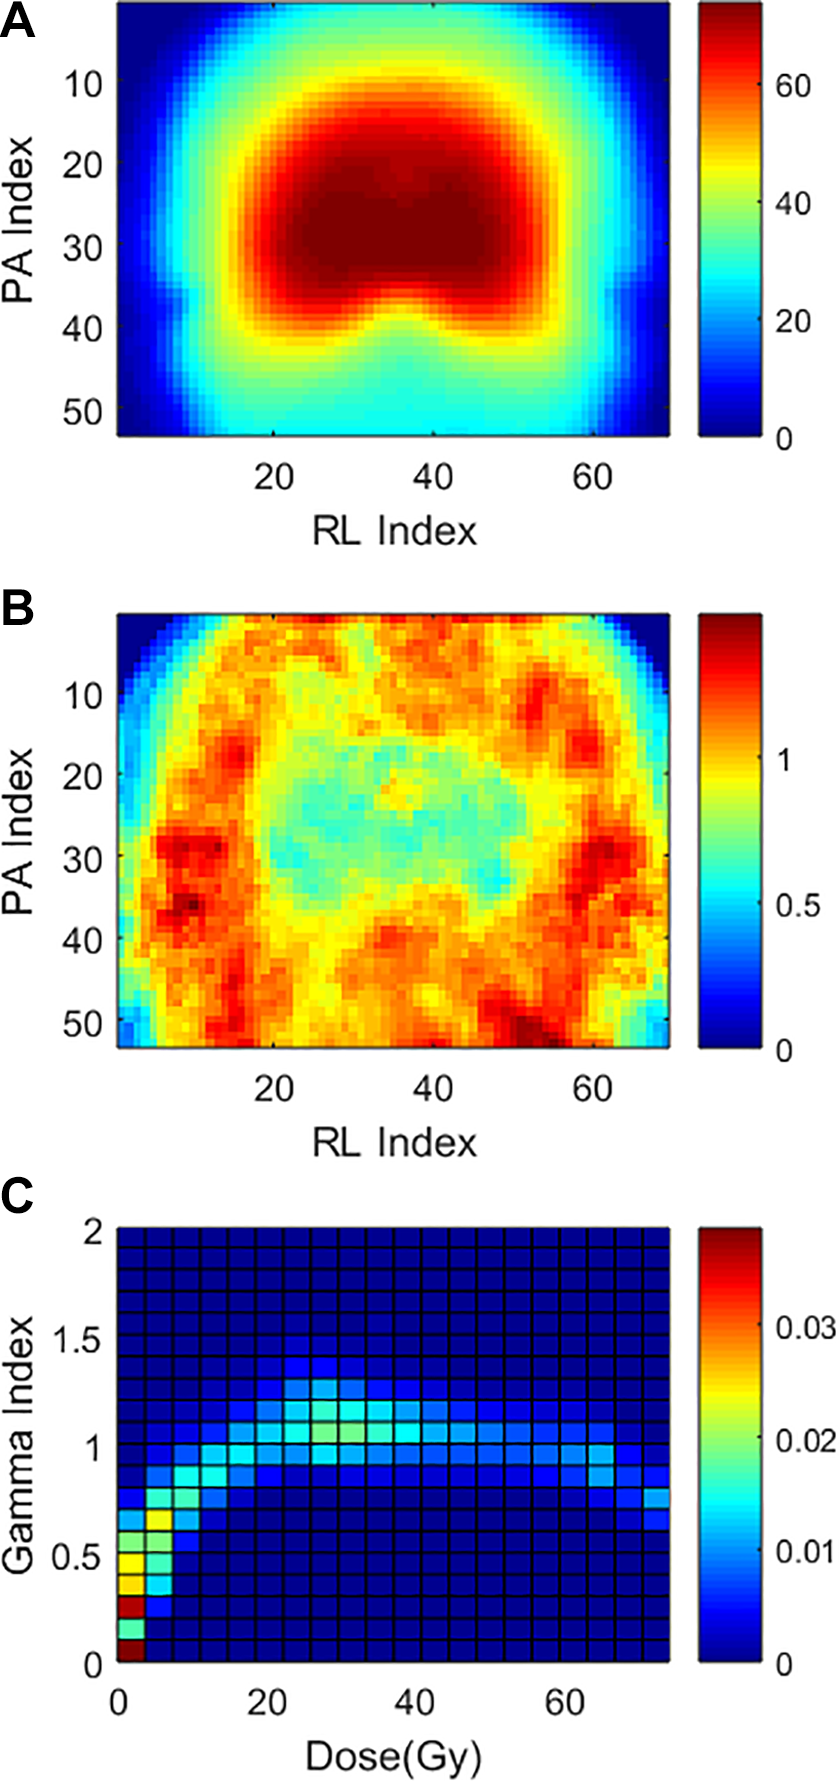
(A) Transverse of the average dose matrix over all patients and an example of the corresponding (B) Gamma map and (C) Gamma index density histogram and intensity map. Seventy components were used to reconstruct the dose distribution in the example.
Figure 4A indicates that the average Gamma pass rate varies along with the components used in the PCA models over all patients for the voxels in different dose regions. A similar trend of an increase in the average Gamma pass rate was observed with the use of increasing numbers of components in the PCA model.

Average Gamma pass rate over patients varies with (A) the components used in the PCA model and (B) the dose region. PCA indicates principal component analysis.
For the region with a dose ≥70 Gy, only the first 21 components used to describe the dose distribution resulted in an average Gamma pass rate that reached more than 90%. When 52 components were included in the PCA model, the average Gamma pass rate reached more than 98%, which is acceptable in the clinic.
Figure 4B displays that the average Gamma pass rate varies along with dose region. When the PCA model included 70 components, the average Gamma pass rate reached more than 90% for the region with a dose ≥65 Gy and more than 99% for the region with a dose ≥70 Gy.
The curves of the average Gamma pass rates for regions with doses ≥10 to ≥40 Gy are all under the curve for the region with a dose ≥0 Gy, and the curve for the region with a dose ≥50 Gy intersects with that for the region with a dose ≥0 Gy as displayed in Figure 4A. Although Figure 4B clearly indicates that the average Gamma pass rate decreases with increasing dose region, the average Gamma pass rate decreases to a valley in the region with a dose ≥20 Gy and then increases to approximate the average Gamma pass rate in the region with a dose ≥50 Gy. This phenomenon implies that lower average Gamma pass rates appear in areas with 20 Gy < dose < 50 Gy, which is consistent with the Gamma index density histogram and intensity map displayed in Figure 3C. These results indicate that the PCA model can reconstruct the dose distribution and that the accuracy is particularly satisfactory in the high-dose area.
Discussion
This study used a group of patients to create a statistical 3-dimensional dose distribution model for NPC. The residual errors of the LOOCV model for the cumulative sum of the components over all patients were calculated to evaluate the model, and the results indicated that they could reach 4.79 Gy.
These results indicated that the PCA model is capable of reconstructing dose distributions, and the accuracy was especially satisfactory in the high-dose area. For example, the average Gamma pass rate reached more than 98% when 52 components were included in the PCA model for regions in which the dose was ≥70 Gy. Such quantitative feature and evaluation tool may be available to clinic to have a better control of plan quality. An experiment was conducted. Patient#23’s CT structure set was selected to redesign a new treatment plan. During the plan optimization iteration process, an uncompleted optimized plan was intentionally saved at 30th iterations out of 80. As a result, the uncompleted optimized plan’s quality may not reach its optimum solution compared to the final clinical plan. The corresponding DVH was displayed in Figure 5 as dashed line (uncompleted optimized plan) and solid line (final clinical plan). The final clinical plan dose and uncompleted optimized plan dose were denoted as D 23 p and D 23 p’, respectively.

The DVH of patient #23 for final clinical plan (solid line) and uncompleted optimized plan (dash line). DVH, dose–volume histogram.
Then, we performed PCA with the remaining 74 patients’ dose matrices on D 23 p and D 23 p ’ .The corresponding dose matrices were reconstructed utilizing the first 73 components and denoted as D 23 73 and D 23 73’. The 3-dimensional gamma analysis with 3% and 3-mm criteria was implemented in the comparison between plan dose matrix and reconstructed dose matrix. The gamma pass ration for the high-dose area (≥70 Gy) was 99% (D 23 p vs D 23 73) and 82% (D 23 p’vs D 23 73’). The gamma pass ratio was fairly low in the uncompleted optimized plan, which suggested that the feature of dose distribution may be different from the feature the remaining patients’ clinical plans’ dose matrix in this specific disease site, which indicated that there is potential to further improve the dosimetric plan quality. Therefore, the method introduced in this study provided a strategy, a model, or a guideline to quantitatively evaluate the plan quality for this specific disease site or patient geometry.
A component describing a high percentage of the variance should obviously be included. Nonstatistical strategies are commonly used to determine the appropriate number of relevant components. The residual error over all patients in the LOOCV model decreases more or less at the same rate as that of the PCA model within the first 6 components as illustrated in Figure 2. However, these 6 components only describe 69.5% of the variance and attain a 32.4% average Gamma pass ratio for voxels with doses ≥0 Gy as well as a 25.9% average Gamma pass ratio for voxels with doses ≥70 Gy. Choosing only the components that describe more than 1% of the variance, that is, 13 components, we captured only 79.8% of the variations in dose distribution based on the dose and attain a 40.3% average Gamma pass ratio for all voxels and a 70.8% average pass ratio for the region with a dose ≥70 Gy. To capture 90% of the variance, we need at least 29 components, and the average Gamma pass ratio reaches 93.9% for the regions with doses ≥70 Gy. The average pass ratio reaches 98% for the areas with doses ≥70 Gy, and 96.8% of the variance is described when 52 components are included in the PCA model. The application determines the optimal number of components included in the PCA model.
Equation 6 demonstrates the potential applicability of the eigenvector approach for treatment planning by describing how new dose distribution samples can be generated from the eigenspace determined by dominating eigenvectors. This process might be useful for patient-specific predictions of dose distributions based on PCA of a series of training dose distributions. However, a detailed discussion and evaluation of the clinical applications are beyond the scope of this article and will be the subject of future investigations.
The training matrix dose data set was composed of a series of dose matrices that were mainly generated by VMAT, although a number were produced by IMRT. However, the maximum dose-like acnode may affect the quality of the PCA model. These maximum doses can be considered local shape outliers from a statistical viewpoint. A robust PCA (RPCA) method has been developed to handle analogous outlier problems in the field of PCA-based automatic image recognition. 16 The application of the RPCA method could help to overcome the difficulties associated with the acnode dose on an inherently statistical basis.
Volumetric-modulated arc therapy has been shown to be a powerful technique obtaining higher dose conformity to the tumor improving OARs and healthy tissue sparing. 17,18 The low-dose areas produced by VMAT and IMRT were significantly differentially distributed, which improved the degrees of freedom of the dose distribution. The situation may also affect the quality of the PCA model. Thus, dose data sets can be constructed based on dose matrices generated via IMRT and VMAT in the future.
The limitations in the statistical model could not be ignored. The dose distribution was reconstructed in the study including the high-dose region and low-dose region. The high-dose area including GTV reconstructed was more accurate, while the low-dose area was not accurate enough, which was a limitation in the model effect region. It should be noted that though the statistical model in this article is only for NPC with similar diagnosis or geometry. Such idea can be applied to other disease sites as well. However, a new statistical model needs to be rebuilt based on this specific geometry and diagnosis. It is time consuming to build each individual statistical model.
Conclusions
Performing a PCA of a dose distribution was an efficient method for extracting the essential information of patient-specific dose distribution variations in a quantitative manner from dose data sets that consist of multiplied dose matrices, and the accuracy of this approach was determined. Notably, clinically satisfactory accuracy was observed in the high-dose area. We believe that the inclusion of dose distribution variation is valuable in the prediction of 3-dimensional dose distributions.
Footnotes
Authors’ Note
The authors alone are responsible for the content and writing of the paper. This study was approved by the Institutional Review Board at the Tongji Medical College of Huazhong University of Science and Technology. All methods were carried out in accordance with the relevant guidelines and regulations. Written informed consent was obtained from all participants.
Declaration of Conflicting Interests
The author(s) declared no potential conflicts of interest with respect to the research, authorship, and/or publication of this article.
Funding
The author(s) disclosed receipt of the following financial support for the research, authorship, and/or publication of this article: This study was supported by the Natural Science Foundation of Union Hospital, Tongji Medical College, Huazhong University of Science and Technology (No. 02.03.2017-289).