
Abstract
Our return to a study on dogs exposed lifelong to cobalt-60 γ-radiation was prompted by a comment that data in dog studies have large statistical errors due to the small number of dogs. We located an earlier article on the same study that had a better mortality curve for the dogs in each dose-rate group. The median life span of the dogs in each group was tabulated, and the standard error of each was calculated. No statistically significant shortening of median life span was observed for the lowest dose-rate group at any reasonable significance level (P value: .005-.05), whereas for dogs with higher irradiation rates, life span shortening was statistically significant at highest reasonable significance level (P value: .005). The results were entered on a graph of life span versus dose rate, assuming a threshold dose–response model. The fitted line indicates that the dose-rate threshold for γ-radiation induced life span reduction is about 600 mGy per year, which is close to the value we found previously. Making allowance for the calculated standard errors, we conclude that this threshold is in the range from 300 to 1100 mGy per year. This evidence is relevant for emergency measures actions (evacuation of residents) and for nuclear waste management.
Keywords
Introduction
In view of the enormous fear surrounding any exposure to ionizing radiation, it is very important to establish dose and dose-rate thresholds for the onset of harmful effects. Then, users could set safe exposure limits for many applications of low doses or low levels of radiation in medicine and industry, without the need to weigh potential risks of adverse health effects.
All organisms have been exposed to ionizing radiations since they began to appear. There are geographical areas where the natural radiation dose rate is much higher, more than 1 or 2 orders of magnitude higher, than the world average value of 2.4 mSv (0.24 rem) per year. X-rays and radioactivity were discovered more than 120 years ago. About 40 years after this discovery, the international radiation protection committees recommended a safe “tolerance” dose-rate limit of about 70 rem (700 mSv) per year for the many thousands of radiologists, who were diagnosing and treating millions of patients for a wide range of different diseases. 1 Many of their treatments ranged from one to several X-ray or γ-ray exposures, each from 0.1 to 1 SED (skin erythema dose, which is about 600 rem), to local areas of the body.
The discovery in 1927 that X-rays altered cells in fruit flies led to concerns about genetic damage from any radiation exposure. Measurements of mutation frequency in fruit flies, exposed to high doses at very high dose rate, indicated its proportionality to dose. It became clear in 1946 that linearity had become a political issue when evidence of a dose threshold at 50 rem, using a much lower radiation dose rate, was marginalized. 2
Evans 3 examined extensive evidence of radiation-induced mutations in different organisms and studied its applicability to humans. He found that the natural spontaneous gene mutation rate was much higher than the rate induced by natural sources of radiation. Based on his analysis, he concluded in 1949 that no detectable increase in hereditary abnormalities is likely to result, even after many generations, if a small fraction of the population receives daily radiation doses up to 0.1 roentgen per day, or about 37 rem per year. 3
The US National Academy of Sciences misled the entire world in 1956 when it issued the recommendation, based on deliberate falsification and fabrication of the research record, to assess the risk of radiation-induced mutations using the linear no-threshold (LNT) model. 4,5 This linked any radiation exposure to an elevated risk of cell mutations (cancer), producing a radiation health scare that continues to this day. The apparent purpose was to stop the testing and proliferation of atomic bombs. 6
Many, many thousands of studies have been carried out over the past 120 years and much has been learned. In 1980, Lauriston Taylor, founder and past president of the National Council on Radiation Protection and Measurements stated: “Collectively, there exists a vast array of facts and general knowledge about ionizing radiation effects on animal and man. It cannot be disputed that the depth and extent of this knowledge is unmatched by that for most of the myriads of other toxic agents known to man.…No one has been identifiably injured by radiation while working within the first numerical standards first set by the NCRP and then the ICRP in 1934.…The LNT is a deeply immoral use of our scientific heritage.” 7 Nevertheless, intense controversy continues to this day about risk of low-dose, radiation-induced “health effects,” and the continued use of the LNT model to assess risk, mainly for economic and political reasons.
A recent overview of the current state of knowledge on the biological effects of exposures to low levels of radiation briefly describes the mechanisms that act and the responses that occur. 8 The radiation-induced effects are compared with the rate of similar effects from naturally occurring molecular damage, mainly from metabolically produced reactive oxygen species and H2O2 in aerobic organisms. The responses of adaptive protection systems, under genetic control, against the damage are described and quantified. The basis is established for the existence of dose and dose-rate thresholds, below which beneficial health effects can occur. This article points out the limitation of epidemiological studies, designed to identify risk at low dose using the LNT model. 8
In his studies to establish standards for internal emitters, radon and radium, Evans found that absolute values of permissible doses of radiation for humans could not be properly determined from animal studies alone. The proper subject for the study of man is man. 9 This explains why most studies on the effects of an acute exposure to radiation are carried out on the atomic bomb survivors of Hiroshima and Nagasaki. A very recent analysis of the leukemia incidence data of the Hiroshima survivors identified the acute dose threshold for the onset of leukemia to be about 0.7 Sv or 0.7 Gy, assuming the relative biological effectiveness (RBE) = 1. 10
The Nuclear Shipyard Workers Study carefully compared nuclear workers against nonnuclear workers. Significantly lower mortality from all causes was observed among those exposed to an average dose rate of 7.59 mGy per year than among the controls (standard mortality ratio = 0.76, with 95% confidence interval from 0.73 to 0.79). 11,12 Determination of the lifelong dose-rate threshold for harmful effects is impossible because humans may not be exposed, whole-body, to high radiation levels. However, lifelong studies have been carried out on beagle dogs, which are a good model for humans and live no longer than 20 years. This article revisits a dog study we analyzed recently. It showed a dose-rate threshold of about 700 mGy per year for life span reduction. 13 In this article, we carry out a statistical analysis of those data to assess the uncertainty of this threshold value.
Background
In our previous article on dog studies, we analyzed 2 studies of dogs that received different dose rates of ionizing radiation. 13 One study exposed 9 groups lifelong to cobalt-60 γ-radiation; the other exposed 6 groups to α-irradiation from inhaled plutonium dioxide aerosols. Each study had an additional group of control dogs. Superficial inspection of the mortality curves in both studies suggested that dose-rate thresholds for life span reduction were likely.
The life span of each dog was not available, so the median life span of the dogs (50% mortality) of each dog group was read and tabulated for each dog group. This was repeated for the dogs at the 10% and 5% mortality levels. The median life span of the dogs in each group was plotted against γ-radiation dose rate or initial plutonium lung burden (on a log scale). This was repeated for the dogs at 10% and 5% mortality. The life spans of the groups were normalized to the controls, to allow comparison of the normalized life span versus dose rate curves of the different mortality levels. 13 The results are reproduced in Figures 1 and 2.

Life spans of groups of dogs versus γ-radiation dose rate. 13
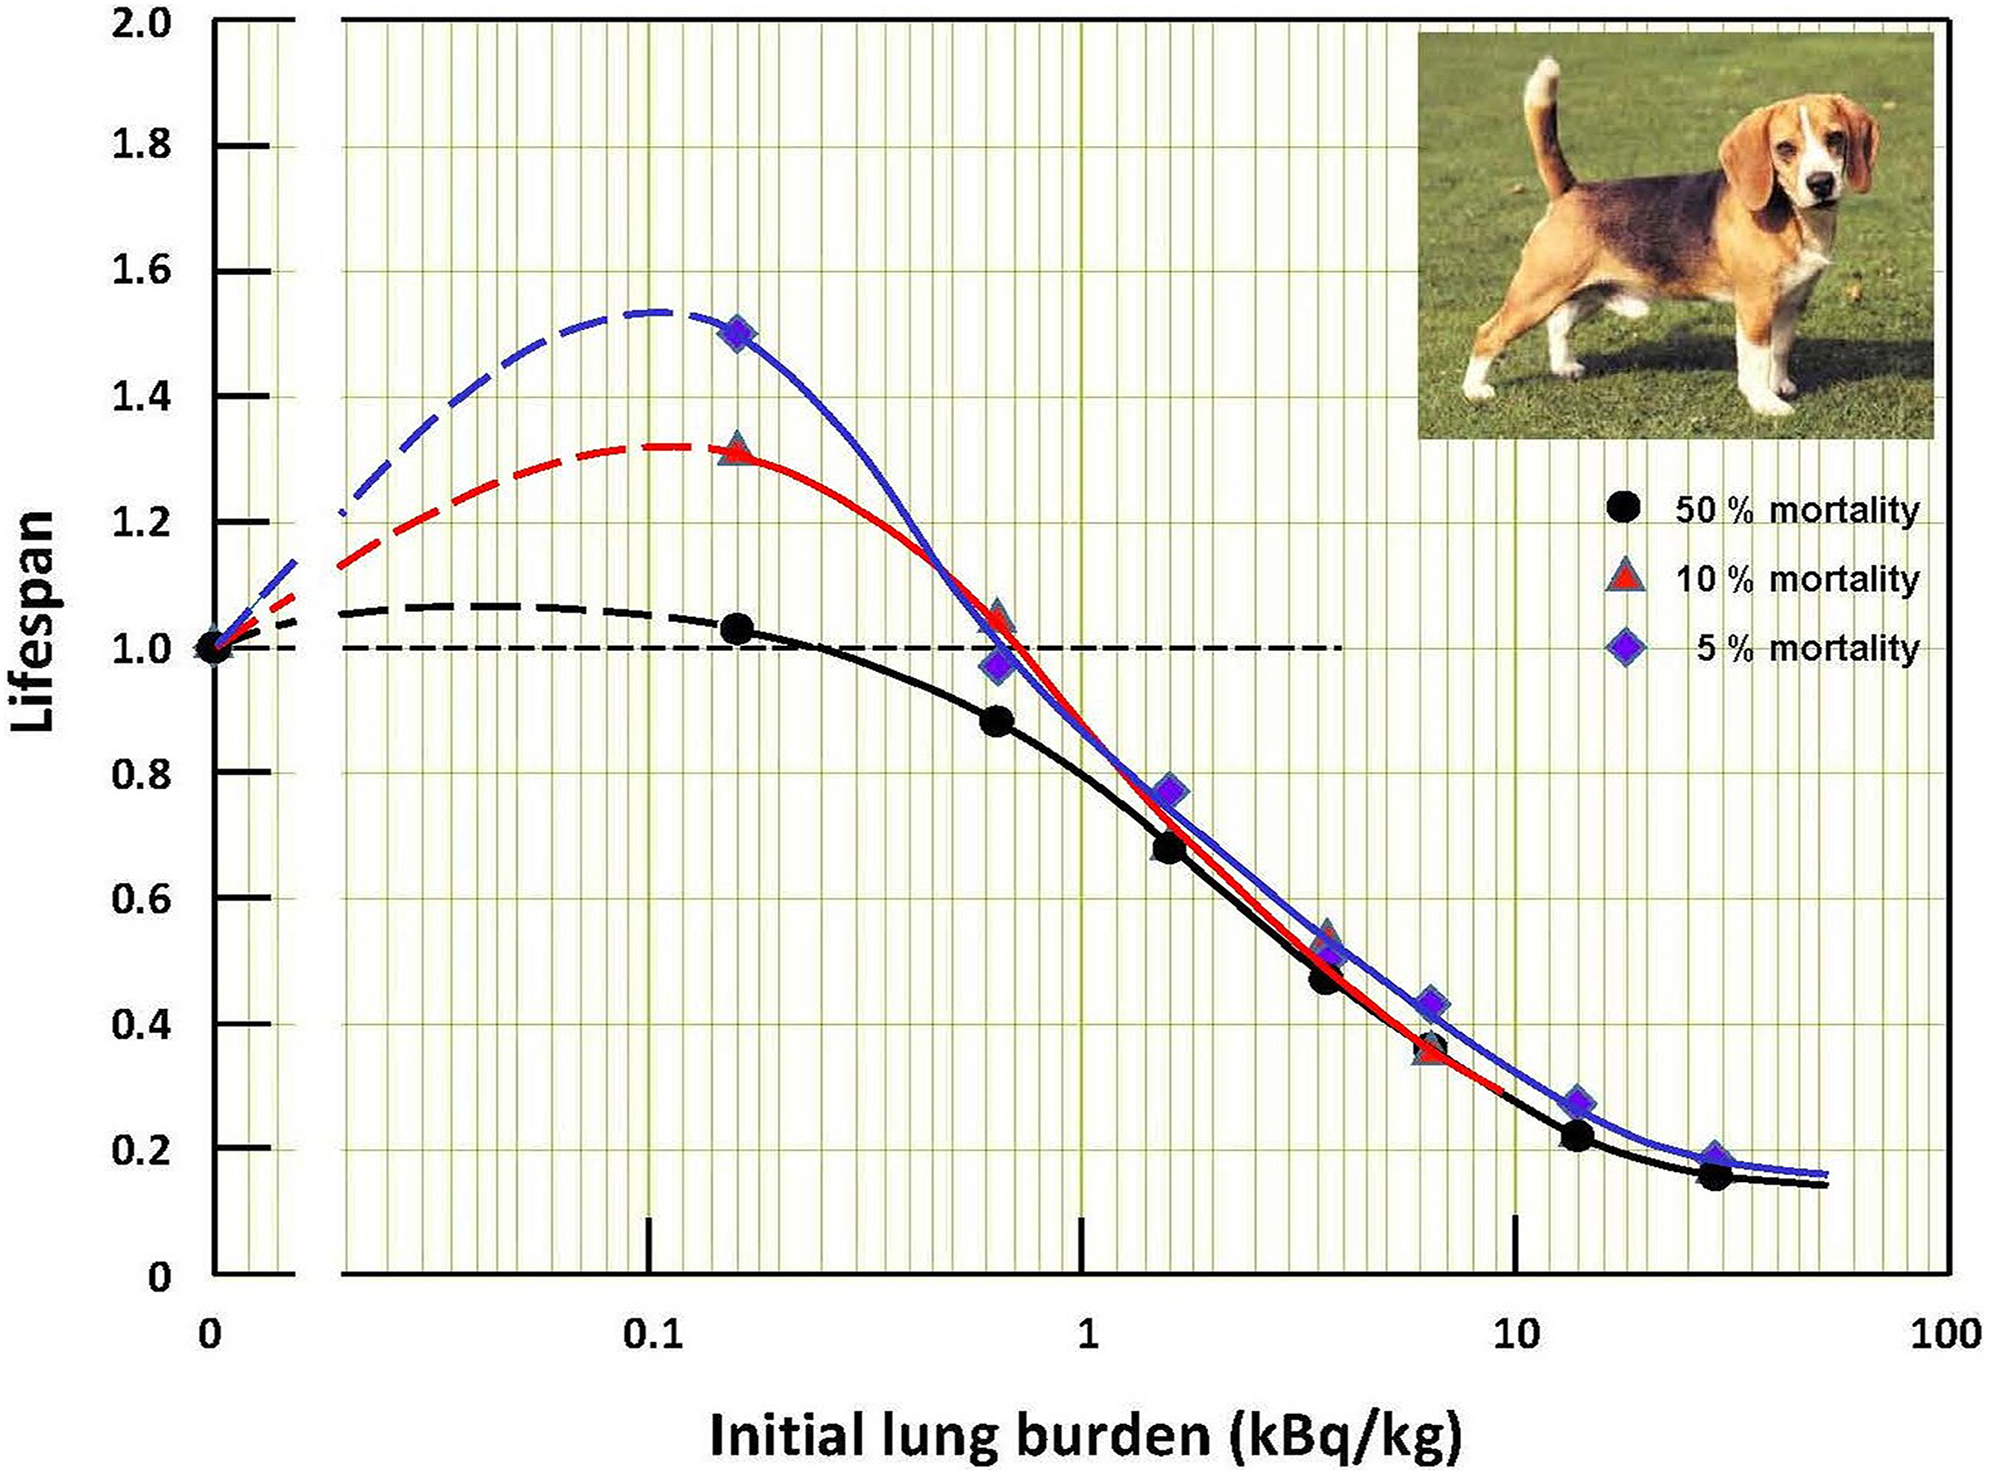
Life spans of groups of dogs versus initial plutonium lung burden. 13
Analysis of the life span data for inhaled plutonium revealed that short-lived dogs in the first group (lowest lung burden) had life spans that were longer than the life spans of the control dogs. The increase of life span for short-lived dogs was statistically significant with P values .004 and .003 for the 5%- and 10%-mortality dogs in group 1, respectively. However, no statistically significant change of median (50% mortality) life span—neither an increase nor a decrease—was observed in the first group. Progressive shortening of life span was apparent as the plutonium lung burden increased beyond the threshold lung burdens.
Analysis of the data for the γ-irradiated dogs could not establish whether the data fit a threshold or a hormetic dose–response model because that study did not include a group irradiated at a dose rate below the apparent threshold of 700 mGy/year. Had the study included a group irradiated at about 50 mGy/year, this question could likely have been resolved.
We decided to perform additional analysis to address an informal comment that the data in dog studies have large statistical errors because of the small number of dogs.
Method of Analysis
In our previous article, we analyzed the mortality curves in Fliedner et al, with life span on a log scale. 14 Recently, we found better mortality curves in Fritz with life span on a linear scale, 15 as shown in Figure 3. The Fritz article 15 references Carnes and Fritz, which describes this dog study. 16
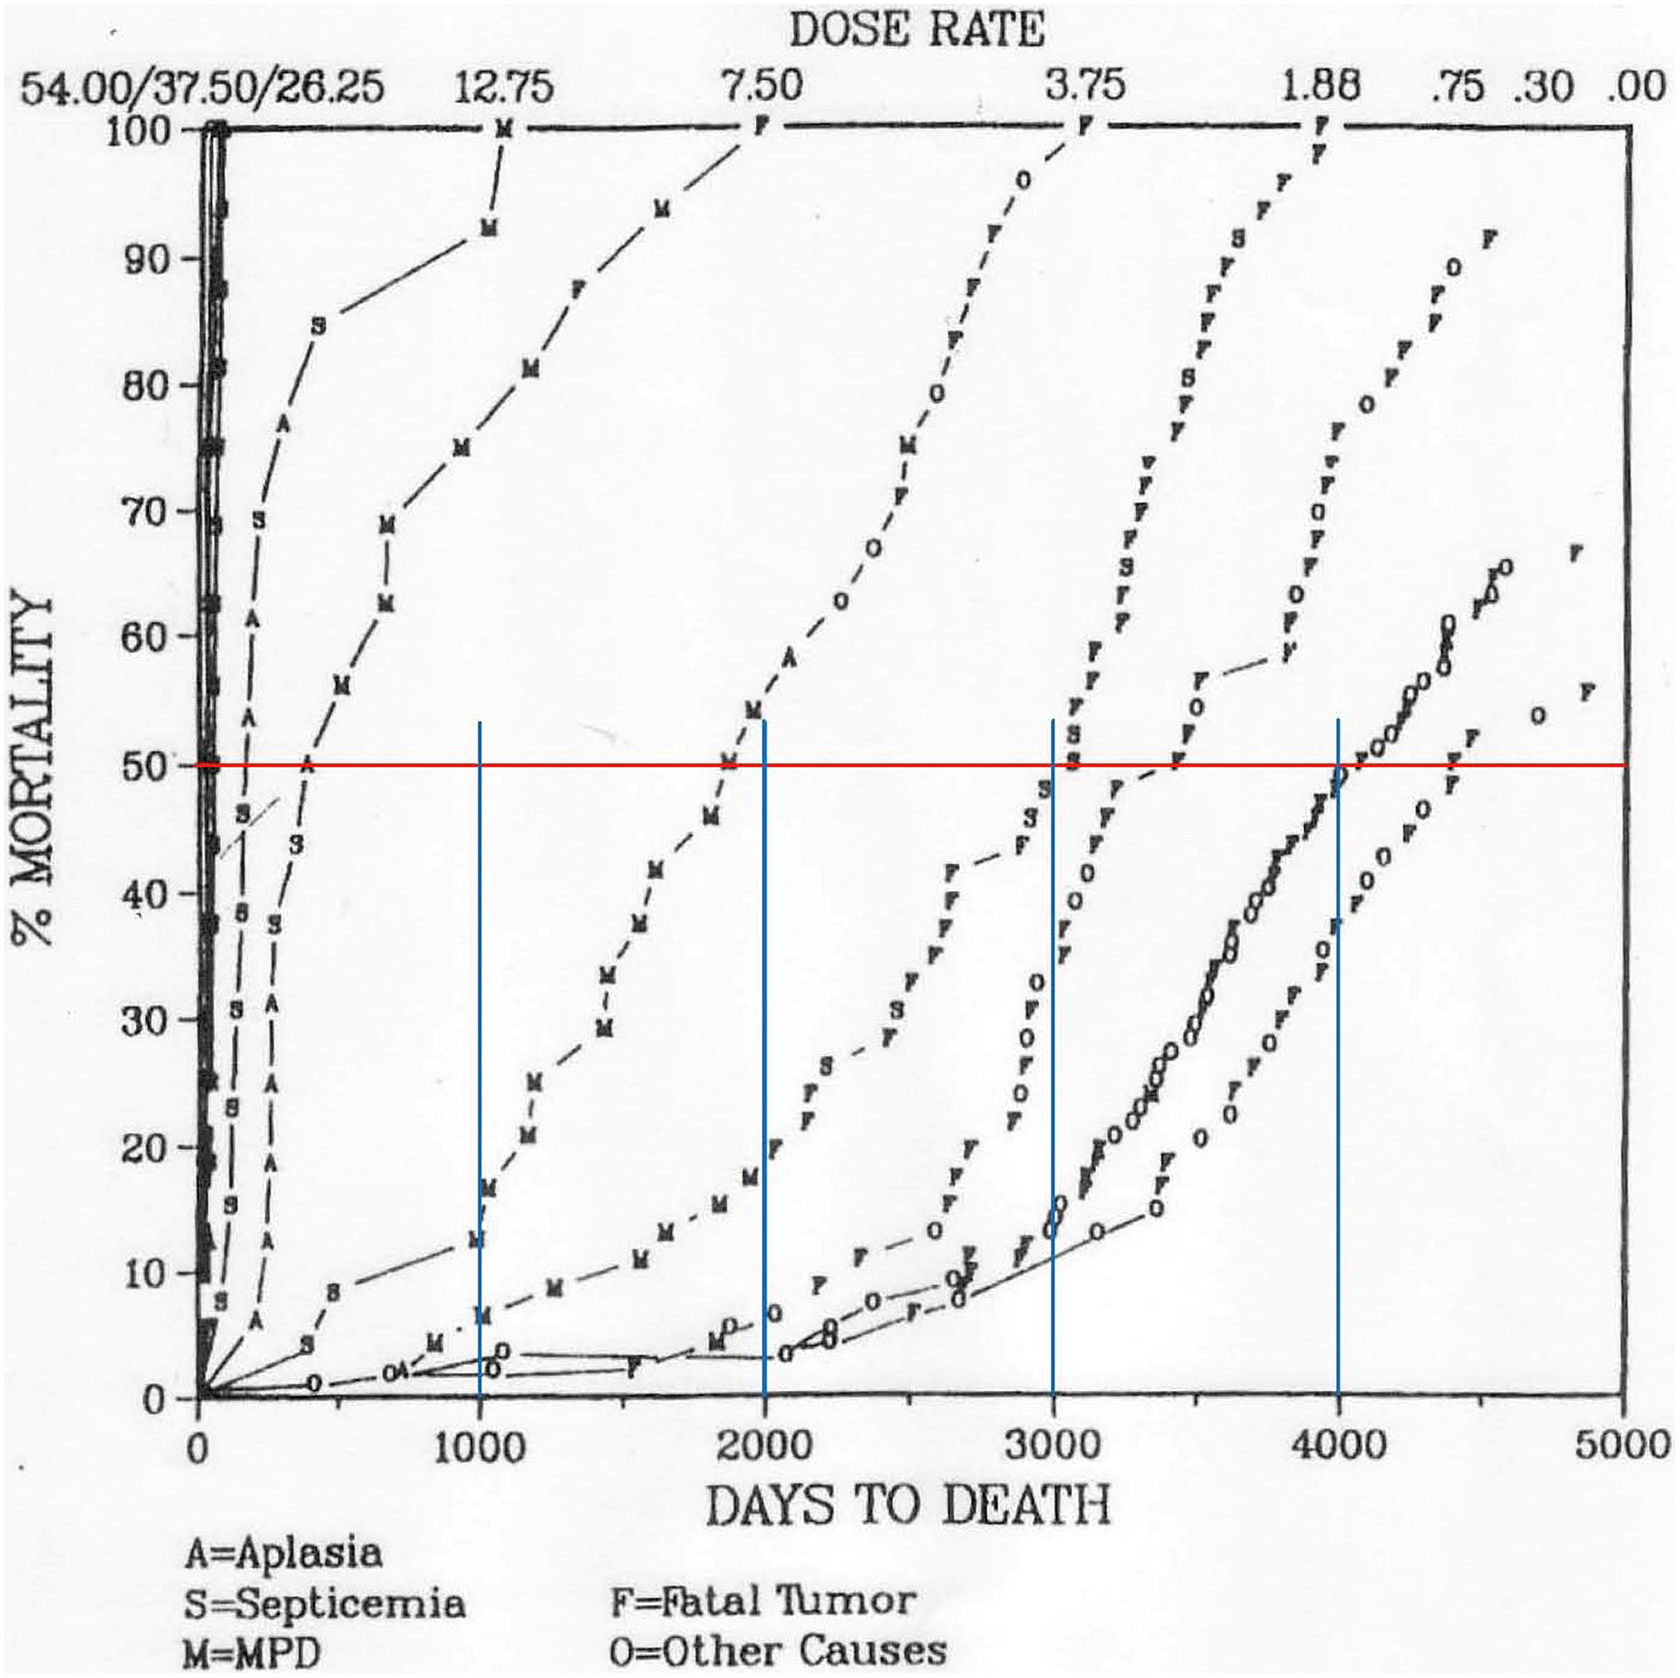
Relationship between dose rate and life span (days to death) for dogs continuously irradiated at several dose rates. 15 Note: Because the funding of this study was terminated early, irradiation ended when a significant number of dogs in the control and 0.3 cGy/d groups were still alive. A indicates aplasia; F, fatal tumor; M, MPD; O, other causes; S, septicemia.
In this study, the dose rate was maintained within ±2% of the desired value. Unfortunately, the article 16 did not list the life span for each dog. More important was the termination of the study (funding cutoff) when a significant number of the control dogs and the dogs in the 0.3 cGy/d group were still alive. Being unable to calculate average life span for the 2 most interesting groups, we again calculated and compared the median life span of the dogs in each group.
The median life span T50 of each group was determined from Figure 3 and entered into Table 1. The statistical uncertainty of T50 was calculated as follows.
Median Life Span T50 and Its Standard Deviation σ[ΔT50] in Each Group.

By definition of T50, each dog has a probability (p) of 50% of dying at an age <T50. The death of each dog at an age <T50 can be considered a Bernoulli stochastic process. 17 If a group contains initially N dogs, then the average number n50 of those living until T50 is n50 = p × N and standard deviation of those living until T50 is σ[n50] = (N × p × (1 − p))1/2. The standard deviation of the mortality ratio n50/N is therefore σ[MR50] = (p × (1 − p)/N)1/2. The standard deviation of the median life span σ[T50] can be then calculated by dividing σ[MR50] by the slope of the mortality curve. The slope was determined from Figure 3 as 0.03 percent/day (or 3.0 × 10⁻⁴ day−1) for the controls.
The standard deviation of the mortality ratio σ[MR50] and the standard deviation of the median life span σ[T50] were calculated for the control group and for the 3 groups with the lowest irradiation dose rates.
Quantitative estimation of the radiation dose-rate threshold from the data can be only model dependent. Our model is based on an exponential hazard function. 18 That is, risk (mortality) for a given age increases exponentially with the exposure rate. Carnes and Fritz 16 used the hazard function:

In order to estimate the dose-rate threshold, we used the hazard function:

with f = 1 below the threshold. Then, we calculated the parameter THRESHOLD from the data.
This was actually done by fitting a line to the data, on a semilog graph of life span (linear) versus dose rate (logarithmic) for the irradiated dogs, and extrapolating this line to the life span of the controls.
Results
The results were tabulated in Table 1. We did not analyze the data of the higher dose-rate groups (3.75, 7.5, and 12.75 cGy/d) because irradiation of these dogs began at later ages in their lives, as indicated in Table 1 of the Carnes and Fritz article. 16
As follows from Table 1, the difference between the median life spans ΔT50 of the controls and the 0.3 cGy/d group is 4430 − 4060 = 370 days. Assuming statistical independence of the 2 groups, the standard deviation of this difference is σ[ΔT50] = (220 2 + 180 2 )1/2 = 285 days. The difference ΔT50 = 1.3 × σ[ΔT50] is not statistically significant at any reasonable significance level. (Reasonable P values for significance levels are between .005 and .05, corresponding to a difference of about 3σ to 2σ, respectively.) Therefore, the data are consistent with a threshold as high as 0.3 cGy/d. This corresponds to about 1100 mGy/year, which is 460-fold the world average radiation background (2.4 mGy/year).
We repeated our statistical analysis for dogs with higher irradiation rates. For the groups of 0.75 cGy/d and 1.88 cGy/d, ΔT50 is 1090 and 1400 days, correspondingly (see Table 1). The corresponding σ[ΔT50] is 333 days (same for both groups since σ[T50] are equal). The difference is ΔT50 = 3.3 × σ[ΔT50] and ΔT50 = 4.2 × σ[ΔT50], correspondingly. Both differences are statistically significant at .005 significance level.
Formally speaking, our null hypothesis (basic assumption) is that there is no impact of radiation on median life span for any dose rate. As shown above, this null hypothesis cannot be rejected for the 0.3 cGy/d group at any reasonable significance level (P value .05 or lower). As for the 0.75 and 1.88 cGy/d groups, the null hypothesis should be rejected at any reasonable significance level (P value .005 or higher). Essentially, irradiation at these elevated γ-radiation dose rates really shortens the median life span of these dogs.
The data in Table 1 are shown in Figure 4. The intersection of the fitted red line with the median life span of control dogs gives the threshold dose-rate as 600 mGy per year. Supplementary lines in blue were added to reflect the effect of the uncertainties of the data on the uncertainty of this threshold, which is likely in the range from 300 to 1100 mGy per year.

Life span of median dog versus dose-rate for lifelong exposure to γ-radiation. The error bars shown are ±σ (one standard deviation).
Conclusions
This revisit to our previous article that analyzed 2 dog studies 13 was prompted by a comment that data in dog studies have large statistical errors due to the small number of dogs. Better mortality curves were found for the same study on lifelong exposure to γ-radiation, and the standard error of the median dogs’ life span in each dose-rate group was calculated by considering the death of each dog as a Bernoulli stochastic process. No statistically significant shortening of median life span was observed for the dogs irradiated at 1100 mGy per year at any reasonable significance level (P value: .005-.05), whereas for dogs with higher irradiation rates, life span shortening was statistically significant at highest reasonable significance level (P value: .005). The life span versus dose-rate data were fitted by a threshold dose–response model with an exponential hazard function. The dose-rate threshold for γ-radiation induced life span reduction was found to be about 600 mGy per year, with a likely range estimated to be from 300 to 1100 mGy per year.
Assuming that beagle dogs model humans, this dose-rate threshold for the onset of a harmful health effect, that is, decrease of longevity, is consistent with the “tolerance dose” (rate) limit of 0.2 roentgen per day that was adopted for radiologists by the radiation protection community around 1925 and by the ICRP in 1934. 1 This limit is equivalent to about 70 rem per year 1 or 700 mGy per year for γ-radiation.
This radiobiological evidence should be considered when setting a γ-radiation dose-rate limit for emergency measures actions (evacuation of residents) and for nuclear waste management. 19
Footnotes
Declaration of Conflicting Interests
The author(s) declared no potential conflicts of interest with respect to the research, authorship, and/or publication of this article.
Funding
The author(s) received no financial support for the research, authorship, and/or publication of this article.