
Abstract
Background:
Ammonia is one of the chemical compounds that can cause acute and chronic effects to the workers. The purpose of this study is to determine the no-observed-adverse-effect level (NOAEL) ammonia in white mice.
Methods:
This study applied a laboratory experimental with design post test-only control group design using white mice as an object. The process of finding the safe limit began by determining the highest dose and the lowest dose of ammonia without effect in white mice.
Results:
The latest research showed that the highest dose without effect is 0.0456 mg/kg and the lowest dose without effect is 0.0046 mg/kg. After determining the highest and the lowest dose of ammonia, the researcher started to determine the middle dose. The middle dose is the dose between the highest and the lowest doses with the multiplication of 1.5 starting from the lowest dose (there are 5 middle-dose variations from 5 middle concentration variations), consisting of 0.0872, 0.1309, 0.1963, 0.2944, and 0.4416 mg/m3.
Conclusion:
From the result of the middle dose and the lowest dose without effect, it is found the value of the highest NH3 dose without effect, which showed the highest Index Remmele Scale (IRS) CD4 before the reduction of IRS. The study concludes that the NOAEL of ammonia contained in white mice is 0.0103 mg/kg body weight of the mice.
Keywords
Introduction
Ammonia is naturally found in soil, water, and air and is produced by humans and animals from the results of normal biological processes. 1 Ammonia is one of the chemical compounds that can cause acute and chronic effects to the workers. A study obtained the following conclusions: ammonia exposure causes dry throat (80.00%), dry airway (73.30%), eye irritation (66.67%), nasal irritation and cough (53.30%), and fainting (6.67%) with the level of ammonia below the threshold limit value. 2 Another research showed that ammonia increased chewing and licking, ocular irritation, salivation, lacrimation, oronasal secretion, and labored breathing. 3 In addition, there is an increase in the level of brain glutamine in rats inhaling 25 to 300 ppm of ammonia vapor for 6 h/d for 5 days. Continuous exposure to ammonia for 24 hours to a concentration of 32 ppm will increase blood ammonia levels, whereas in humans will cause eye irritation, dyspnea, and histopathological changes in the lungs (alveolar disorder and loss of continuum septum). 4
The threshold limit value that applied in Indonesia is the value adopted by the other state or other institutions. The threshold limit value is set based the on economic and technology consideration so that every country has a different value. Therefore, it is necessary to do a scientific study to determine the threshold limit value of ammonia in Indonesia. The first step that needs to be done, based on the World Health Organization International Program on Chemical Safety-Environmental Health Criteria 54 to Ammonia, is determining the highest dose without effect showed by ammonia in white mice experiment or no-observed-adverse-effect level (NOAEL). 5 Some studies related to the effect of ammonia in white mice showed that the Lethal Concentration 50 in 2 days is 7.6 mg/L. 6 Furthermore, there is conjunctiva irritation in white mice exposed to ammonia with the concentration of 100 ppm about 2 to 6 weeks.
The process to achieve safe threshold limit value began by determining the highest dose of ammonia without effect (NOAEL) in white mice. 7 The impact of ammonia on humans with NOAEL of 100 M ppm will interfere with the respiratory system if exposed to >5 weeks. 8 The effects of ammonia in white mice can be observed by looking at anatomical and histological changes in the lung and also biomolecular aspect, which is a CD4 immune response. It is said that CD4 immune response has an effect if there is a decrease in the immune response in CD4 lymphocyte cells, and CD4 immune response has no effect if there is no decrease in the immune response in CD4 lymphocyte cells. 9 After determining the highest dose of ammonia with no effect in white mice, the study continued by extrapolating data to the workers to find a safe dose of ammonia for human using the formula translation dose from animal to human. Afterward, the data are converted into NH3 concentration to find the threshold limit value of NH3 in the workplace by involving some variables such as breathing rate, work duration, the percentage of the dose absorbed by respiratory tract, and the worker’s weight. 10 The results of this study are used to determine the highest dose of ammonia without any effect in white mice.
Methods and Materials
This study was a laboratory experimental study. The object of this study was white mice. The study aimed to determine the NOAEL of ammonia in white mice. After determining the highest and the lowest dose of ammonia, the researcher started to determine the middle dose. The middle dose is the dose between the highest and the lowest doses with the multiplication of 1.5 starting from the lowest dose (there are 5 middle-dose variations from 5 middle concentration variations), consisting of 0.0872, 0.1309, 0.1963, 0.2944, and 0.4416 mg/m3, as shown in Figure 1. This study applied a laboratory experimental with design posttest-only control group design using white mice as an object. The initial measurement was not done because the object is homogeneous. 11 The treatment used in the research was giving ammonia exposure with varying doses in white mice.

Research design. O indicates observations; P0, NH3 exposure at a concentration of 0.0000 mg/m3 (control group); P1, NH3 exposure at a concentration of 0.0872 mg/m3; P2, NH3 exposure at a concentration of 0.1309 mg/m3; P3, NH3 exposure at a concentration of 0.1963 mg/m3; P4, NH3 exposure at a concentration of 0.2944 mg/m3; P5, NH3 exposure at a concentration of 0.4416 mg/m3.
The species of white mice is Rattus norvegicus, which were grown free from ammonia exposure. They were obtained from Veterinary Laboratory, Faculty of Pharmacy, Airlangga University. The chosen white mice were male, weighing between 138 and 142 g, and age 2 to 3 months (breeding mice). 12 The white mice were kept by following several requirements: control, environmental monitoring, health status monitoring, surveillance on researchers and workers, and food and beverage supervision.
This experimental study has 2 requirements, the first requirement is replication and the second requirement is randomization into the treatment stage. 13 The number of replication is determined using the following formula:

where T is the number of treatment levels and r is the number of replication. 14 In this study, T = 6, so (6 − 1)(r − 1) ≥15. Using the formula, the final calculated value is r = 4, which means repetition was conducted at least 4 times until the required sample in this study reached a minimum of 24 white rats. In anticipating dead samples, the number of new replication (r′) was obtained using the following formula:

When f = 0.25, then r′ = 6. Thus, the total number of replication (r′) is 6 × 6 = 36 or it took 36 white rats. The research variable includes: The independent variables: The independent variables in this study are NH3 concentrations and NH3 dose. The dependent variables: The dependent variable in this study is the pathology anatomy and histology of white mice’s lung, the expression of CD4 on lymphocytes, NOAEL.
Results
Observation
The observation of histopathological changes
Figure 2 showed histopathological comparison including congestion, edema, infiltration, degeneration, necrosis, fibrosis, and hyperplasia in the lung of white mice. Slide K showed an illustration of the normal lung of white mice as a control group (unexposed to ammonia), which had no histopathological changes. Slides 1, 2, 3, 4, and 5 showed the result of the treatment group (exposed to ammonia) with a dose of 0.0068, 0.0103, 0.0150, 0.0231, and 0.0346 mg/kg. Slides 3, 4, and 5 showed the alveoli damage, which is characterized by the rupture of wall alveoli and also necrosis that caused alveoli space dilatation. Representative picture was obtained from hematoxylin and eosin (H&E) staining: ×400 magnification, Olympus BX-50, Pentax Optio 230, and Digital Camera 2.0 megapixel.

Histopathological comparison of white mice after exposure to ammonia at different doses.
The observation on the expression of CD4 lymphocytes
Figure 3 showed a comparative expression of CD4 lymphocytes in bronchus-associated lymphoid tissue in white mice lungs after exposed to ammonia at different doses. This picture is shown by the percentage number of CD4 immunoreactive cell (A) and the color intensity (B). The product of A and B is called Index Remmele Scale (IRS). 14 Slide K (control group) showed the low expression of CD4, with the percentage number of immunoreactive cells less than 10% and less color intensity. In the exposed group I, with 0.0068 mg/kg body weight the immunoreactive cells had increased between 11% and 50% and had medium color intensity. In the exposed group II, with 0.0103 mg/kg body weight, the immunoreactive cell was between 11% and 50% but had more color intensity, and the color intensity was stronger than the exposed group I. In the exposed group III, with 0.0154 mg/kg body weight, the immunoreactive cell was between 11% and 50% and had medium color intensity, but the color intensity was lower than the exposed group II; therefore, the IRS score of the exposed group III was lower than that of the exposed group II. In the exposed group IV, with 0.0231 mg/kg body weight, the immunoreactive cell was less than 10% and had medium color intensity. In the exposed group V, with 0.0346 mg/kg body weight, the immunoreactive cell was less than 10% and had less color intensity. Representative picture was obtained from H&E staining: ×400 magnification, Olympus BX-50, Pentax Optio 230, and Digital Camera 2.0 megapixel.

Comparison of CD4 expression on immunoreactive cells on white mice BALT lung after exposure to ammonia at different doses. BALT indicates bronchus-associated lymphoid tissue.
Analysis and Research
Analysis of lung tissue damage of the exposed group and control group
The analysis of lung tissue damage in white mice was done using scoring technique. The damage scoring value or histopathological index in each sample was the median of all types of lesions that occurred. Based on the observation of the damage level, the results are presented.
The observation result of lung tissue damage including congestion, edema, infiltration, degeneration, necrosis, fibrosis, and hyperplasia in the lung tissue of control group showed the median tissue damage score was 2.5, while in the exposed group, the lowest exposure was 6.5 and the highest exposure was 18.5. It is showed that the higher the dose, the more the level of tissue damage. Figure 4 shows the bar chart of histopathological lung tissue damage of the exposed group and control group.

Lung histopathology of rats exposed to ammonia and the control group.
Histological lesions observed include congestion, edema, infiltration, degeneration, necrosis, fibrosis, and hyperplasia. Based on the statistical analysis using Kruskal-Wallis test, tissue damage in the exposed and control groups was significantly different (P = .001). The analysis by Mann-Whitney test (Table 1) concluded that the exposed group I was not significantly different from the exposed group II, but both are significantly different from the exposed groups III, IV, and V. Thus, there are significant differences in tissue damage between the exposed groups I and II and the exposed groups III, IV, and V, as shown in Figure 4. Different superscript in the same column in Table 1 indicates significant differences (P < .05).
Observation on Lung Tissue Damage of White Mice.

From the above description, it can be concluded that a dose in the exposed groups I and II did not differ significantly and that the expression of lymphocyte cells was equal. In this state, the dose of ammonia with higher lymphocyte cell expression will become the highest dose without effect. Thus, the second dose, which is 0.0103 mg/kg body weight of white mice, will become the highest dose without effect or NOAEL of ammonia. The relationship of ammonia and histopathologic lung dose of white rats exposed to ammonia and control groups is presented in Figure 5.

The relationship between NH3 dose with lung histopathology of the exposed group and the control group.
The figure showed the relationship between dose and response to dose (linear) and response (absolute) described by linear curve because the analysis was a short-term toxicity test (subacute) that was 14 days of research.
The expression of CD4 lymphocyte
The highest score of CD4 IRS was in group II (5.25) with the dose of 0.0103 mg/kg (Table 2). Statistical analysis was done using Kruskal-Wallis test. There was no significant difference in CD4 expression between the control group and the exposed groups I, II, III, IV, and V, with a significance P (.448) > α (.05). The insignificant difference can be seen from the number of IRS immune response, which was almost similar between the exposed and control groups taken by immunohistochemistry coloring: ×1000 magnification, Olympus BX-50, Pentax Optio 230, and Digital Camera 2.0 megapixels.
The Observation of CD4 Expression in Lymphocyte Cells on White Mice Lung.
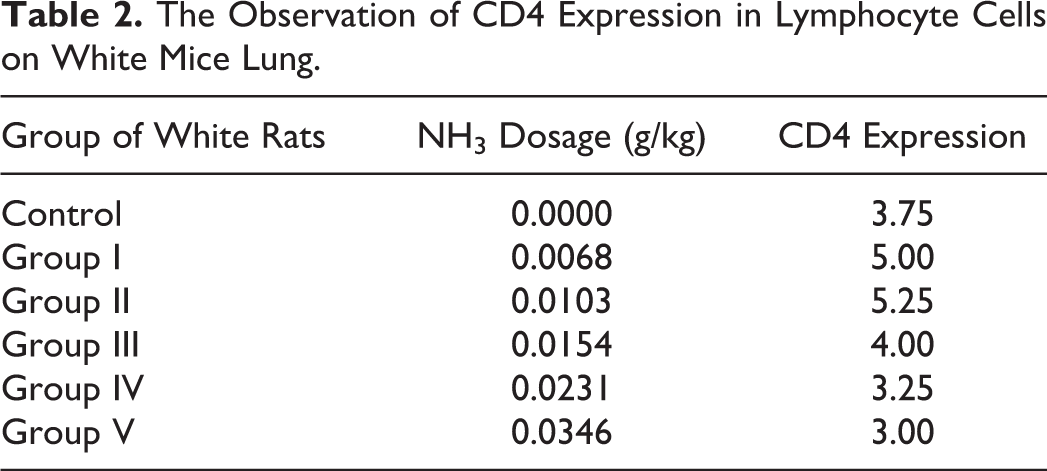
There were no significant differences of CD4 IRS on the exposed group and control group in this study because the concentration of exposure in each group had a little difference, which was only 1.5, and the number of immune response also had little difference. In the description, the IRS of the exposed group II (5.25) with 0.0103 mg/kg body weight was higher than the exposed group I (5.00) with 0.0068 mg/kg body weight, as shown in Figure 6. This means, the immune response of white mice in the exposed group II is good and had no effect of exposure yet. This description is important to determine NOAEL or the highest dose of ammonia without effect in white mice.

The relationship of NH3 in ammonia exposed group and control with CD4 IRS immune response. IRS indicates Index Remmele Scale.
Discussion
Histopathological Lung of Exposed Group and Control Group
Ammonia that is inhaled with high concentration will affect systemic absorption through the lungs. Several studies have been conducted on several animals, one of which is a rat. Repeated ammonia exposure that is 8 hours/5 days a week for 30 days with a concentration of 155 mg m3/223 ppm does not produce adverse effects and no lung changes in animals given exposure or control. 15 In addition, rats given ammonia exposure for 1 hour with a concentration of 3440 to 12940 ppm showed an effect of liver lesions, congestion, necrosis, eye irritation, dyspnea, pneumonitis histopathological changes in par alveolar disrupted, and loss of septal continuity. 4
There were no significant differences of CD4 IRS between exposed group and control group in this study because the concentration of exposure in each group had a little difference, which was only 1.5, and the number of immune response also had little difference. In the description, the IRS of the exposed group II (5.25) with 0.0103 mg/kg body weight was higher than the exposed group I (5.00) with 0.0068 mg/kg body weight. This means, the immune response of white mice in the exposed group II was good and had no effect of exposure yet.
Congestion is an increased blood volume in certain tissues. Figure 2 showed that there was an increased blood volume in the lungs of the exposed group. The higher the dose of ammonia, the more increased the blood volume. The congestion in the lung due to ammonia showed the larger erythrocytes in capillaries and the larger blood vessel in the lung. The worst congestion can cause the worst histopathological changes.
Edema is an excessive accumulation of fluid in the tissues, which results in advanced lung congestion. In the exposed group, there was an increase in fluid in the lung compared to control group (Figure 2). The higher the dose of ammonia, the higher the fluid volume in lung tissue. The increasing volume can cause the leak through capillary wall and dyspnea.
Infiltration is a pathological diffusion or accumulation of substances that were abnormal or in excess of normal in tissues or cells. There was an increase accumulation of substances to the damaged tissue in the lungs of the exposed group compared to control group (Figure 2). The higher the dose of ammonia, the more the accumulation of substances, causing tissue damage. This is due to pathological diffusion from normal cells into abnormal cells.
Fibrosis (the formation of connective tissue) occurs as a consequence of the continued inflammatory process. There was an increase in connective tissue in the lungs in the exposed group compared to the control group (Figure 2). The higher the dose of ammonia, the more the accumulation of substances, causing tissue damage. The first sign of lung fibrosis is an inflammation of the lung tissue. Also, the alveoli can no longer have the ability to have the oxygen and can cause asphyxia and chronic dry cough.
Hyperplasia is an increase in the number of cells in the lungs. There was an increase in the number of cells (hyperplasia) in the exposed group compared to the control group (Figure 2). The higher the dose of ammonia, the more the number of cells in the lungs. This is due to the division and multiplication in lung cells in response to ammonia stimuli.
Degeneration is a condition of the intracellular biochemical changes characterized by morphological changes due to injury and fatal to the cell, although it is reversible. There were morphological changes in the lung in the exposed group compared to the control group (Figure 2). The higher the dose, the more the morphological changes occur in the lung of exposed group.
Necrosis is the premature death of cells and living tissue due to ammonia. Necrosis begins with cell swelling, chromatin digestion, and disruption of the plasma membrane and organelle membranes. The end of necrosis is characterized by DNA hydrolysis extension, vacuolation of the endoplasmic reticulum, an organelle damage, and cell lysis. In a histological test on necrosis, pneumocystis cells undergoing necrosis were marked by the loss of a key feature of the septum interalveolar cells. In more severe circumstances, the normal structure of alveoli can no longer be recognized. 11,16
Data analysis was done using Kruskal-Wallis nonparametric test. As a result, P value (.001) < α (.05), which means there was a statistically significant difference in lung histopathological changes in each group. After that, data analysis was continued using Mann-Whitney test.
The results of Mann-Whitney test showed that the exposed group I was not significantly different from the exposed group II. But both are significantly different from the exposed groups III, IV, and V. Therefore, there were significant differences between the exposed groups I and II and the exposed groups III, IV, and V. In the description, the exposed groups I and II had no different dose, and the expression of lymphocytes had no difference significantly. Based on these results, it can be stated that the dose of ammonia with the higher lymphocyte expression will be the highest dose of ammonia without effect in mice.
Expression CD4 Lymphocyte Cell Lung Mice Exposure to Ammonia and Control Group
Dendritic cells, which are nonspecific immune cells, acted as intermediaries of the immune system (nonspecific) to the adaptive immune system (Figure 3). Dendritic cells, which are nonspecific immune cells, presented antigen to T cells to initiate the whole immune response depending on T cells. 17 Ammonia has polar characteristics with a diameter of 4 Å and thus can be absorbed into the cell by passive diffusion with intermediary/carrier protein. Ammonia acts as a hapten, which will bind the carrier proteins to be immunogenic and into the T cells, including CD4. Continuous exposure to ammonia causes a decline in CD4 cell immune response of CD4 lymphocytes. T-cell recipients or T-cell receptor) has a typical domain structure consisting of molecules of protein (immunoglobulin superfamily) that contain an amine group. Thus, structurally T cells that contain amine groups will easily bind with ammonia. 17
Based on a review aspect of the chemical bond, the bond between ammonia and CD4 T cells involves only the noncovalent style and, theoretically, is reversible. As an immune system CD4-containing immunoglobulin, CD4 superfamily group contains ammonia (Figure 2). Ammonia has a chemical formula analogous to the amine group. 17 Thus, CD4 can interact strongly with the ammonia and cause toxicity to CD4. The result indicated an expression of CD4 lymphocyte cells. NH3 gas with various doses will enter the bronchioles and induce bronchioles in the lungs. After going through the M cells, the cells will present ammonia (antigen-presenting cells [APC]). It is also possible that ammonia gas entering through M cells will be produced by APC to class II major histocompatibility complex and may induce helper T cells—CD4 that might change the morphofunction into Th1-CD4.
Other study showed the impact of ammonia on the immune response of white shrimp Litopenaeus vannamei and the susceptibility to the bacterium Vibrio alginolyticus and found that the shrimp exposed to 11.21 and 21.22 mg/L ammonia-N for 7 days and that the phagocytic activity and efficiency for bacteria V alginolyticus significantly decreased. This showed that the ammonia in the water caused depression in the immune response and increased mortality from bacterial infections V alginolticus and L vannamei. 18 The expression of CD4 cells in the results of this study is shown in Figure 3, through the percentage of immunoreactive CD4 cell counts (A) and the color intensity (B). The product of A and B is called IRS. 9 The higher the IRS, the better the immune response; if the IRS decreases, the effect would occur. This was in accordance with the immune system concept, which was a mechanism to maintain the body as a protection against the danger posed by a variety of materials in the environment. A weak defense indicates the decreasing number of the immune response. 17
Based on the test results, there was no statistically and significantly different expression of the number of CD4 lymphocyte cell lung in white mice between the exposed group and the control group, with a significance level of P (.448) > α (.05). The absence of significant differences can be seen from the number of CD4 immune response IRS which was almost equal between the exposed group and control groups. This was demonstrated using immunohistochemistry staining: ×1000 magnification, Olympus BX-50, Pentax Optio 230, and Digital Camera 2.0 megapixels.
There were no significant differences in CD4 IRS on the exposed and control groups in this study because the concentration of exposure in each group had a very small difference. The difference was only 1.5. Thus, the number of issued immune response is also almost the same. However, if it was observed descriptively, the IRS of exposed group II (5.25) at a dose of exposure 0.0103 mg/kg is higher than that of the exposed group I (5.00) at a dose of 0.0068 mg/kg. This means that the immune response of white mice at exposed group dose II was still good, and there were no effects from ammonia exposure because the immune system of white mice still worked well to recognize and dispose of ammonia. 17
The Highest Ammonia Dose Without Effect (NOAEL) in White Mice
The result showed that the dose of ammonia without any effect on white mice (NOAEL) was 0.0103 mg/kg. The findings were based on the results of histopathological analysis using Mann–Whitney test. The lung tissue damage in white mice of the exposed group I, as seen in Table 2, in the control group and the exposed groups I and II is significantly different from the exposed groups III, IV, and V. Thus, it can be stated that white mice in the exposed groups I and II did not experience the effects caused by exposure to ammonia because it was closer to the control dose compared to the exposed groups III, IV, and V.
In this histopathologic analysis of the exposed group dose II, the tissue lesion score was higher than the first exposed group and the control group, but it was not statistically and significantly different. Thus, the dose group II, that is, 0.0103 mg/kg body weight of white mice, had the highest dose of ammonia without any effect on mice. This is in accordance with the opinion of reference that the NOAEL is determined statistically, in which there was no significant relationship between the dose of the exposed group and the control group. 17
In immunohistochemistry analysis using Kruskal-Wallis statistical test, there were no significant differences in CD4 expression between the control group and the exposed group. However, IRS at exposed group dose II was descriptively higher than the others. It can be stated that the immune response or IRS CD4 group II was the highest of IRS at the highest dose of ammonia without effect or NOAEL in the mice. Ammonia NOAEL value based on inhalation noncancer toxicity guidance values of Agency for Toxic Substances and Disease Registry for humans is 6.97e−2 × 100 mg/m3 in the chronic category and in the acute category is 1.18e+0 × 100 mg/m3. 15 In humans, minimum risk level based on an NOAEL is 9.2 ppm for the sense of smell, eye, and throat irritation; respiratory symptoms such as cough, bronchitis, wheezing, and dyspnea; and lung function parameters such as forced vital capacity. 4,19
In one study, NOAEL is a dose determined experimentally, in which there was no significant indication statistically or biologically from the concerned toxic effects. 20 Thus, although the immunoreactive IRS CD4 expression was not significantly different in the Kruskal-Wallis test, IRS CD4 can be used as a reference in determining the NOAEL.
From Figure 6, it can be stated that the higher the dose, the higher the occurrence of ammonia tissue damage, including congestion, edema, infiltration, degeneration, necrosis, fibrosis, and hyperplasia. This was a contrast to the CD4 immune response, which begins with a rising curve showing a good immune response (not a negative effect). Afterward, the immune response decreased, which showed a negative effect. Thus, this pattern of immune response curve makes it easier to determine the highest dose without effect or NOAEL compared to the curve patterns of tissue damage. This was confirmed by a concept that immune system is the gateway to diseases. The effect occurs because there was a decrease in the immune response. 21
Another study showed that the relationship between the concentration of a substance (not log concentration) and the response of living organisms, in the determination of environmental quality standards. 6 The determination of the environmental quality standards was based on the determination of the NOAEL and lowest-observed-effect level (LOAEL; Figure 6), with the inverted curve, obtained, that showed a good response at the beginning until the peak response and then continues to decline.
The decreasing immune response gave an indication that there has been an effect or impact of ammonia to the body. Similarly, the results of this study showed that the CD4 lymphocyte cells decrease when ammonia affects the body. At ammonia dose of 0.0103 mg/kg body weight, the peak of immune response was observed in the rats, as seen from the rise of the IRS CD4 value. Afterward, the IRS of each lymphocyte cells decreased. Thus, the ammonia dose of 0.0103 mg/kg can be stated as the highest dose with no effect on the body (NOAEL).
The results also provide a solution to the problem of determining the time of the effect and the nonoccurrence of effects, as well as determining the lowest dose that gave the effect or LOAEL. Thus, the determination of the NOAEL, LOAEL, or the time of occurrence of the effect and no-effect through the relationship between toxic dose and the immune response in this study was new or a recent discovery in the field of toxicology. In the textbooks of industrial toxicology, the determination of the NOAEL and LOAEL, as well as effect and no-effect is based only on approximation. This is due to the fact that research on the dose–response relationship was based on the influence of dose to, among others, tissues, and enzymes. The relationship between the log dose versus the response will form the sigmoid curve, 15 stating that the higher the dose, the more the level of damage. In this model of dose–response relationship, NOAEL for example, it is estimated to be equal to LOAEL/10. 22 There is also an estimation of more than 2% or a maximum of <5% of the control dose. 23
Based on the findings, this study will also provide a solution for some institutions such as for the Center for Drug and Food to determine the safety certification of food. This is due to the fact that there are certified products, but later they turned out to be harmful to health, such as DDT and sodium benzoate in instant noodles.
Determining the NOAEL will make easier to determine a safe toxicant dose for workers/human. This is done by extrapolation through the transfer of dose method. In another scope, the study will be beneficial for developing public health science with an emphasis on the prevention of diseases derived from food, beverage, and air.
Based on the results of this study, it can be concluded that: There was some level of lung tissue damage of white mice in the exposed group, including congestion, edema, infiltration, degeneration, necrosis, fibrosis, and hyperplasia, which was higher than the level of the lung tissue damage of white mice in control group. The number of CD4 expression in lung lymphocyte cells of the white mice was no significantly different between exposed group and control group. The highest dose of ammonia without effect on white mice was 0.0103 mg/kg body weight.
Footnotes
Acknowledgments
The authors would like to thank the Veterinary Laboratory, Faculty of Pharmacy, Airlangga University, for allowing us to do the research. Sincere appreciation is also extended to all staff of the Occupational and Safety Health Department, Faculty of Public Health, Airlangga University. Thanks also to Wulan Meidikayanti, Fatma Tualeka, and Nefri Daika for helping in editing this article.
Declaration of Conflicting Interests
The author(s) declared no potential conflicts of interest with respect to the research, authorship, and/or publication of this article.
Funding
The author(s) disclosed receipt of the following financial support for the research, authorship, and/or publication of this article: The funding was provided by Activity Budget Plans 2012, Faculty of Public Health, Airlangga University, with grant number 46/H3.1.10/KD/2012.