
Abstract
The study aims to test the effect of different sodium valproate (NaVP) doses on small cell lung cancer NCI-H146 cells tumor in chicken embryo chorioallantoic membrane (CAM) model. Xenografts were investigated in the following groups: nontreated control and 5 groups treated with different NaVP doses (2, 3, 4, 6, and 8 mmol/L). Invasion of tumors into CAM in the nontreated group reached 76%. Tumors treated with 8 mmol/L NaVP doses significantly differed in tumor invasion frequency from the control and those treated with 2 mmol/L (P < .01). The calculated probability of 50% tumor noninvasion into CAM was when tumors were treated with 4 mmol/L of NaVP. Number of p53-positive cells in tumors was significantly reduced when treated with NaVP doses from 3 to 8 mmol/L as compared with control; number of EZH2-positive cells in control significantly differed from all NaVP-treated groups. No differences in p53- and EZH2-positive cell numbers were found among 4, 6, and 8 mmol/L NaVP-treated groups. Invaded tumors had an increased N-cadherin and reduced E-cadherin expression. The results indicate the increasing NaVP dose to be able to inhibit tumors progression. Expression of p53 and EZH2 may be promising target markers of therapeutic efficacy evaluation.
Keywords
Introduction
The small cell lung cancer (SCLC) accounts for approximately 15% of lung cancers. 1 The SCLC is an aggressive and deadly lung cancer type, despite the fact that this cancer type is sensitive to initial chemotherapy and radiotherapy. Unfortunately, most patients die of the recurrent disease progression. 2,3 The SCLC is biologically, molecularly, and pathophysiologically very different from other lung cancers 1 and has a poor prognosis: The median survival without treatment is only 2 to 4 months, 4 and chemotherapy treatment increases the survival to 8 to 10 months. 5 Thus, the search for a targeted effective SCLC treatment is an urgent field of lung oncology. 6
The majority of SCLC tumors show neural and endocrine properties. 7 The SCLC cell lines have the malignant characteristics described as the increased proliferation resulting partly from cell cycle dysregulation. 8 The SCLC cells (NCI-H446 line) stably express the mesenchymal stem cell marker vimentin and other stem cell markers indicating their malignant phenotype; also, this cell line expresses neuroectodermal and mesodermal markers. 5
Sodium valproate (NaVP) is the histone deacetylases (HDACs) inhibitor binding the deacetylases catalytic center and causing the histone N-terminal tails hyperacetylation in vitro and in vivo. 9,10 The NaVP increases the apoptotic rate of different SCLC cell lines, including NCI-H146, 11 induces differentiation and cell cycle arrest in different cancer cell lines, and inhibits tumor growth and metastases in animal experiments; therefore, NaVP was proposed to serve as a medicine product for cancer therapy. 10 –13
Specific interactions between tumor cells and host tissues are necessary for tumor growth, tissue invasion, and metastases, and these cancer phenomena are in close relationship with the p53 gene expression observed in cancer cells versus normal cells; p53 mutations can disrupt the normal cell proliferation control or they can induce oncogene activation; the p53 is one of the important markers of tumorigenesis. 14,15 The prognostic value of the altered p53 expression in lung carcinomas is contradictory. 6
The significance of EZH2 as a target marker for the therapeutic efficacy of SCLC treatment is increasing: the EZH2 is functionally active in SCLC tumors, exerts protumorigenic functions in vitro, and is related with methylation profiles of PRC2 target genes in SCLC tumors 8,16 ; EZH2 is involved in cell death and cell cycle control in SCLC tumors by associations with the increased apoptotic activity by upregulating the Puma and Bad2 factors, the elevated p21 protein levels, and the decreased number of cells in the S or G2/M cell cycle phases. 7 The investigation of the EZH2 role in tumorigenesis has been performed using the chicken embryo chorioallantoic membrane (CAM) model to test EZH2 expression changes in relationship with tumor growth, angiogenesis, invasion and metastases of head and neck squamous cell carcinoma, and glioblastoma. 17,18 The CAM model is a useful tool for animal and human tumors or cancer cell transplants 19 –24 for evaluating the response to investigational medicine doses in relationship with the transplanted tumor growth and its invasion.
A membrane-tethered form E-cadherin is a type I transmembrane glycoprotein-mediating adherent junctions among cells and is responsible for maintaining the normal structure of epithelial tissues; it is an epithelial marker important in tumor progression pathogenesis. 25,26 E-Cadherin is the central factor in the epithelial and mesenchymal phenotype transition (EMT) of cancer cells, and E-cadherin is typically expressed on the epithelial cell layers that do not form metastases. 27,28 The EMT process has been shown to potentiate cancer cells migration, invasion, and metastasis, and N-cadherin is a specific protein marker of EMT. 29 Tumor progression is related to reduction in cell–cell adhesion related to important molecular events for the facilitation of cell movement caused by the E-cadherin downregulation and the N-cadherin upregulation. 30
The study was aimed to show whether the treatment with increasing NaVP doses could influence the tumor growth and its invasion incidence into the CAM mesenchyme and the relationship of these changes with the p53 and EZH2 expression in the NCI-H146 cell tumors; also, to investigate different patterns of the epithelial marker E-cadherin and the mesenchymal marker N-cadherin expression in the NCI-H146 cell tumor in relationship with tumor invasion into the CAM mesenchyme. The study results suggest our 3-dimensional (3-D) tumor model to be appropriate for evaluating the NaVP effect in vivo and showing that NCI-H146 cell tumors invading the mesenchyme maintain clinically proven malignant features by expressing the mesenchymal marker N-cadherin.
Materials and Methods
Chorioallantoic Membrane Assay
Fertilized Cobb 500 chicken eggs from a local hatchery were transferred into a hatching incubator (Maino incubators, Oltrona S. M. [Co], Italy) equipped with an automatic humidifier (Maino Enrico, R1569, Como, Italy) and an automatic rotator. The relative air humidity was 60%, and the temperature was 37°C. Eggs were automatically rotated until the third day of embryo development (EDD3). On EDD3, eggs were cleaned with warm 70% ethanol, a small hole at the air chamber was drilled, and approximately 2 mL of albumin was removed to create a false air sac above the CAM. Then a window of approximately 1 cm 2 was drilled, a window in the eggshell was opened and covered with a sterile transparent tape for the further inoculation of tumor cells. The eggs were then returned to the incubator, and the automatic egg rotation was turned off. The eggs were kept in the incubator until harvesting the CAM. The tumor cells were grafted on the seventh day of embryogenesis (EDD7).
Experimental Groups
The following 6 experimental groups were studied for tumor invasion: (1) nontreated control (n = 25), (2) treated with 2 mmol/L of NaVP (n = 17), (3) treated with 3 mmol/L of NaVP (n = 14), (4) treated with 4 mmol/L of NaVP (n = 16), (5) treated with 6 mmol/L of NaVP (n = 14), and (6) treated with 8 mmol/L of NaVP (n = 18).
The visual fields of the tumors on CAM for investigating the p53 immunohistochemical expression in the study groups were as follows: 10 in the nontreated control, 12 in the 2 mmol/L NaVP-treated group, 16 in the 3 mmol/L NaVP-treated group, 12 in the 4 mmol/L NaVP-treated group, 18 in the 6 mmol/L NaVP-treated group, and 14 in the 8 mmol/L NaVP-treated group.
The visual fields of the tumors on CAM for investigating the EZH2 expression in the studied groups were as follows: 12 in the nontreated control, 10 in the 2 mmol/L NaVP-treated group, 12 in the 3 mmol/L NaVP-treated group, 10 in the 4 mmol/L NaVP-treated group, 14 in the 6 mmol/L NaVP-treated group, and 18 in the 8 mmol/L NaVP-treated group. The number of invaded tumors in CAMs for E- and N-cadherin staining was equal to 10.
Cell Culture
The commercial human SCLC NCI-H146 cell line was obtained from the State Research Institute Centre for Innovative Medicine (Vilnius, Lithuania). The H146 cells were placed in 75-cm
2
tissue culture flasks and maintained in the Roswell Park Memorial Institute (RPMI)-1640 medium (Sigma-Aldrich, St. Louis, MO, USA) supplemented with 4.5 g/L of glucose, 2 mmol/L of
Tumor Xenograft Model
The cells with the growing medium were centrifuged leaving only the cell pellet without the supernatant. The amount of 1 × 10 6 H146 cells was resuspended in 10 µL of the serum-free RPMI-1640 medium mixed with NaVP (Sigma-Aldrich; Merck KGaA, Darmstadt, Germany). These cells were mixed with 10 µL of the type I rat tail collagen (Gibco). The final concentrations of the NaVP in the grafted tumor were 2, 3, 4, 6, and 8 mmol/L. A 20-µL portion of liquefied tumor cells was pipetted on an absorbable surgical sponge (Surgispon, Aegis Lifesciences, Gujarat, India) and cut into equal pieces of 9 mm 3 (3 × 3 × 1 mm) to make a solid form. Tumors of the control group (without NaVP) were formed only of H146 cells and the type I rat tail collagen. The formed tumors on the EDD7 were gently placed on a CAM among major blood vessels. The NaVP-treated and control specimens were collected after 5 days of incubation on 12th day of embryo development (EDD12), fixed in a buffered 10% formalin solution for 24 hours, and then paraffin embedded.
Biomicroscopy In Vivo
Eggs with formed tumors were visualized in ovo daily from the second until the fifth day postgrafting (ninth day of embryo development [EDD9]-EDD12) under an Olympus stereomicroscope (SZX2-RFA16; Tokyo, Japan) equipped with an Olympus DP72 camera and photographed using CellSens Dimension 1.9 Digital Imaging Software.
Hematoxylin and Eosin Staining
On EDD12, CAM with the tumors was removed, fixed in 10% neutral-buffered formalin, dehydrated, and embedded into paraffin. Chorioallantoic membranes with tumors were embedded in paraffin and cut into 3 µm sections using an LEICA RM 2155 microtome (Leica Microsystems, Inc, Buffalo Grove, Illinois). A standard hematoxylin and eosin (H&E) staining was performed.
Evaluation of Tumor Invasion into CAM Mesenchyme
Tumor behavior on CAMs in each of the experimental groups (nontreated and treated with different NaVP concentrations) was divided into invasive and noninvasive types: tumors that fully or partly (with chorionic epithelium erosion) invaded the CAMs mesenchyme were considered as invasive, while tumors that stayed on top of the CAM and failed to erode the chorionic epithelium were considered to be noninvasive.
Immunohistochemistry
For immunohistochemistry, tissue samples were placed on Superfrost adhesion histological slides, then the slides were placed 3 times in xylene for 5 minutes at room temperature and then in ethanol of graded series (70%, 80%, and 90%), each for 2 minutes. Then the slides were washed in distilled water for 1 minute 3 times. The epitope retrieval was performed using a high pH epitope retrieval solution (Dako, Glostrup, Denmark) in a pressure cooker (110°C for 3 minutes). The slides were stained using the Thermo Shandon cover plate system (Thermo Fisher Scientific, Inc. Dreieich, Germany). The peroxidase-blocking solution (Dako REAL; Dako) was followed by a tween-20 wash buffer for 10 minutes at room temperature (Dako). Then, the primary antibody solution (1:100) of the mouse monoclonal anti-p53 (aa 211-220, clone240, and CBL404; Millipore, Darmstadt, Germany), rabbit polyclonal anti-KMT6/EZH2 (phospho S21,and ab84989; Abcam, Cambridge, UK), the E-cadherin monoclonal mouse antibody Ab-4 (1:50; clone: NCH-38; NeoMarkers, CA, USA), and the monoclonal mouse anti-human N-cadherin (Clone: 6G11; Dako) were added for incubation. Slides with p53 and N-cadherin were kept at 4°C overnight, and incubation with EZH2 and E-cadherin took 30 minutes at room temperature. Then, the slides were washed with the tween-20 buffer, and the secondary antibody was added (EnVision FLEX + MOUSE (LINKER); Dako), followed by the FLEX/HRP (EnVision FLEX/HRP; Dako), both with incubation for 30 minutes at room temperature. The slides were then washed again with the tween-20, the 3,3′-diaminobenzidine chromogen (Dako) was added, and the slides were washed again. Finally, they were counterstained using the Mayers hematoxylin and mounted using a mounting medium (Roti HistoKit II, Carl Roth GbmH, Germany).
Histomorphometric Analysis
For the visualization and photographing of H&E stained tumors, an Olympus BX40F4 microscope (Olympus Corporation, Tokyo, Japan) and an Olympus XC30 digital camera (Olympus Corporation, Tokyo, Japan) were used. An Olympus BX43F microscope (Olympus, Corporation) equipped with an Olympus DP27 digital camera (Olympus Corporation, Tokyo, Japan) was used to photograph the immunohistochemically stained CAM. A 4× magnification was used for the visualization of H&E stained CAMs, a 20× for the visualization of immunohistochemically stained CAMs, and a 40× magnification was applied to calculate positively stained for p53 and EZH2 cells of the tumors formed on CAM. Nontreated group, 2 mmol/L NaVP-treated group, 3 mmol/L NaVP-treated group, 4 mmol/L NaVP-treated group, 6 mmol/L NaVP-treated group, and 8 mmol/L NaVP-treated group were analyzed. The histomorphometric analysis was performed using the CellSens Dimension 2010 software (version 1.3; Olympus Corporation). Two random 10 000 µm 2 fields were selected in each investigated tumor. All positively stained cells were counted in each field, and the percentage of cells positively stained for EZH2 and p53 were calculated. The data are shown as the percentage of positively stained cells in each group.
Statistical Analysis
Data of EZH2 and p53 stained cells in all investigated groups were expressed as median and range (minimum–maximum), and evaluated as nonparametric data using the GraphPad Prism 6.01 (GraphPad Software, Inc. CA, USA). The Mann-Whitney U test was used to compare these data among all investigated groups. The value of P < .05 was considered statistically significant. Graphical figures were performed using the SPSS version 23.0 (IBM SPSS, Armonk, New York) and Microsoft Excel (Microsoft Office 2016). The data of the tumors according to the frequency of invasion into CAM were calculated using the MedCalc statistical software (MedCalc.Ink) and the Probit regression. The χ 2 test (P < .0001) and the Wald criterion (P < .0001) were the key parameters showing a highly statistically significant suitability for the chosen method of evaluation. The Pearson χ 2 was used to calculate the statistical significance of tumor noninvasion among the investigated groups. The graphical figure for invasion data was done using the MedCalc statistical software.
Results
Macroscopic Evaluation of Tumors on CAM
Figure 1 shows the H146 cell tumor morphology formation dynamic changes on CAM from EDD9 to EDD12 in the study groups. Nontreated H146 cells tend to form regularly shaped tumors starting from the EDD9 (Figure 1). These tumors gradually attract a large number of blood vessels toward the tumor. The formed angiogenic blood vessels are well seen in nontreated tumors (column A) at the EDD12 (they are pointed by arrows). Tumors treated with 2 mmol/L of NaVP formed visible tumors and did not attract such a great number of small-diameter blood vessels as compared with the control, which are considered to be obviously angiogenic; only several blood vessels are seen to be extended toward the tumor (Figure 1B, EDD12, arrows), and several larger blood vessels are present (Figure 1B, EDD12, asterisk). In the 3 mmol/L NaVP-treated group, H146 cells are still able to form a clearly visible tumor but continue to fail attracting new blood vessels at the site of the tumor, only large preexisted blood vessels and some of the smaller diameter reaching the tumor (Figure 1C, EDD12, arrow). In the CAMs with the tumor group treated with 4 mmol/L of NaVP, the further decrease of the amount of blood vessels is noticed (Figure 1D, EDD12). In this group, the white area (Figure 1D, EDD12, asterisk) indicates the disappearance of blood vessels from the tumor as compared with the “nontreated” CAM area surrounding the tumor (Figure 1D, EDD12, quotation mark); moreover, visually a tumor appears larger because it does not penetrate the chorionic epithelium, and the main part of the tumor remains on the surface of the CAM.

Dynamic changes of H146 cell tumor morphology formation on the CAM from EDD9 to EDD12 in the study groups. The view of CAMs with tumors on the EDD9 to EDD11, captured via a window in the eggshell, and the EDD12 tumors on CAMs were photographed after removing them from the egg (bottom view). Scale bar 1 mm. A, CAM with tumors formed of cells in the nontreated group (control), arrows indicate blood vessels. B, CAM with tumors formed of the 2 mmol/L NaVP-treated cells, blood vessels of different diameter are shown by arrows and asterisks. C, CAM with tumors formed of the 3 mmol/L NaVP-treated cells, the arrow indicates a blood vessel. D, CAM with tumors formed of 4 mmol/L NaVP-treated cells, the asterisk and the quotation mark indicate different zones of the CAM around the tumor. E, CAM with tumors formed of the 6 mmol/L NaVP-treated cells, the blood vessel free zone is pointed by an asterisk. F, CAM with tumors formed of 8 mmol/L NaVP-treated cells. CAM indicates chorioallantoic membrane; EDD9, ninth day of embryo development; EDD11, 11th day of embryo development; EDD12, 12th day of embryo development; NaVP, sodium valproate.
In the group of tumors formed by the 6 mmol/L NaVP-treated cells, tumors remained the same in size starting from the EDD9 to the EDD12 and showed no dynamic changes, although the tumor mass looked whitish, likewise those described earlier, and the area around a tumor contained a definitely lower number of blood vessels (Figure 1E, EDD12, asterisk). Upon treating cells with 8 mmol/L of the NaVP, tumors did not attract the CAM blood vessels, and the same preexisting blood vessels were seen on days EDD9 to EDD12 (column F). Cells treated with 8 mmol/L of NaVP formed tumors expanded on the CAM surface with the expressed lowered adhesion to the CAM (see histological results analysis data; Figure 2).
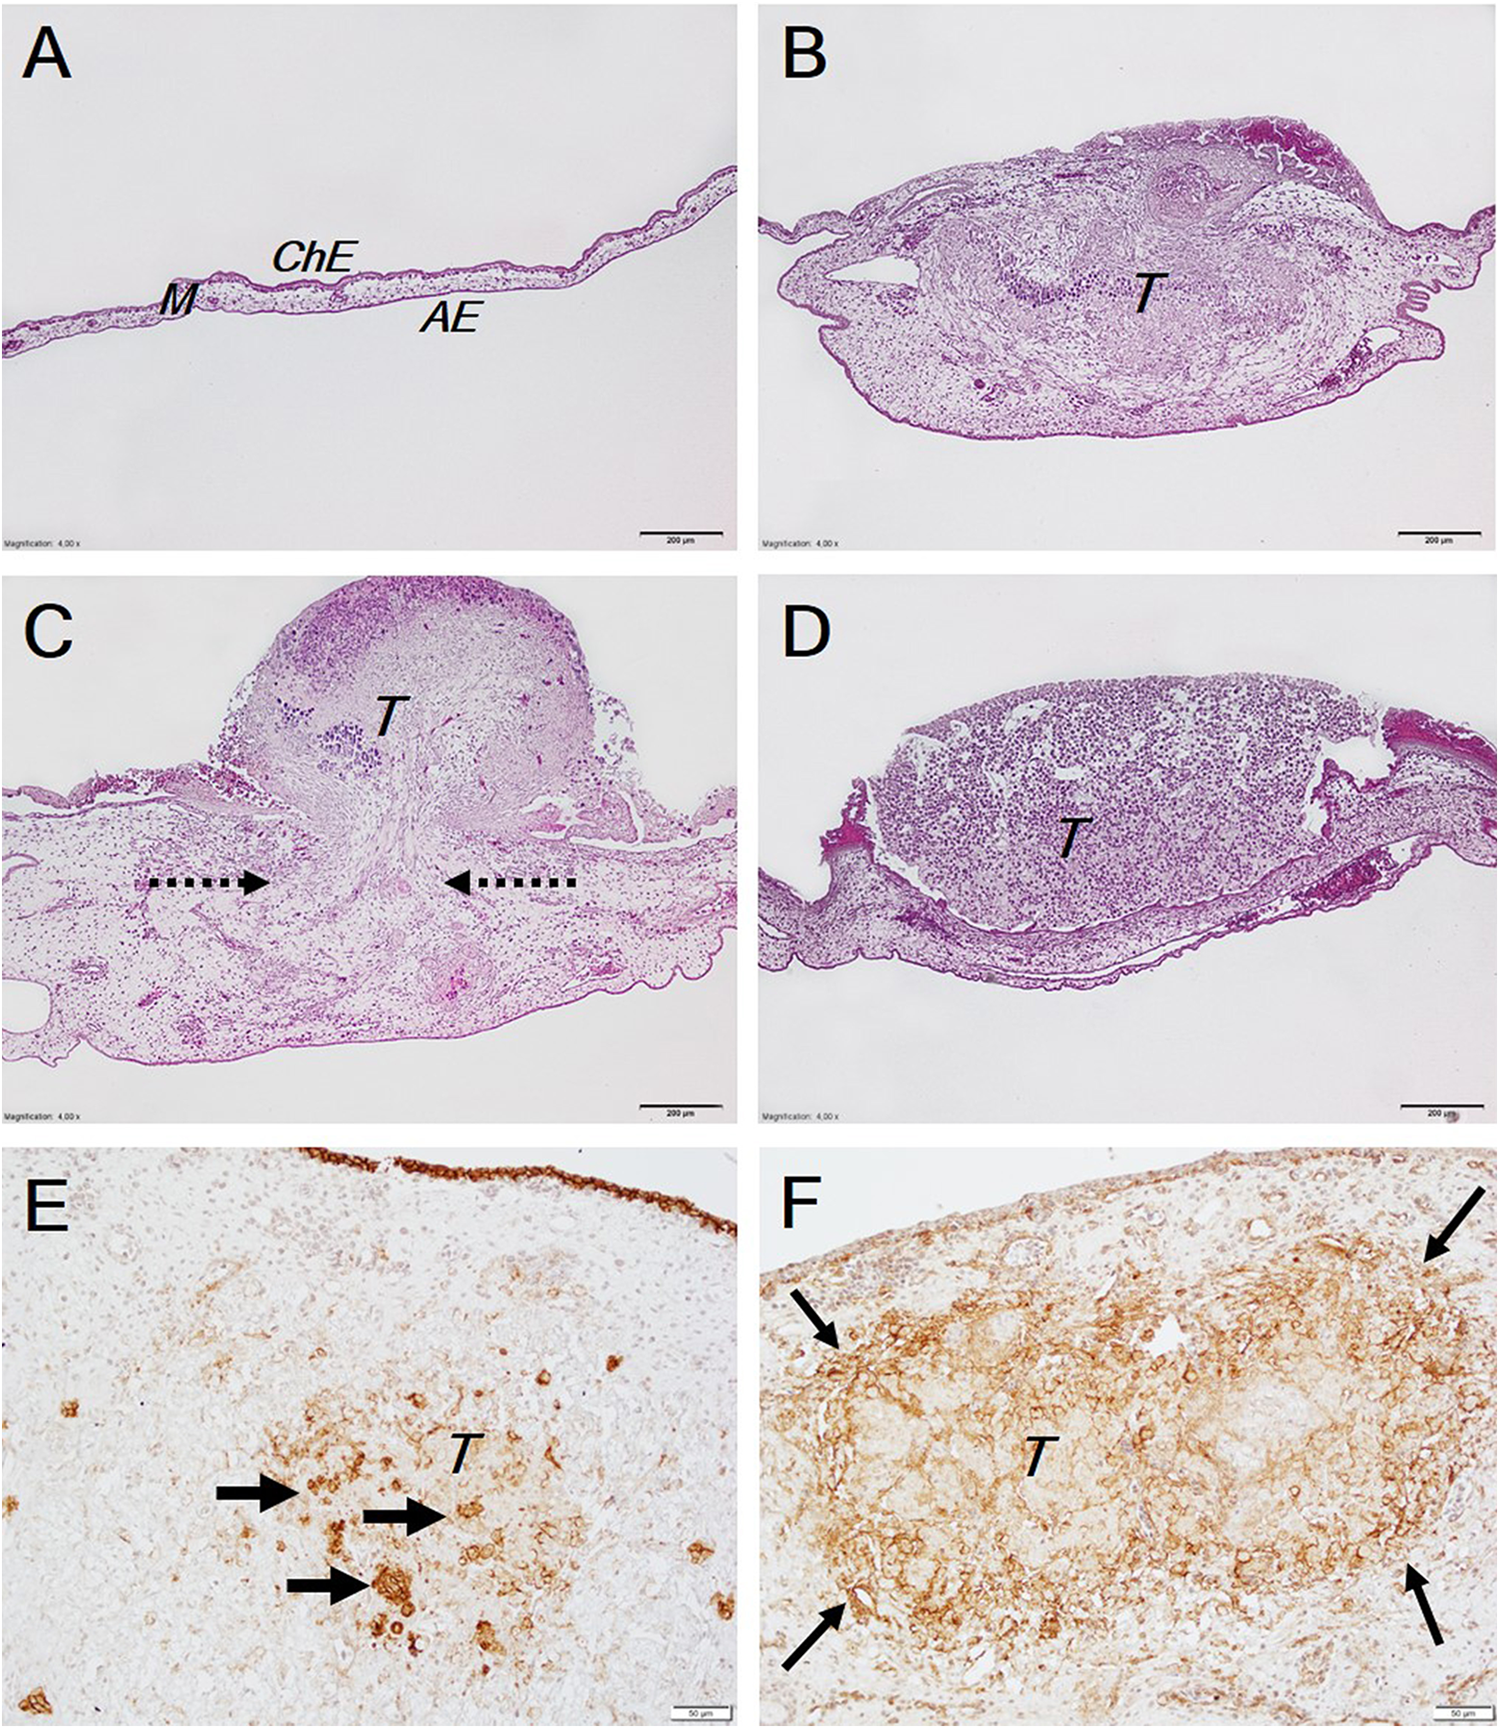
Tumor invasion into the CAM. The A, B, C, and D histological pictures show different views of the CAM: A, intact CAM (control); B, complete tumor invasion into the CAM mesenchyme; C, partial tumor invasion (pointed by arrows) into the CAM mesenchyme through the destroyed chorionic epithelium, the tumor cells also spread along and are seen on the CAM surface; D, noninvaded tumor is present on the concave CAM. The E and F immunohistochemical pictures show the expression of epithelial and mesenchymal markers respectively: E, the E-cadherin expression, positive tumor cells are pointed by arrows, the E-cadherin positive expression in ChE is also seen at the top of the picture as a brown line. F, the N-cadherin expression is seen to be stronger at the edges of the tumor; contrary to E-cadherin, here the N-cadherin is not expressed in ChE of the CAM. Scale bar: A-D, 200 µm and E and F, 50 µm. AE indicates allantoic epithelium; CAM, chorioallantoic membrane; ChE, chorionic epithelium; M, mesenchyme; T, tumors.
NCI-H146 Cell Line Tumor Invasion Into CAM Mesenchyme at Various NaVP Concentrations and Tumor Histological Appearance
The evaluation of tumor invasion (fully invaded and/or with erosion of chorionic epithelium) frequency into the CAM mesenchyme in the investigated groups depending on the used concentration of NaVP in the grafted tumor shows the following frequency: it was 76% in the control group, 76.47% in the group treated with 2 mmol/L of NaVP, 57.14% in the group treated with 3 mmol/L, 50% in the group treated with 4 mmol/L, 42.86% in the group treated with 6 mmol/L, and 16.67% in the group treated with 8 mmol/L. Comparing the invasion frequency of the control with the NaVP-treated groups, a significant difference was found when comparing the control and the 2 mmol/L groups with the 8 mmol/L NaVP-treated group (P < .01). In the other groups, the decreased invasion frequency showed only a tendency; therefore, we have calculated the probability of noninvasion regarding the used different NaVP concentrations in the tumor (Table 1 and Figure 3).
Tumor Noninvasion Probability Depending on NaVP Concentration.

Abbreviations: Max, maximum; Min, minimum; NaVP, sodium valproate.
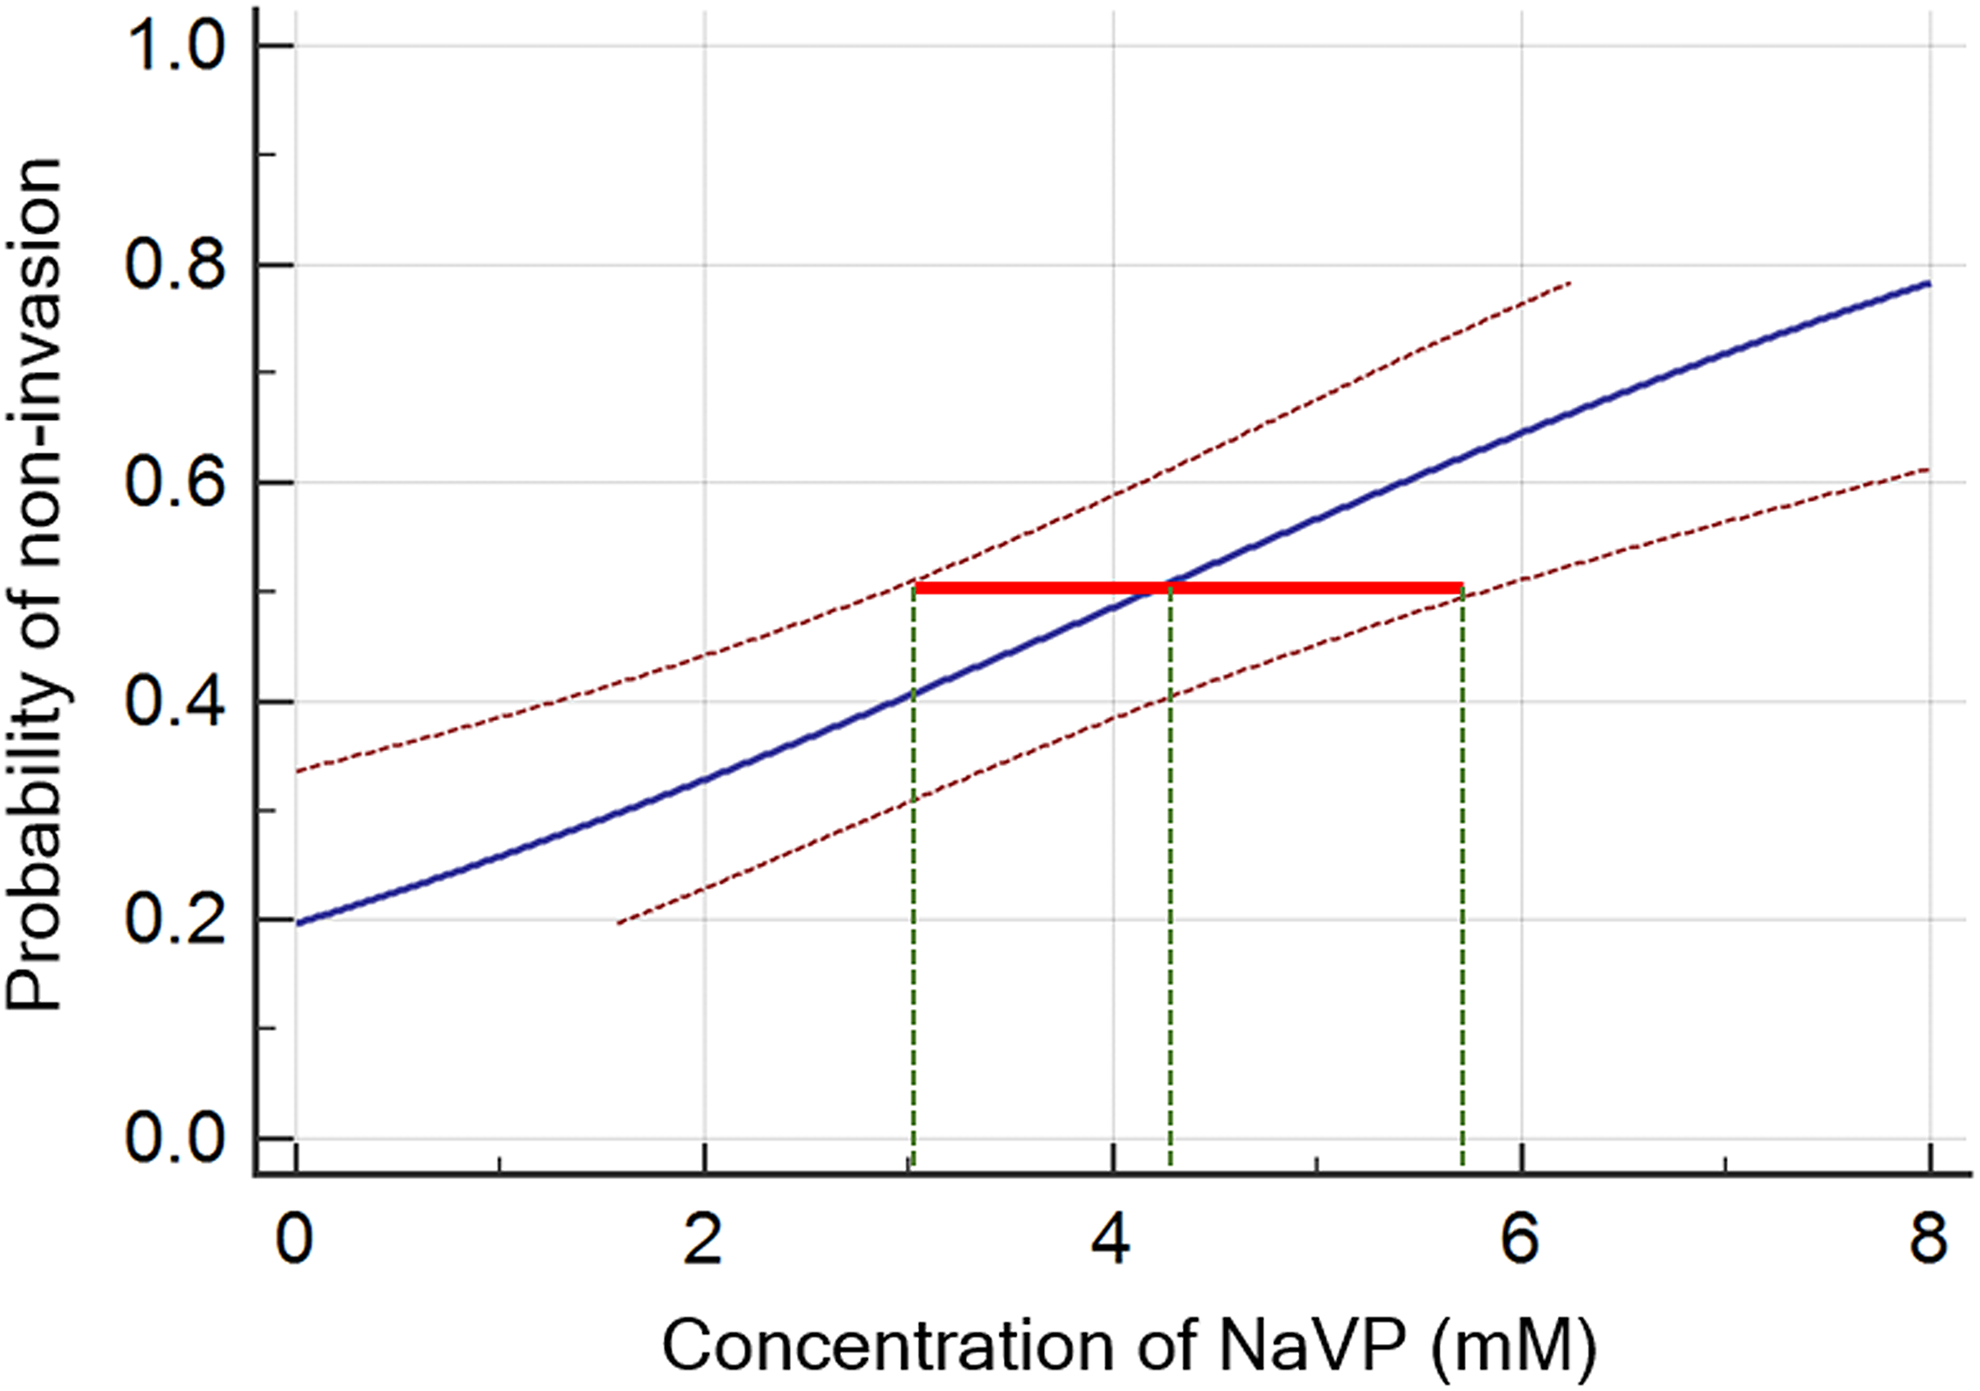
The probability of tumor noninvasion into the CAM. The concentration response analysis for evaluating the probability of tumor noninvasion when using different NaVP concentrations ranging from 2 to 8 mmol/L. A red line indicates the 95% confidence interval (CI) corresponding to the median effective NaVP concentrations (ED50: dashed green line crossing the blue line). CAM indicates chorioallantoic membrane; NaVP, sodium valproate.
The intact control CAM clearly shows all its 3 layers: the topmost layer is the chorionic epithelium (Figure 2A, ChE), the mesenchyme is below it (Figure 2A, M), and the next is the allantoic epithelium (Figure 2A, AE); the intact CAM is thin. In case the tumor invades the CAM, the mesenchyme becomes thicker. Tumors fully invading the CAM occupy almost the entire CAM mesenchyme. The tumor mass (Figure 2B, T) is clearly visible inside the CAM mesenchyme. Another type of tumors partly invades the CAM (Figure 2C) with the majority of the tumor (T) remaining on the top of the CAM. The CAM reacted to the tumor, and a great increase in the CAM thickness was observed. Dashed arrows show the place of tumor invasion via a completely destroyed chorionic epithelium of the CAM. The noninvaded tumor is shown in Figure 2D; this tumor is staying on the CAM, and the chorionic epithelium is well preserved; the CAM thickness is increased as compared with the intact control, and the tumor is seen to be partly surrounded by the CAM. Clear differences were observed comparing invaded tumors stained with E-cadherin (Figure 2E) and N-cadherin (Figure 2F). E-cadherin is more expressed in the middle of the tumor and with various intensity all around the tumor (Figure 2E, thick arrows). An interesting outcome was noticed in the tumors stained with N-cadherin when its expression was seen at the periphery of the invaded tumor (Figure 2F, thin arrows) at the invasive front; the middle area of the tumor (Figure 2F) tends to have a weaker expression of the mesenchymal marker than the periphery.
The Calculated Probability of Tumor Noninvasion Regarding the NaVP Concentration in Treated Tumor Cells
The concentration–response curve with the corresponding NaVP concentrations and their 95% confidence interval (CI) are shown in Figure 3. The calculated values of the NaVP concentrations that correspond to a series of probabilities are shown in Table 1. We have found that ED50 (median effective concentration) is the value corresponding to a probability of .50, and the NaVP concentration about 4 mmol/L is responsible for reducing the NCI-H146 cell tumor penetration into the CAM by 50%, while the 95% CI (Figure 3, red line) for the probability of .5 is ranging from 2.8 to 5.7 mmol/L of the NaVP concentration (Figure 3, green dashed lines, Table 1).
Table 1 presents the calculated theoretically possible concentrations of the NaVP that correspond to the values of tumor noninvasion probabilities ranging from .2 to .95. To reduce tumor invasion by 80%, the 8.28 mmol/L NaVP concentration is needed (95% CI: 6.4-12.8 mmol/L). The highest NaVP concentration used in our experiments was 8 mmol/L and it decreased the tumor invasion almost by 80%. The theoretically calculated NaVP concentrations that are beyond our investigation are shown by shaded lines.
Immunohistochemical Investigation
The p53 Expression in NCI-H146 Cell Line Tumor in Response to Different NaVP Concentrations
The number of p53-positive cells of the study groups was found to depend on the NaVP concentration used for treating tumor cells. The median and range (minimum–maximum) number of positively stained cells in the nontreated group was 50% (7%-75%), 34.4% (16.6%-48.7%) in the 2 mmol/L NaVP-treated group, 18% (6%-28%) in the 3 mm NaVP-treated group, 15.5% (1%-62%) in the 4 mmol/L NaVP-treated group, 5.9% (0%-63.6%) in the 6 mmol/L NaVP-treated group, 3.5% (0%-26%; Figure 4A) and in the 8 mmol/L NaVP-treated group.

The number of p53-positive cells in NCI-H146 cell line tumors treated with different NaVP concentrations. The graphical image (A) represents the effect of different NaVP concentrations on the expression of mutant p53 in NCI-H146 formed tumors on CAM. The outliers in the graph indicate the highest points in the number of positively stained p53 cells in 4, 6, and 8 of NaVP-treated groups (A). Numerous blood vessels (long arrows, B) of CAM origin filled with chick embryos erythrocytes are seen in the nontreated group unlike in the 6 mmol/L NaVP-treated group. The p53 positively stained tumor cells (arrowheads, B) and blood vessels (long arrows, B) are shown in the nontreated group. The p53 positively stained tumor cells in the 6 mmol/L NaVP-treated group are indicated by arrowheads (C). The median and range values tested in all investigated groups are shown in Figure 4A. Scale bar 20 µm. CAM indicates chorioallantoic membrane; NaVP, sodium valproate.
The significant P values comparing the number of p53-positive cells and the nontreated tumors with those treated with different NaVP concentrations are shown in Figure 4A. No difference was established in the 2 mmol/L NaVP-treated group as compared with the control (nontreated group), and no significant difference in the number of p53-positive cells was found among the 4, 6, and 8 mmol/L NaVP-treated groups.
The differences in the immunohistochemical expression of p53 in nontreated and 6 mmol/L NaVP-treated groups are clearly seen (Figure 4B and 4C, respectively). The arrangement of positive cells is seen as scattered clusters throughout all tumor area as well as around blood vessels (Figure 4B, arrows). The nuclei of the tumor cells in the nontreated group were relatively big and stained intensively (Figure 4B, arrowheads), while in the 6 mmol/L NaVP-treated group, only very few cells are seen to be stained positively with a reduced intensity of staining (Figure 4C, arrowheads); blood vessels are not present in the tumor, indicating that the treatment inhibited the development and attraction of blood vessels.
EZH2 Expression in NCI-H146 Cell Line Tumor in Response to Different Concentration of NaVP Treatment
A high EZH2 expression was observed in the nontreated group: the median number of positively stained cells was 87.21% (ranging within 46%-97.1%). We observed a significant diminishing of the EZH2 positively stained cell numbers in all NaVP-treated groups compared with the nontreated group (Figure 5).

The number of EZH2-positive cells in NCI-H146 cell line tumors treated with different NaVP concentrations. The graphical image (A) represents the effect of different NaVP concentrations on the expression of EZH2 in NCI-H146 tumors formed on CAM. Tumors on CAM of the nontreated and 6 mmol/L NaVP-treated groups are shown in (B) and (C). Numerous blood vessels (long arrows, B) are seen in the nontreated group unlike in the 6 mmol/L NaVP-treated group (C). EZH2 positively stained tumor cells (arrowheads, B) are shown in the nontreated group, and in the 6 mmol/L NaVP-treated group, they are indicated by arrowheads (C). The median and range values in all investigated groups are shown (A). Scale bar 20 µm. CAM indicates chorioallantoic membrane; NaVP, sodium valproate.
The number of EZH2-positive cells in the nontreated group significantly differs (P < .005) as compared with the 2 mmol/L NaVP-treated group (median 51.42, range 39.1%-80%); as described earlier, the number of p53-positive cells does not differ significantly between the nontreated and the 2 mmol/L NaVP-treated groups. This may indicate that the EZH2 marker may be more sensitive than the p53 index in the tested tumors. Comparing the nontreated group with the rest of the study groups (3, 4, 6, and 8 mmol/L of NaVP-treated groups), a high statistical significance was noticed. The number of EZH2-positive cells in the 3 mmol/L NaVP-treated group (median 41.22% [4.8%-90.6%]) was found to be significantly different from the nontreated group (P = .0009), the median was 29.11% (1.4%-47%) in the 4 mmol/L NaVP-treated group, 10.96% (1.5%-67.5%) in the 6 mmol/L group, and 21.13% (1.7%-33.3%) in the 8 mmol/L group. The NaVP-treated groups differed significantly from the nontreated group (P < .0001).
The significant P values comparing the number of EZH2-positive cells in the nontreated tumors and those treated with different NaVP concentrations are shown in Figure 5A.
High amounts of positively stained EZH2 cells (Figure 5B, arrowheads) are expressed in the nontreated group with a blood vessel in the tumor (Figure 5B, long arrow), and groups of EZH2-positive tumor cells were found to be positioned throughout the tumor, while in the 6 mmol/L NaVP-treated group, these cells failed to make specific arrangements of positively stained cells; single positively stained cells are seen in the tumor (Figure 5C, arrowheads) with absent blood vessels.
Discussion
The SCLC is characterized by an aggressive, rapid tumor growth with active neoangiogenesis and with frequent early incidences of distal metastatic dissemination at the time of diagnosis; the SCLC 5-year survival is 7%. 31 –33 All patients with SCLC are former smokers, and the histology of the nonmalignant respiratory epithelium and SCLC-related tissue have a tobacco-damaged features. 34,35 The SCLC is a high-grade neuroendocrine tumor differing from all other lung cancers because its manifestation is characterized by several paraneoplastic syndromes. 1,36 The SCLC has a poor prognosis, and patients with the survival of 2 and more years are at a significantly higher risk of a second primary tumor development. 37
The SCLC initial response to chemotherapy is frequent; however, the recurrence of cancer and its multidrug resistance are very frequent. 31 Understanding the mechanisms of treatment resistance and finding new agents for the SCLC therapy require new experimental approaches.
The majority of tested preclinically promising anticancer agents fail in the efficacy of clinical trials. Therefore, there is a need to develop, improve, and evaluate new experimental preclinical models for identifying and testing investigational therapeutics by validating molecular cancer biomarkers predicting response to targeted SCLC therapies. 1
We show the pharmacological effect of different NaVP doses in the formed NCI-H146 cell tumor growth on the CAM and the NaVP dose that acts most efficiently on tumor invasion into the CAM mesenchyme in relationship with the changed expression of p53 and EZH2 markers. Our experimental method is based on tumor cells instantly mixed with NaVP in the 3-D tumor model and then grafted onto the CAM. Such method allows a quick and reliable daily observation of the NaVP effect on tumors. It is worth noting that most of mice models are inadequate for such investigation because tumor cells are injected into the connective tissue and mechanically bypass the basement membrane of the surface epithelium—the first barrier for tumor invasion. 17 In contrast with mouse models, the CAM uppermost chorionic epithelium layer is the first barrier for the tumor cells. 17 There is only a single study that has investigated the human SCLC cell tumor xenograft on CAM. 3 Compared with mammalian models where grafted tumor growth often occurs in 3 to 6 weeks, assays using the CAM are faster: It takes up to 2 to 5 days after tumor cell inoculation for tumor xenografts to become visible and contain neoangiogenetically developed vessels of the CAM origin. 38,39 The CAM model is immunodeficient during embryonic development up to 19 days; thus, the CAM model may be used to evaluate tumor growth, its neoangiogenesis, invasion, metastases, and their response to investigational medicine, as well as to screen the effective doses of anticancer drugs. 24 However, the CAM model limitations are that it does not allow investigating the pharmacokinetics, bioavailability, and safety of medicinal products.
Sodium Valproate Effect on NCI-H146 Cell Tumor Progression on the CAM
Our data show the different effects of different NaVP concentrations on the NCI-H146 cell tumor dynamics on CAM, tumor ability to attach to the CAM, to destroy the chorionic epithelium, and to invade the CAM mesenchyme. The tumors treated with 8 mmol/L doses of NaVP significantly differed in tumor invasion frequency from the control tumors and those treated with 2 mmol/L of NaVP; the 6 mmol/L and 8 mmol/L NaVP-treated tumors more frequently failed to invade the CAM mesenchyme, and not invaded tumors were more spread on the CAM surface. The results of theoretical probability calculation of the effect of NaVP on the tumor invasion indicate that 4 mmol/L of NaVP is enough to reduce the NCI-H146 cell tumor invasion frequency by 50%, and the 8 mmol/L concentration reduces it by 80%.
Sodium valproate is an inhibitor of HDAC and has anticancer properties with a notable effect on cell migration and invasion for both normal and malignant cells, and the treatment with HDAC inhibitors upregulates the metastasis suppressor genes and downregulates the metastasis activating genes in vitro and in vivo. 40 –42 Sodium valproate has been reported to inhibit tumor growth of different cancers. It significantly inhibits the growth and induces the apoptosis of different glioblastoma cell lines depending on the used doses 43 ; the 8 mmol/L NaVP dose in the U-87 cells tumor on CAM reduced tumor invasion by 90% 18 ; NaVP concentrations of 1 to 3 mmol/L induced cell differentiation and apoptosis of poorly differentiated thyroid cancer cells 43,44 ; NaVP inhibited prostate cancer cell migration by upregulating the E-cadherin expression 45 ; and the 5 to 10 mmol/L NaVP concentrations significantly induced the expression of the tumor suppressor gene IRF-3 in cancer cells, inhibiting non-small lung cancer cell growth. 46 Sodium valproate might markedly increase the sensitivity of lung adenocarcinoma cells resistant to erlotinib, thus strengthening NaVP as a potential medicine for resistant cancer therapy. 47
E- and N-Cadherin Expression in the Invaded Tumors
The expression of mesenchymal marker N-cadherin in the tumor is known to be related with tumor progression as potentiating reduced cell–cell adhesion, increasing the migration and invasion of tumor cells. 29,30 It is known that in epithelial cells, the loss of E-cadherin and the increase in N-cadherin expression mean that the tumor cells have been converted into a metastatic phenotype. 48 Our immunohistochemical data on the NCI-H146 tumors invading the CAM mesenchyme show epithelial and mesenchymal properties as they express N- and E-cadherins; the invaded tumors were strongly expressing the mesenchymal marker N-cadherin, which appeared to be more expressed at the periphery of the invasive front of the tumor, while the middle part of the tumor stayed lightly stained and expressed only a moderate amount of N-cadherin positive NCI-H146 cells. In contrast, the epithelial marker E-cadherin expression was seen in the middle part of the invaded tumor where the expression of N-cadherin was weaker. Other researchers indicate that various tumors and tumor cell lines with a reduced expression of E-cadherin are associated with tumor progression and enhanced cell invasiveness. 49 –53
The Expression of p53-Positive Cells in NCI-H146 Cell Tumors on the CAM
Our study shows the decreased number of p53-positive cells in the studied tumor groups to be directly dependent on the NaVP concentration used for the grafted tumor treatment. Compared with the control, the number of p53-positive cells in our investigation was significantly reduced in the 3 mmol/L NaVP-treated group, and in other groups treated with higher NaVP doses, the 6 mmol/L NaVP-treated group tumors showed the highest reduction of p53-positive cells. The recent publication of the NaVP effect on the glioblastoma U-87 cell line tumor on CAM has reported the half-inhibitory effect on mutant-p53 expression in tumors treated with 4 mmol/L of NaVP. 18 The hallmark SCLC genetic lesions including TP53 mutation and RB1 inactivation are present in all subtypes 54,55 with TP53 being more common (94.3%). 55 TP53 and RB1 are among the limited numbers of genes that are recurrently mutated in SCLC. 48 –50,56 The p53 genetic alterations have been shown by immunohistochemistry in SCLC up to 70% to 100% and approximately 50% in non-SCLC. 51 –53 In mice, the functional inactivation of TP53 together with RB1 is sufficient for the development of SCLC. 57,58 Stratifying clinical cases by stage, 35.7% of TP53 mutations in the early-stage disease and 54.1% of mutations in the SCLC late-stage disease were found. 59
EZH2 Expression in the NCI-H146 Cell Tumors and the NaVP Effect
In our study, a high EZH2 expression was observed in the nontreated tumor group: The median number of positively stained cells was 87.21%. Comparing the nontreated group and all NaVP-treated groups, we observed a significant diminishing NaVP treatment effect on the EZH2-positive cell number, and this effect decreased with an increased NaVP concentration in the groups; thus, NaVP decreases the EZH2-mediated cancer cell invasion.
EZH2 is overexpressed in various cancers with a poor prognosis, among them the SCLC. 7,8,42,54,60 EZH2, the chromatin modifier, was among the most significantly overexpressed genes in SCLC; it was found to be more than 12 times higher expressed than in the normal lung tissue. 54 In the SCLC, EZH2 overexpression is related to cancer progression via related pathogenetic mechanisms as an increased cell proliferation, apoptosis suppression (via apoptosis signal-regulating kinase 1 (ASK1) or known as MAP3K5 (mitogen-activated protein kinase) and the transforming growth factor-β-SMAD pathway related to the suppression of achaete-scute homolog 1 gene (ASCL1) expression, and the suppression of SLFN11 (Schlafen family member 11) inducing resistance to chemotherapy. 7,60 –63 It was shown that the EZH2 expression in H146 cell line was similar to that in other SCLC cell lines. 60 The knockdown of EZH2 inhibited the progression of SCLC. 64 The EZH2 plays a major role in SCLC pathophysiology and becomes a targeted EZH2 marker with the priority in the SCLC therapy evaluation. 65,66 Notably, the polycomb group protein EZH2 is a target of HDAC inhibitors. It has been proved that the EZH2-mediated cell invasion requires HDAC activity, and HDAC inhibitors decrease the EZH2-mediated cancer cell invasion. 42
Conclusions
The tested NCI-H146 cell tumors invading the CAM mesenchyme show malignant phenotype features: the highly expressed N-cadherin at the periphery of the invasive front of the tumor, while its middle part shows the moderate amount of E-cadherin, as well as the EZH2 and p53 expression. Sodium valproate reduces the invasive capacity and the number of p53- and EZH2-positive cells in SCLC tumors as compared with the nontreated group. The NaVP effect on tumor progression depends on the NaVP concentration used for the treatment of tumor cells.
Footnotes
Declaration of Conflicting Interests
The author(s) declared no potential conflicts of interest with respect to the research, authorship, and/or publication of this article.
Funding
The author(s) disclosed receipt of the following financial support for the research, authorship, and/or publication of this article: The present study was partially funded by research fund of the Lithuanian University of Health Sciences (Grant no. V-1238).