
Abstract

Response to Criticism by CPS II Investigators
Drs C. Arden Pope III (Pope), Daniel Krewski (Krewski), Susan M. Gapstur (Gapstur), Michelle C. Turner (Turner), Michael Jerrett (Jerrett), and Richard T. Burnett (Burnett), 1 as well as Gapstur and Otis W. Brawley (Brawley) 2 strongly criticized my Dose-Response article, Enstrom, 3 but they did not identify a single error, particularly regarding my findings of no relationship between fine particulate matter (PM2.5) and total (all-cause) mortality. Thus, my peer-reviewed findings showing no PM2.5-related deaths during 1982 to 1988 in the 1982 American Cancer Society (ACS) Cancer Prevention Study (CPS II) cohort stand unchallenged. In particular, my null findings indicate that the positive findings in 3 seminal publications by these investigators: Pope 4 and Health Effects Institute, HEI (2000) 5 and HEI (2009), 6 are not robust and not supportive of the claim that PM2.5 causes premature deaths. Instead of assessing the validity of my findings, these investigators focused on other aspects of their many analyses of CPS II data.
Their “Expanded Analyses of the ACS CPS-II Cohort” section inaccurately questions the validity of my findings: “The assertion regarding selective use of the CPS-II and PM2.5 data is false.” I published prima facie evidence that their 1982 to 1989 PM2.5 mortality findings were indeed sensitive to selective use of PM2.5 and CPS II data. My evidence can be easily checked with minor modifications to the SAS programs that they used to calculate the findings in Table 34 of HEI (2009). 6 Instead of confirming or refuting my evidence, these investigators reiterated their various published analyses of PM2.5 deaths in CPS II, as summarized in their Table 1 and their Figure 1. All of their analyses could be just as sensitive to selective use of PM2.5 and CPS II data as the results in Pope, 4 HEI (2000), 5 and HEI (2009). 6

Abbreviations: ACS, American Cancer Society; HEI, Health Effects Institute; IPN, Inhalable Particulate Network; PM, particulate matter.
aEach location includes State, primary ACS Division-Unit number and an indication of additional numbers, Federal Information Processing Standards (FIPS) code, IPN/HEI county, IPN/HEI city with PM2.5 measurements, 1979-1983 IPN-weighted average PM2.5 level, 1979-1983 HEIDC [PM2.5 (DC)] weighted average PM2.5 level, 1979-1983 HEI [PM2.5 (OI, MD)] median PM2.5 level, 1980 age-adjusted white county total death rate (annual deaths per 100 000), and HEI (2000) Figure 5 Mortality risk for HEI city (metropolitan area). All 85 counties have IPN PM2.5 data, 58 counties have HEIDC PM2.5 data, and 50 counties have HEI PM2.5 data. However, 3 cities used in HEI, (2000) 5 (Raleigh, North Carolina; Allentown, Pennsylvania; and Huntington, West Virginia) were not part of IPN and origin of the HEI PM2.5 data in HEI (2000) 5 Appendix D for these 3 cities (indicated with superscript letter “b”) is unknown. As an approximation, the Raleigh NC PM2.5 value has been assigned to Durham, North Carolina; the Allentown, Pennsylvania, PM2.5 value to Pittsburgh, Pennsylvania, and the Huntington, West Virginia, PM2.5 value to wheeling West Virginia.
Their “Deficiencies in Enstrom’s Reanalysis” section does not identify a single error in my findings and suggests that they did not examine the data and findings in my article. For instance, they state, “In contrast, Enstrom 8 asserts that he estimates smaller PM2.5-mortality associations because he uses the ‘best’ PM2.5 data. He provides no evidence in support of this assertion nor does he provide any measures of the relative quality of models using alternative PM2.5 data.” Strong evidence supporting my assertion is clearly presented in Tables 2 and 3 of my article and is described in the “Results” section on page 4. Then, they state, “It is not clear how or why his ‘IPN’ PM2.5 data differ from the ‘HEI’ PM2.5 data—especially given that these data come from the same monitoring network.” The differences between the Inhalable Particulate Network (IPN) PM2.5 and HEI PM2.5 data are clearly shown in my Appendix Table A1 and discussed in the “Conclusion” section on page 6. To make sure that these differences are fully recognized and understood, an expanded version of Appendix Table A1 is shown in Table 1.
Their “Broader Evidence” section is not relevant to the validity of my findings and diverts attention away from my challenge to the PM2.5 death findings in Pope, 4 HEI (2000), 5 and HEI (2009). 6 Their last paragraph contains the following inaccurate statement: “But the study by Enstrom does not contribute to the larger body of evidence on the health effects of PM2.5…” In conclusion, the authors have not assessed the validity of my peer-reviewed evidence of no relationship between PM2.5 and total mortality in the CPS II cohort and have not been willing to engage with me in addressing the substantive points of my findings.
Response to Criticism by ACS Officials
The ACS Vice President of Epidemiology Susan M. Gapstur and ACS Executive Vice President and Chief Medical Officer Otis W. Brawley have not assessed the validity of my peer-reviewed findings that challenge the validity of 3 seminal CPS II-based publications: Pope, 4 HEI (2000), 5 and HEI (2009) 6 . They can easily check the accuracy of the results in Tables 1 to 3 of Enstrom 3 and they can determine whether I have correctly identified 85 counties using the ACS Division-Unit numbers shown in Appendix Table A1. Instead, they have made statements about my article like, “we cannot confirm the data are from the CPS-II cohort” and “we cannot substantiate the claim that we provided funding for the preparation of the computerized files and documentation for this research.”
I want to address the statements that ACS officials Gapstur and Brawley made about my article. In my acknowledgments, I have never stated or implied that the current ACS endorsed or participated in my article or my use of CPS II data, because they did not endorse or participate. However, former ACS staff made it possible for me to obtain access to individual level data on both CPS I and CPS II participants, as I stated in my article. I received ACS external research support during the period 1973 to 1994. None of this ACS external research support was used for this article. However, ACS internal research support paid for all aspects of the 1982 to 1988 CPS II data that I possess: 1982 questionnaire data collection, 1982 to 1988 mortality follow-up, preparation of computer files, and preparation of detailed documentation.
The genuine version of the 1982 to 1988 CPS II data and detailed documentation that I possess did not come from the current ACS. My version was prepared by ACS many years ago, and I obtained it from a source with appropriate access to an authorized copy of this version. I have confirmed the validity of this version by showing that (1) the numbers of participants by ACS Division agree almost exactly with the numbers shown in the Fall 1984 CPS II Newsletter (Volume 2, Number 2) Table “Final Numbers of Researchers and Participants by Division”; (2) Table 1 of Enstrom 3 has age at enrollment, sex, race, and education distributions of CPS II participants that agree almost precisely with the same distributions shown in Pope 4 and HEI (2000) 5 ; and (3) the CPS II data file information on the participants that I personally enrolled in CPS II agrees with the data that I submitted to ACS in 1982. The ACS epidemiologists can confirm the version of the CPS II data used in my article by confirming my findings in Tables 1 to 3 and Appendix Table A1. 3
They claim that “when classified using the Division and Unit numbers, the geographically-defined exposure measure will be highly inaccurate for some participants.” Actually, the Division-Unit number accurately identifies the county of residence for most CPS II participants. For instance, ACS Division 39 represents the state of Ohio, and its Unit 041 represents Jefferson County, which includes the city of Steubenville, where the PM2.5 measurements were made. Based on information I have obtained, at least 90% of the 575 CPS II participants in Unit 041 lived in Jefferson County as of September 1, 1982, and ACS can confirm this. In addition, ACS can confirm the detailed information that I have shown in Table 2, regarding the 575 CPS II participants in ACS Unit 041 of ACS Division 39. Table 2 shows the number of researchers, families, participants, and confirmed 1982 to 1988 deaths for the 6 ACS groups within ACS Unit 041. In addition, Table 2 shows these same numbers for each of the 6 researchers in ACS group 1. Thus, as of now, all of the findings in Enstrom 3 stand unchallenged. The ACS has not produced any evidence that invalidates my CPS II cohort findings.
ACS CPS II Cohort Participants in Unit 41 (Jefferson County) of Division 39 (Ohio) Showing the Number of Researchers, Families, Participants, and Confirmed 1982 to 1988 Deaths for Each Group and for Each Researcher in Group 1.
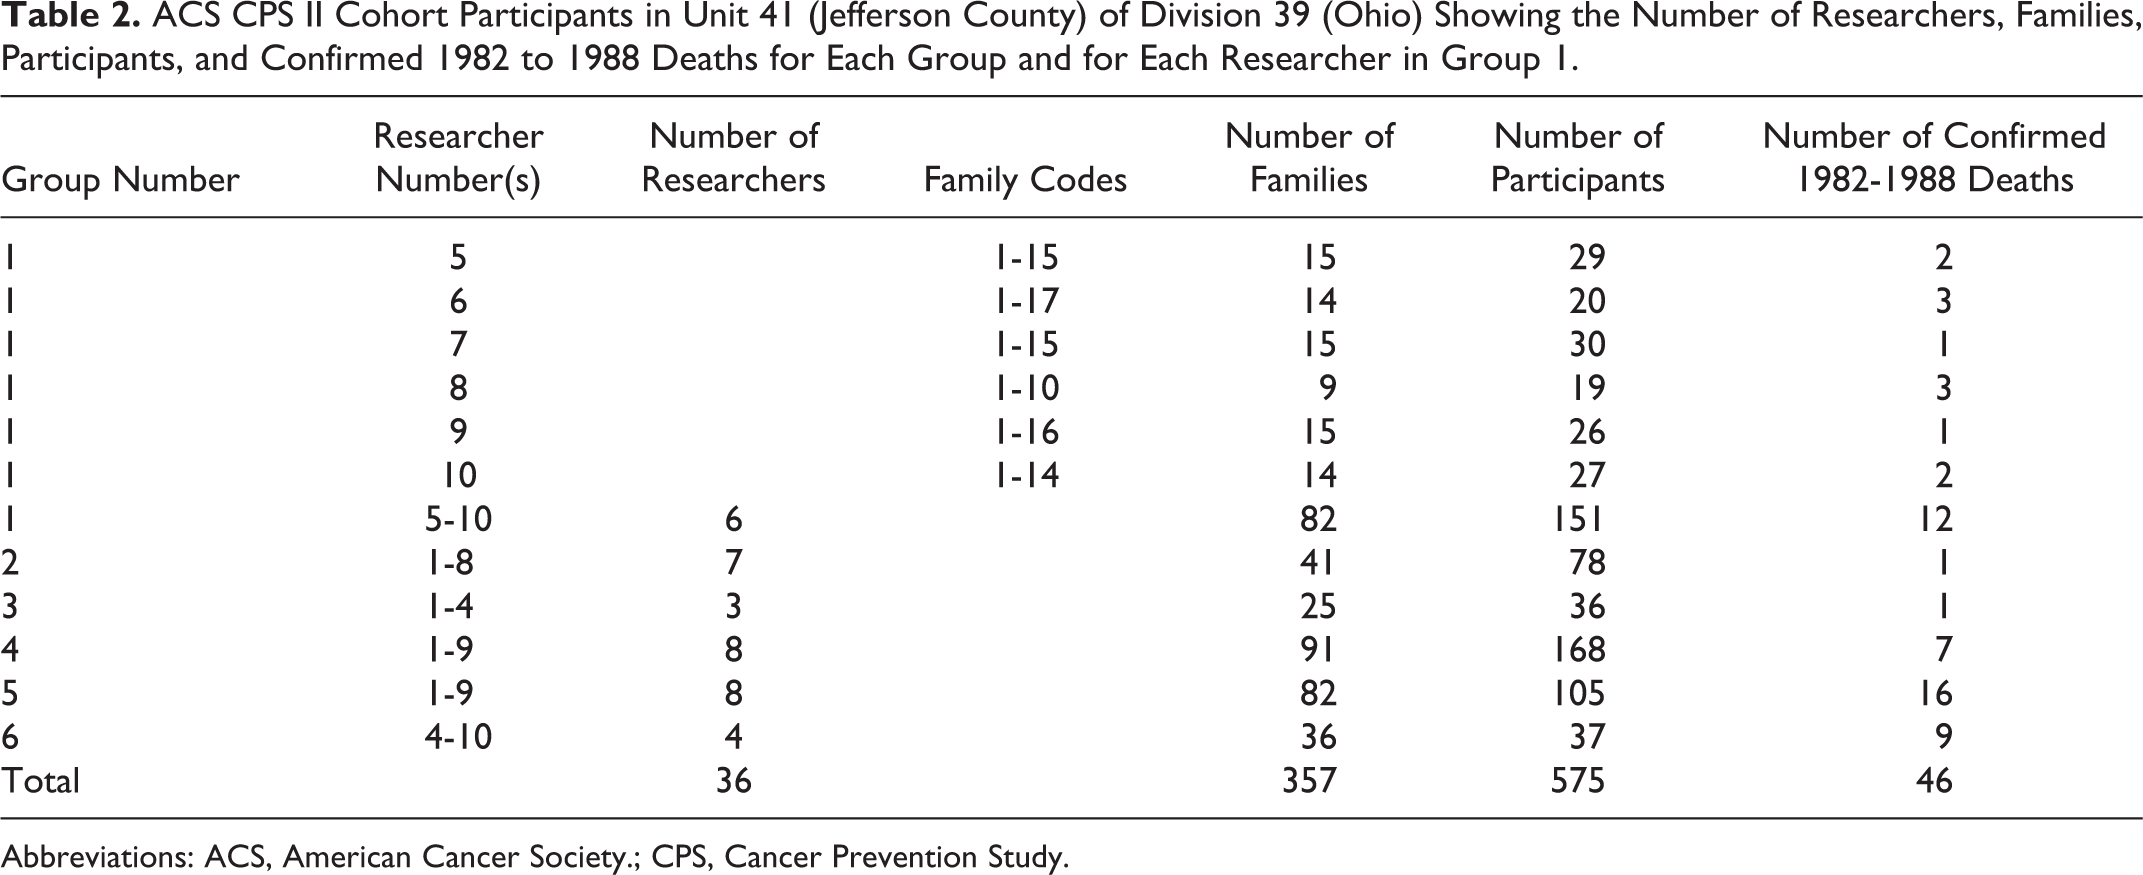
Abbreviations: ACS, American Cancer Society.; CPS, Cancer Prevention Study.
Additional Evidence of No PM2.5 Deaths in CPS II
Since the above investigators criticized my article and did not assess my null findings, I searched their 3 seminal publications for more evidence that supports my null findings. I found evidence in HEI (2000) 5 that I had not previously recognized. Table 29 and Appendix D in HEI (2000) 5 describe 2 key sets of 1979 to 1983 PM2.5 measurements: (1) PM2.5 (OI MD), which is “median fine particle mass from Original Investigators” for 50 cities and designated by me as HEI PM2.5 and (2) PM2.5 (DC), which is “mean fine particle fraction from dichotomous sampler” values for 58 IPN cities and designated by me as HEIDC PM2.5. The PM2.5 (OI MD) values are the ones used in Pope. 4 I now realize that most of the HEIDC PM2.5 [PM2.5 (DC)] values are the same to 1 decimal point as the IPN PM2.5 values in Enstrom. 3
Table 1 shows that the IPN PM2.5 and HEIDC PM2.5 are identical for 45 cities and somewhat different for 13 cities in HEI (2000) 5 Appendix D. Three cities with PM2.5 (OI MD) values (Raleigh, North Carolina; Allentown, Pennsylvania; and Huntington, West Virginia) were not part of IPN and it is not clear how the PM2.5 values for these 3 cities were measured. As an approximation, the Raleigh NC PM2.5 value has been assigned to Durham, North Carolina, and the Allentown, Pennsylvania, PM2.5 value has been assigned to Pittsburgh, Pennsylvania, and the Huntington, West Virginia, PM2.5 value has been assigned to Wheeling, West Virginia. Two cities in HEI (2000) 5 Appendix D (Boston, Massachusetts and St Louis, Missouri) were not used because of unclear ACS Division-Unit numbers. Table 1 is an expanded version of Appendix Table A1 in Enstrom. 3 Table 3 shows relative risks (RRs) based on IPN PM2.5, HEIDC PM2.5, and HEI PM2.5 values for 85, 58, 50, and 47 cities/counties. The RRs based on the HEIDC PM2.5 values are essentially identical to the null RRs based on the IPN PM2.5 values. Only the RRs based on HEI PM2.5 values are significantly positive, as shown in Enstrom. 3 I find it surprising that the null RRs based on the HEIDC PM2.5 values were not included in HEI (2000) 5 or HEI (2009). 6
Fully Adjusted Relative Risk (RR) of Death From All Causes (RR and 95% CI) From September 1, 1982, Through August 31, 1988, Associated With Change of 10 µg/m3 Increase in PM2.5 for CPS II Participants Residing in 47 to 85 Counties in the Continental United States With 1979-1983 IPN PM2.5, HEIDC PM2.5, and HEI PM2.5 Measurements.a,b
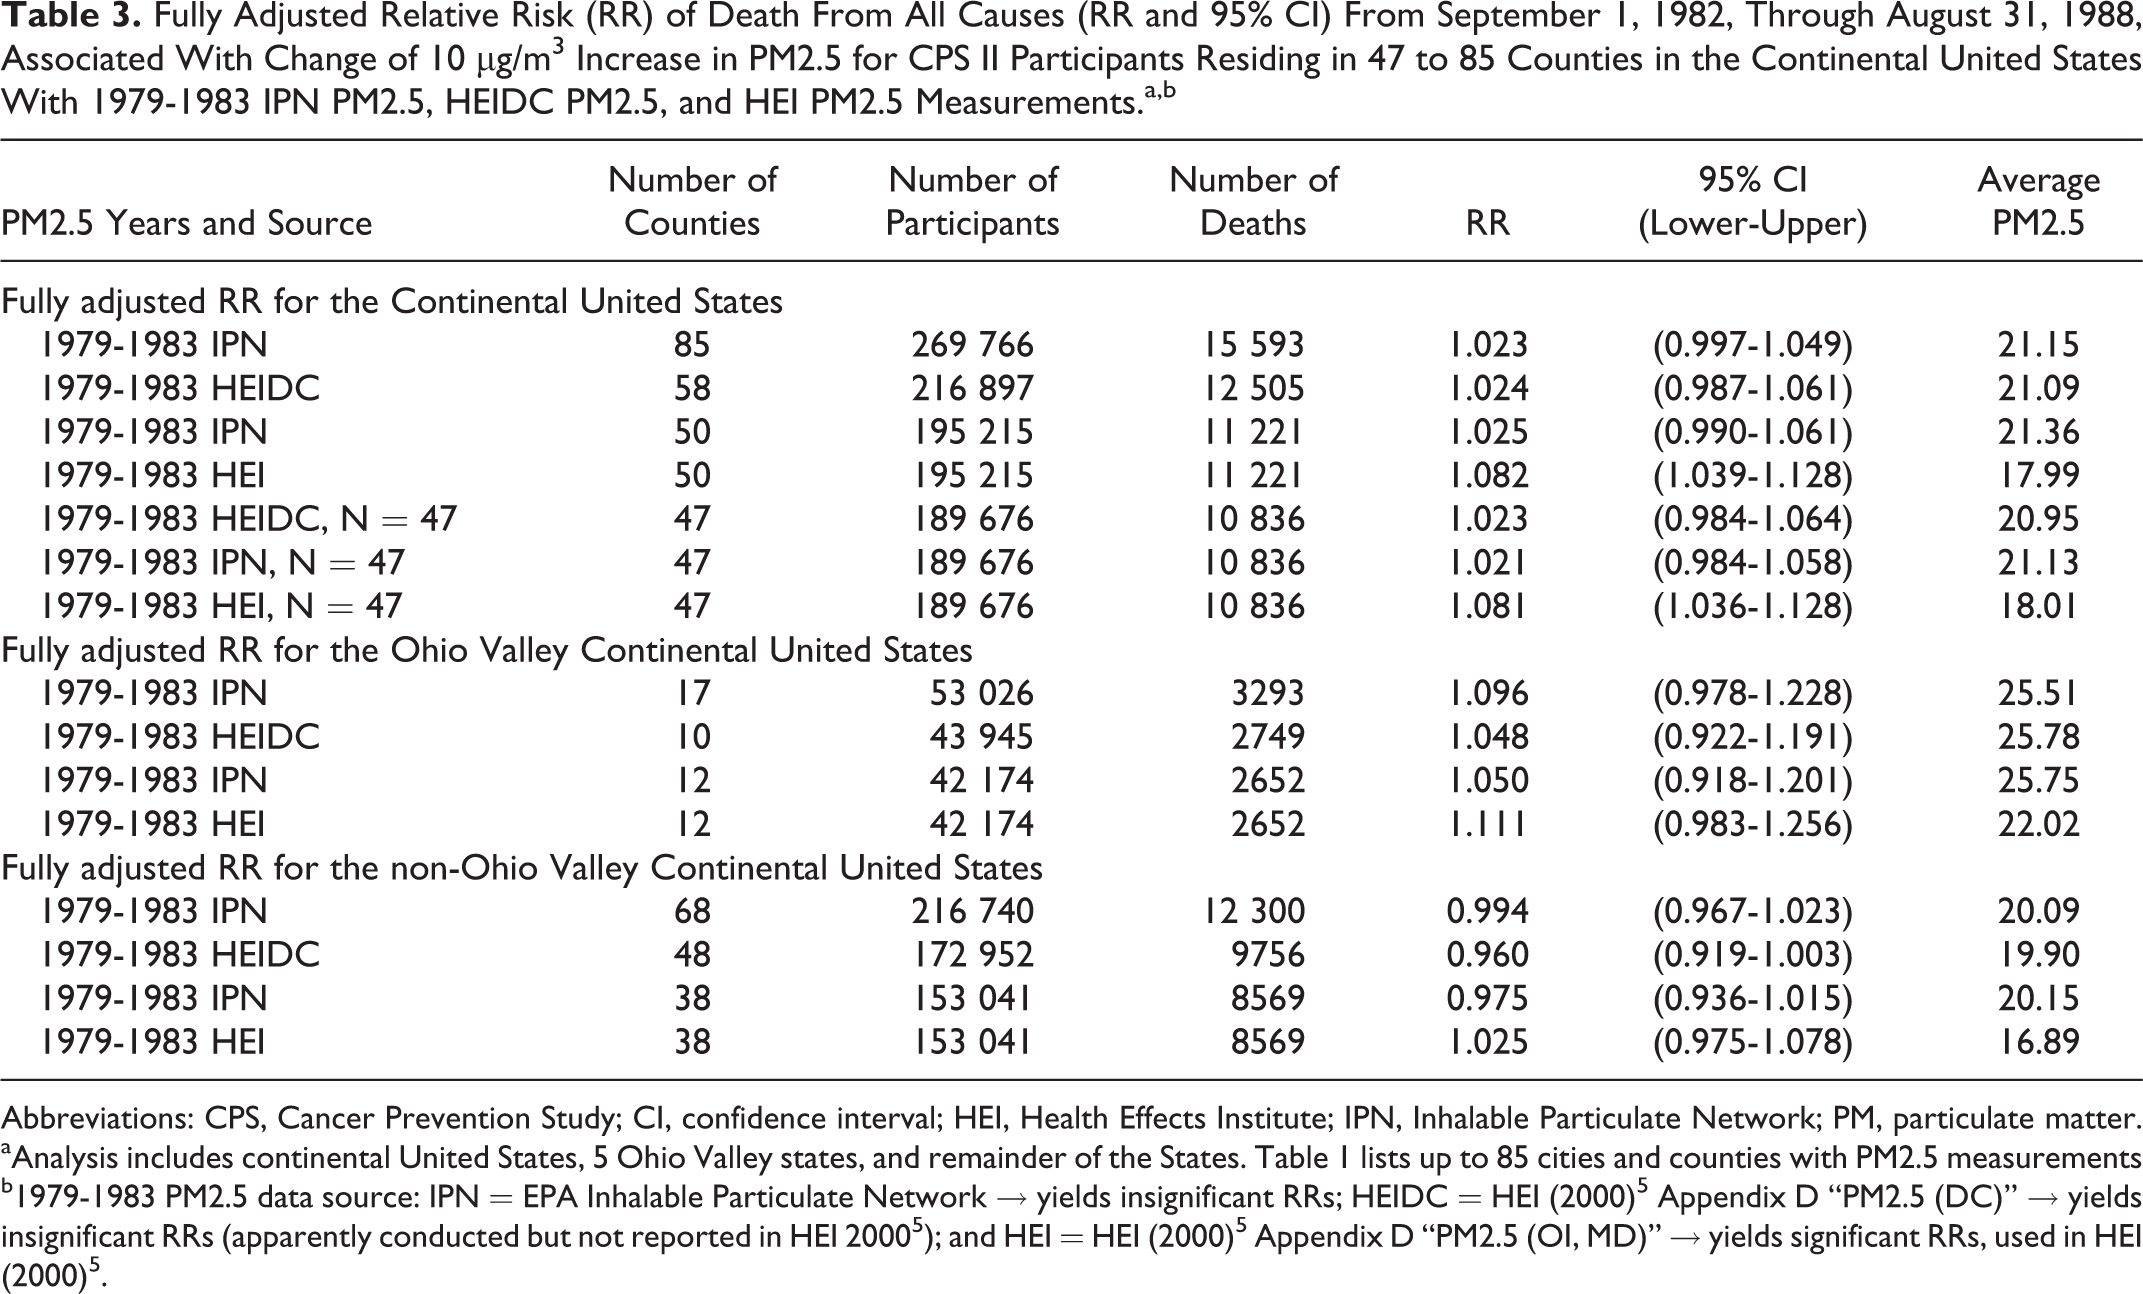
Abbreviations: CPS, Cancer Prevention Study; CI, confidence interval; HEI, Health Effects Institute; IPN, Inhalable Particulate Network; PM, particulate matter.
aAnalysis includes continental United States, 5 Ohio Valley states, and remainder of the States. Table 1 lists up to 85 cities and counties with PM2.5 measurements
b1979-1983 PM2.5 data source: IPN = EPA Inhalable Particulate Network → yields insignificant RRs; HEIDC = HEI (2000) 5 Appendix D “PM2.5 (DC)” → yields insignificant RRs (apparently conducted but not reported in HEI 2000 5 ); and HEI = HEI (2000) 5 Appendix D “PM2.5 (OI, MD)” → yields significant RRs, used in HEI (2000) 5 .
The HEI (2000) 5 Sensitivity Analysis “Risk Estimates Based on Alternative Air Quality Data” section states on page 170, “The means or medians of various indices of air pollution are summarized in Table 30.” The data included in this section reveal that the investigators seemed to be aware of the differences in mortality risk associated with PM2.5 (OI MD) and PM2.5 (DC). Table 31 shows RR (all causes) = 1.18 (1.09-1.26) based on PM2.5 (OI MD) values for 50 cities. This value is reduced to RR (all causes) = 1.12 (1.06-1.19) based on PM2.5 (DC) values for 63 cities. Both of these RRs are based on a maximum change in PM2.5 of 24.5 µg/m3. I did not previously recognize the similarity between the PM2.5 (DC) values and the IPN PM2.5 values because the only mention of IPN in HEI (2000) 5 occurs in the footnote at the end of Appendix D of Table D.1. Everywhere else in HEI (2000), 5 the term Inhalable Particulate Monitoring Network is used.
It appears that the investigators themselves found no relationship between PM2.5 and total mortality in CPS II in the 2007 SERRA article authored by Jerrett et al. 7 Although they cited 16 of their CPS II analyses in their Table 1, they did not cite Jerrett. 7 Figure 2 from Jerrett 7 shows no relationship between PM2.5 and total (all-cause) deaths during 1982 to 2000 in the CPS II cohort. The following quote accompanies Figure 2 “3.1 Health effects The RRs of mortality across the period of follow-up based on the subset of the 51 cities considered were smaller than in the full air pollution cohort considered in the previously full ACS cohort…. For example, all-cause mortality was significantly elevated by 6% in the larger cohort, but generally was not significantly elevated in these sub analyses.” In addition, Figure 3 (A and B) from Jerrett 7 shows no relationship between PM2.5 and total (all-cause) deaths during 1982 to 1986, 1987 to 1990, 1991 to 1994, 1995 to 1998, and 1999 to 2000. Furthermore, they found low RRs outside the Ohio Valley, as they state in the Discussion section on page 518, “Overall estimated RRs in the 51 cities used in this study were lower than in previous national studies. The lower RR estimates probably resulted from the exclusion of cities in the Ohio River Valley, which tended to demonstrate larger RRs from air pollution than other geographic regions….” Figures 2 and 3 (A and B) from Jerrett 7 are reprinted here.

Summary of risks for different exposures over the entire follow-up.
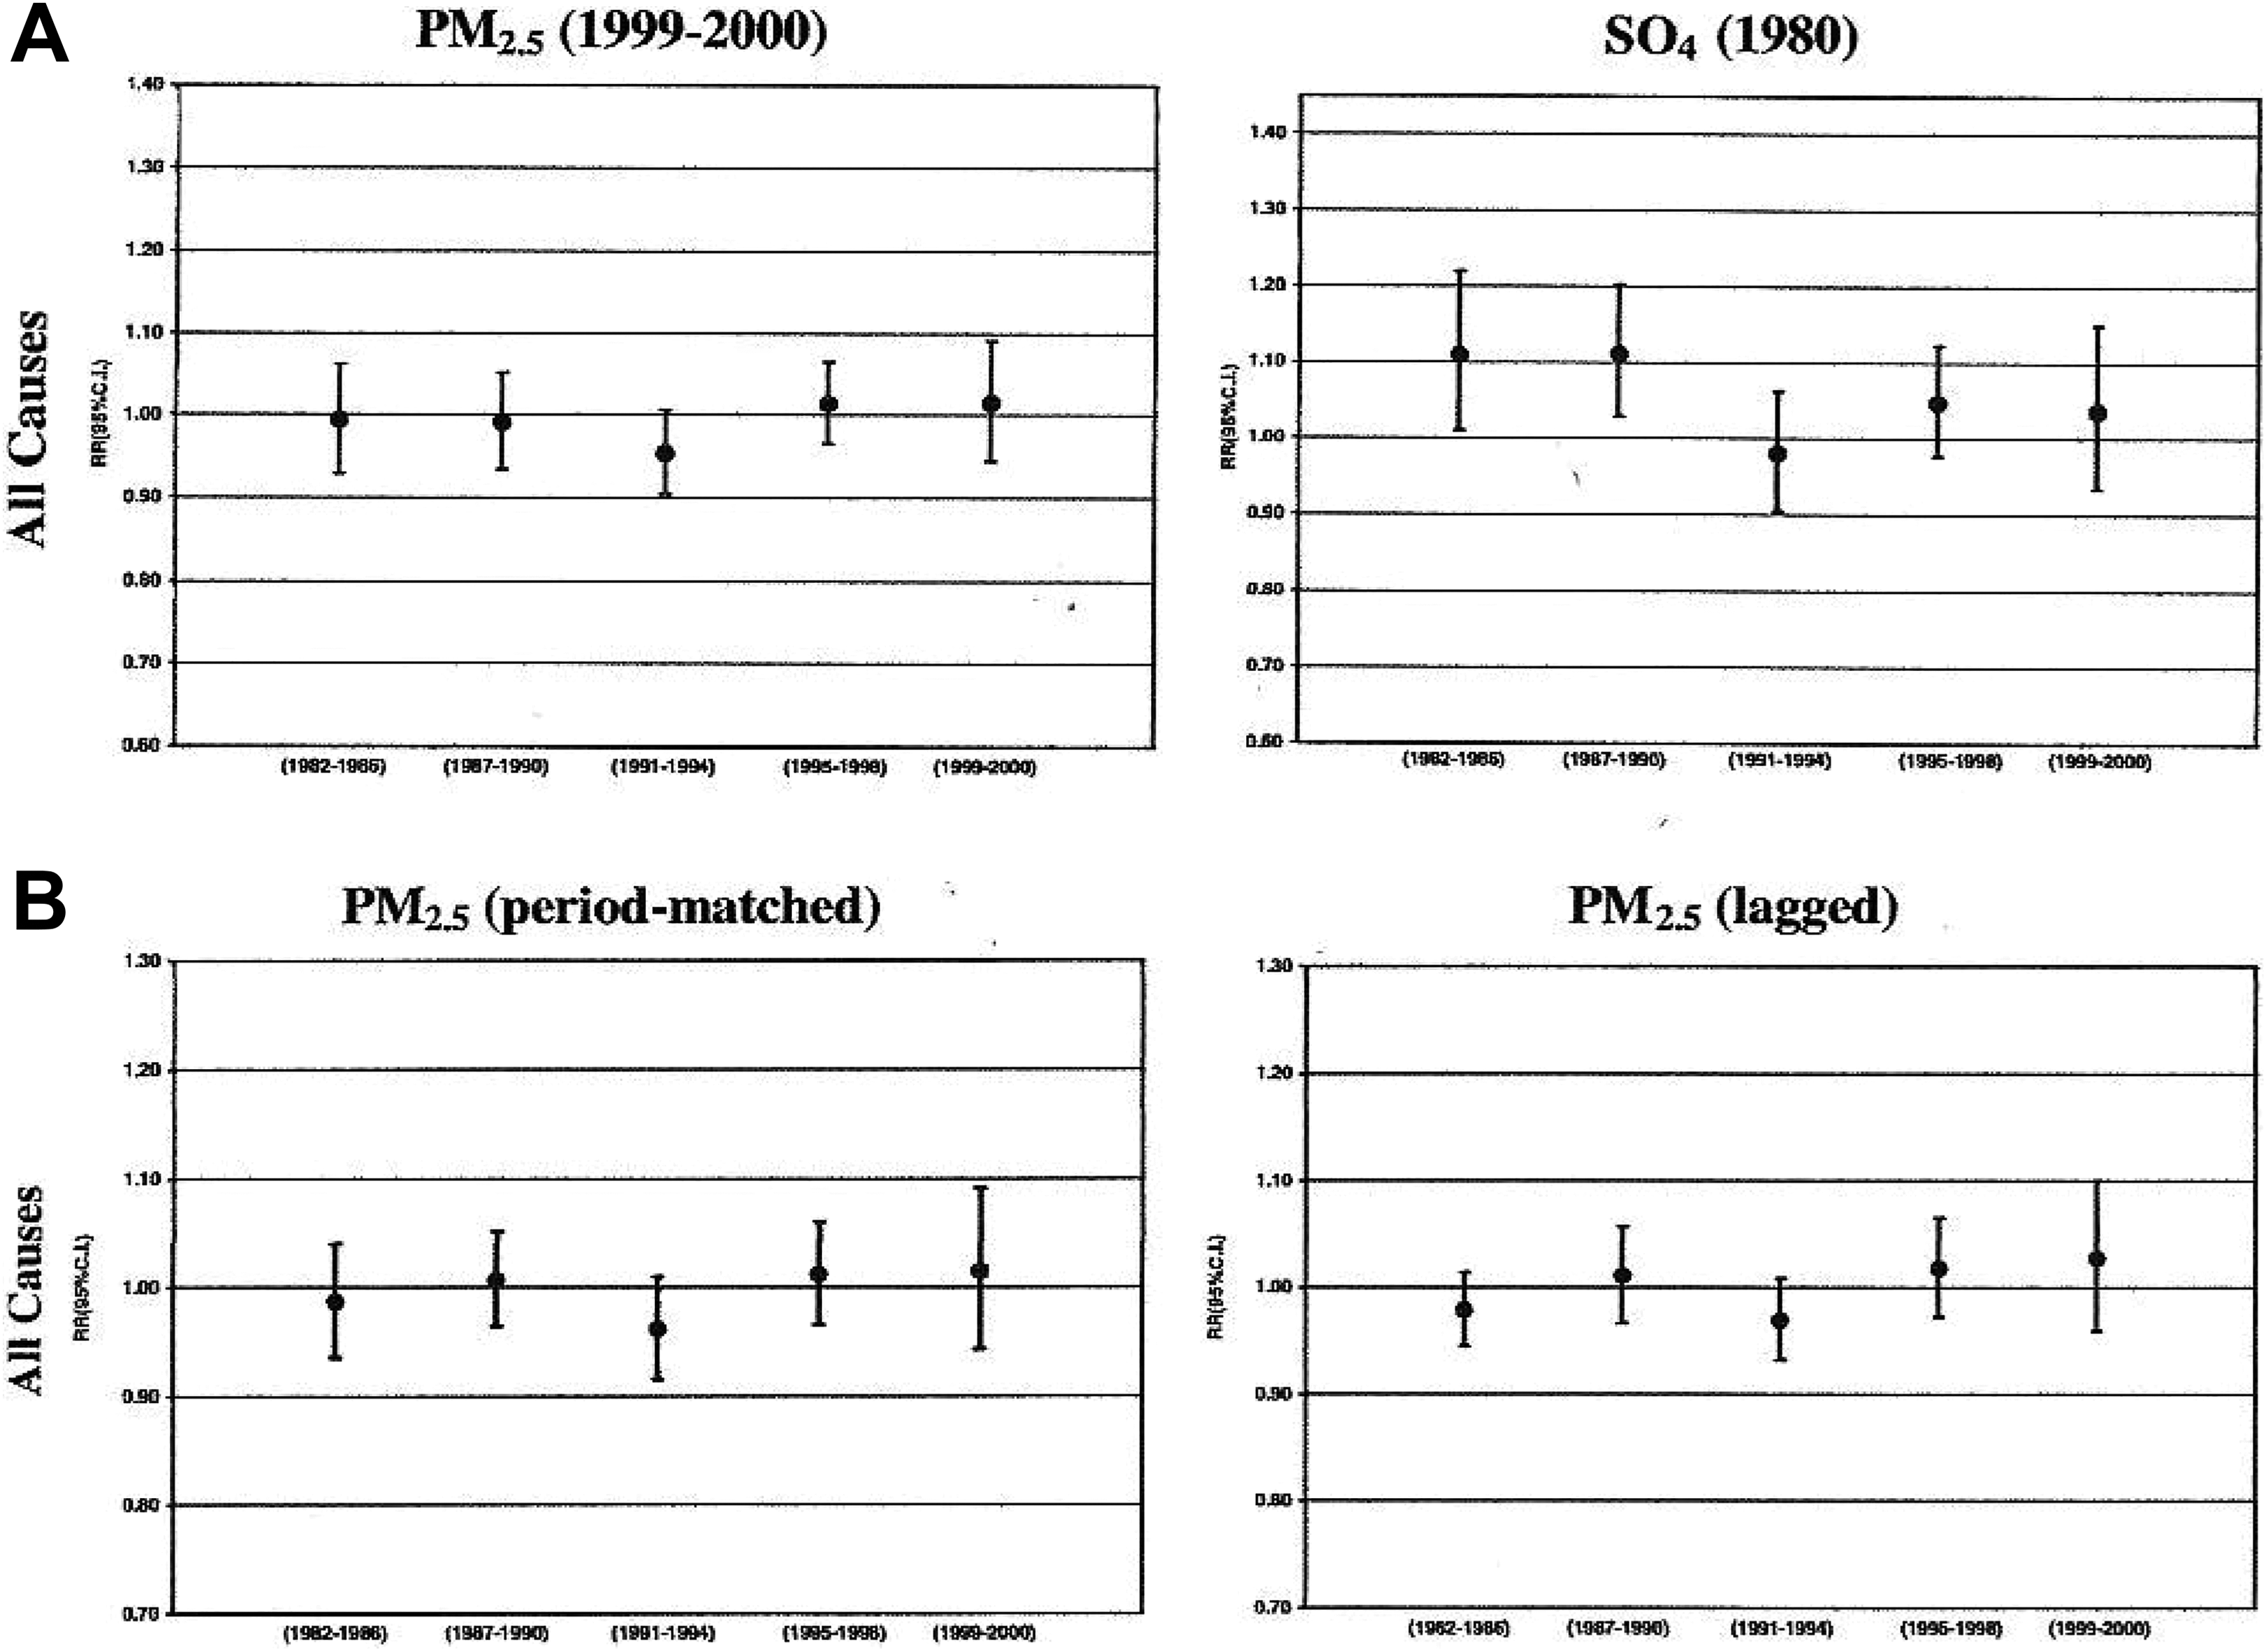
(A) Relative risks for all-cause, cardiopulmonary and lung cancer deaths estimated for five time periods of the follow-up (1982–1986, 1987–1990, 1991–1994, 1995–1998, and 1999–2000) with measured exposures. (B) Relative risks for all-cause, cardiopulmonary and lung cancer deaths estimated for five time periods of the follow-up (1982–1986, 1987–1990, 1991–1994, 1995–1998, and 1999–2000) with imputed exposures.
On June 12, 2017, HEI President Daniel Greenbaum (Greenbaum) provided me with the July 25, 1997 HEI Reanalysis Project Request for Qualifications (RFQ) (http://www.scientificintegrityinstitute.org/Greenbaum061217.pdf). This RFQ specifies the background and requirements for the HEI Reanalysis Project: “HEI is seeking applications representing teams consisting of 2-4 epidemiologists, statisticians and air pollution exposure experts.” According to Greenbaum, responses to the RFQ were received from 13 teams and HEI selected the 31-member Krewski team based at the University of Ottawa in Canada, apparently the only foreign-based team. The RFQ objectives and scope include this sentence: “(2) Conduct sensitivity analyses to test the robustness of the original findings and interpretations to alternative analytic approaches” (http://www.scientificintegrityinstitute.org/HEIRFQ072597.pdf). The Enstrom 3 findings challenge whether the robustness of the Pope 4 findings was properly tested with alternative PM2.5 data, such as IPN PM2.5 data, or alternative cities and counties and metropolitan areas within the CPS II cohort. I first published in 2005 the total mortality RRs for all 11 California counties in the CPS I cohort with IPN PM2.5 data. 8
Cohen, Pope, and Burnett provided indirect support for my findings in their May 13, 2017, Lancet “Global Burden of Disease” article, which went online April 10, 2017. 9 Table 2 from this article shows that, based on their own PM2.5 deaths evidence, the United States had a very low 2015 annual PM2.5-related death rate (18.5 deaths per 100 000 persons) and very low average ambient PM2.5 exposure (8.4 µg/m3). This table also shows that PM2.5 pollution is concentrated in other parts of the world, particularly China, India, and Africa, and not in the United States. In addition to the evidence of no PM2.5-related deaths in the CPS II cohort, there is null evidence in 2 other national cohorts: the NIH-AARP cohort 10 and the Veterans cohort. 11
The null PM2.5 total mortality evidence is further described in my August 12, 2017, Doctors for Disaster Preparedness talk “Scientific Misconduct in PM2.5 Epidemiology” (https://www.youtube.com/watch?v=DaFUhJxMNco), my October 12, 2017, NEJM letter “Air pollution and mortality in the Medicare population,” 12 my November 9, 2017, America First Energy Conference talk “ACS Promotes Air Pollution Pseudoscience” (http://americafirstenergy.org), and my key 2017 correspondence with the above investigators (http://www.scientificintegrityinstitute.org/DREmails101317.pdf).
Conclusions
My findings of no PM2.5-related deaths during 1982 to 1988 in the CPS II cohort, which are based on my peer-reviewed reanalysis of the CPS II data, stand unchallenged. 3 In addition, my null findings challenge the positive findings in 3 seminal publications by Pope, 4 HEI 2000, 5 and HEI 2009 6 as not robust and not supportive of the claim that PM2.5 causes premature deaths. The responses by Pope 1 and Gapstur 2 have failed to assess the validity or significance of my null findings, 3 but letters supporting the validity of my null findings have been published by Drs S. Stanley Young, 13 Frederick W. Lipfert, 14 and John D. Dunn. 15
Every effort is being made to encourage ACS, HEI, and the CPS II investigators to cooperate in transparent and verifiable analyses of the CPS II cohort data. However, given the unchallenged null findings in Enstrom, 3 the Environmental Protection Agency (EPA) must reassess all CPS II evidence relating PM2.5 to mortality as part of the current integrated science assessment of the PM2.5 National Ambient Air Quality Standard (NAAQS).
Footnotes
Declaration of Conflicting Interests
The author(s) declared no potential conflicts of interest with respect to the research, authorship, and/or publication of this article.
Funding
The author(s) received no financial support for the research, authorship, and/or publication of this article.