
Abstract
Kelch-like ECH-associated protein 1 (Keap1), nuclear factor erythroid 2-like factor 2-related factor 2 (Nrf2), and the antioxidant response element (ARE) are interacting components of a master regulatory signaling pathway that coordinates redox homeostasis, cytoprotective responses, and shifts in stem cell state. This study reexamined detailed dose–response (DR) data reported for in vitro Nrf2-ARE activation in human hepatoblastoma HepG2 cell lines containing either a ARE-bla or ARE-luc reporter at 12 different concentrations of each of 15 chemicals. The normalized study data were combined among chemicals exhibiting a positive response, yielding n = 531 (179) DR data for 9 (7) chemicals using the ARE-bla (ARE-luc) assay. Three-parameter linear/kth-power regression fits obtained to each combined set of ARE-bla- or ARE-luc-assay response data provided good fits (R 2 = .99 or .91, respectively, P fit > .99) that each incorporate a highly significant negative initial linear slope (P = 4 × 10⁻⁵ or .00025) and an overall J-shaped DR pattern. Results from this reanalysis of high-resolution ARE response data support the hypothesis that nonlinear ARE-mediated adaptive cellular responses to oxidative stress are governed by an ultrasensitive molecular switch.
Introduction
A highly evolutionarily conserved mechanism of cellular management and defense against reactive oxygen species (ROS)-induced oxidative stress involves 3 key interacting components: Kelch-like erythroid cell derived protein with cap ‘n’ coller homology (ECH)-associated protein 1 (Keap1), the nuclear factor erythroid 2-like factor 2 (or nuclear factor erythroid 2-related factor 2 [Nrf2]) transcription factor, and the antioxidant response element (ARE). These components comprise a master regulatory signaling pathway that coordinates redox homeostasis with a wide variety of direct cytoprotective responses (eg, detoxification; heme, lipid, and glucose metabolism; mitochondrial biosynthesis; cholesterol, nicotinamide adenine dinucleotide phosphate (NADPH), and pentose synthesis; inflammation in wound healing and tissue regeneration; autophagy; apoptosis; and necrosis) to endogenous and environmental stressors and additionally mediates stem cell state shifts between quiescence/maintenance, active proliferation, and differentiation. 1 -10 Briefly, Keap1 (a relatively cysteine-rich, dimeric cytosolic repressor protein with a total cysteine content of ∼4%—about double that of most other proteins) contains 2 subunits each with a site that binds and tethers Nrf2 such that the bound complex remains in the cytoplasm in a state that promotes its own ubiquitylation and consequent proteasomal degradation, preventing free Nrf2 from translocating to the nucleus, where it dimerizes with the small musculoaponeurotic fibrosarcoma protein and then binds to and activates the ARE DNA sequence that is present in single or multiple copies in the inducible promoter regions of ∼250 genes. Under quiescent conditions, Nrf2 has an effective ∼20-minute half-life, but reactions between ROS and/or electrophilic molecules with stress-sensing cysteine residues in Keap1 conformationally alter Keap1, causing it to release Nrf2, which then translocates to and dimerizes within the nucleus where it triggers transactivation of the ARE target genes. However, the molecular biology of ARE activation is complex and consistent with more nuanced interpretation. 11
Nuclear factor erythroid 2-related factor 2 is activated not only by ROS effects on Keap1 but also by a structurally diverse set of oxidizing, electrophilic, anti-inflammatory, and other agents in a dozen or more distinct chemical classes and physiological states. 1,2,4,6,7,9,10,12 -17 For example, chemicals including αβ-unsaturated carbonyls, sulfhydryl reactive metals, and isothiocyanates were shown to be strong Nrf2-ARE activators in primary human chronic lymphocytic leukemia cells using quantitative polymerase chain reaction measures of Nrf2 mRNA expression in those cells and using a HepG2 (human hepatocellular carcinoma cell) ARE bla β-lactamase (bla) reporter (ARE-bla) assay. 13 Nuclear factor erythroid 2-related factor 2 response activities of 2 chemicals (ethacrynic acid and hypoestoxide) and their reduced forms plotted in relation to the 8 concentrations tested for each chemical in that study suggest nonlinear, S-shaped dose–response (DR) patterns of activation, similar to DR patterns from 2 additional studies that reported detailed DR data on ARE activation. The first used 5 different (human liver, kidney, lung, breast, and brain) cell lines each containing a luciferase (ARE-luc)-based in vitro reporter of ARE activity and each exposed to 14 different concentrations of 10 different metals, hydroxyquinone, and o-phenylenediamine for 16 hours. 18 A second study, by Shukla et al, 19 used HepG2 cells containing either a ARE-bla or ARE-luc reporter to perform quantitative high-throughput screening of the US National Toxicology Program “NTP 1408” library involving 1340 unique compounds for their ability to induce oxidative stress at each of 12 different concentrations, of which detailed concentration-specific activity data were shown for a total of 15 chemicals (see Figures 2-5 of Shukla et al 19 ). The library of compounds screened by Shukla et al 19 was developed as part of the US Tox21 initiative—by the NTP, the US Environmental Protection Agency (EPA) National Center for Computational Toxicology, and the National Institutes of Health (NIH) Chemical Genomics Center—to identify chemicals that induce cytotoxicity in 13 rodent and human cell types, establish in vitro signatures of in vivo human and rodent toxicity (including hepatotoxicity, the most frequent target of orally consumed environmental chemicals included in the US EPA Integrated Risk Information System), and develop corresponding low-dose DR extrapolation models. 20,21
The present study undertook a more detailed investigation of selected assay-specific data plotted by Shukla et al 19 to characterize the nature and extent of ARE activation DR nonlinearity exhibited by subsets of chemicals that yielded unambiguously positive responses in each assay using methods described below. Results obtained from this analysis (presented in Results section) are discussed in the context of previously reported theory and observations concerning ARE activation kinetics.
Methods
Antioxidant Response Element Activation Data
Normalized assay-specific ARE activation DR data corresponding to Figures 2 to 5 shown by Shukla et al, 19 kindly made available by Drs Menghang Xia and Ruili Huang of the NIH National Center for Advancing Translational Sciences, were combined over those of the 15 chemicals addressed in those figures for each assay that exhibited a clearly positive response at one or more concentrations. In that study, net percentage activity (PA) was measured in relation to background activity in untreated cells and scaled in relation to maximum (defined as PA = 100%) activity measured in cells treated with a positive control chemical (β-naphthoflavone, which also induces cytochrome P450 enzyme activity by activating the aryl hydrocarbon receptor). For the purpose of this study, a “clearly positive response” for a chemical tested in a specific assay was assumed to be exhibited if PA measured at one or more concentrations, or an aggregate PA value using data combined over any set of concentration-wise contiguous positive PAs, was clearly significantly positive (P ≤ 0.01) as assessed by t tests. 22 Applications of these criteria yielded totals of n = 531 combined {log10(Ci ), PA ij } data points for 9 chemicals, chemical j = {alachlor, 2-amino-4-methylbenzothiazole, 2-amino-6-nitrobenzothiazole, 3-dimethylaminophenol, N,N-dimethyl-p-nitrosoaniline, N,N-dimethyl-p-phenylenediamine, 8-hydroxyquinoline, melphalan, and 1,10-phenanthroline monohydrate} (j = 1,…, 9), assessed using ARE-bla assays at log10 values of 12 chemical (molar) concentrations (Ci ) ranging from −9.66 to −4.42 log M, where 44.2 (40-45) is the average (and range) of the number ni of points at each ith concentration (i = 1,…12) for the combined data (see Table 1). A total of n = 179 such combined data points for 5 chemicals, chemical j = {3-dimethylaminophenol, N,N-dimethyl-p-nitrosoaniline, N,N-dimethyl-p-phenylenediamine, 8-hydroxyquinoline, and melphalan} (j = 1,…,5), were assessed using the ARE-luc assay at log10(Ci ) values ranging from −9.58 to −4.34 log M, where 14.9 (14-15) is the average (and range) of the number ni of points at concentration i for the combined data (see Table 2).
ARE-bla Assay Results Summary.
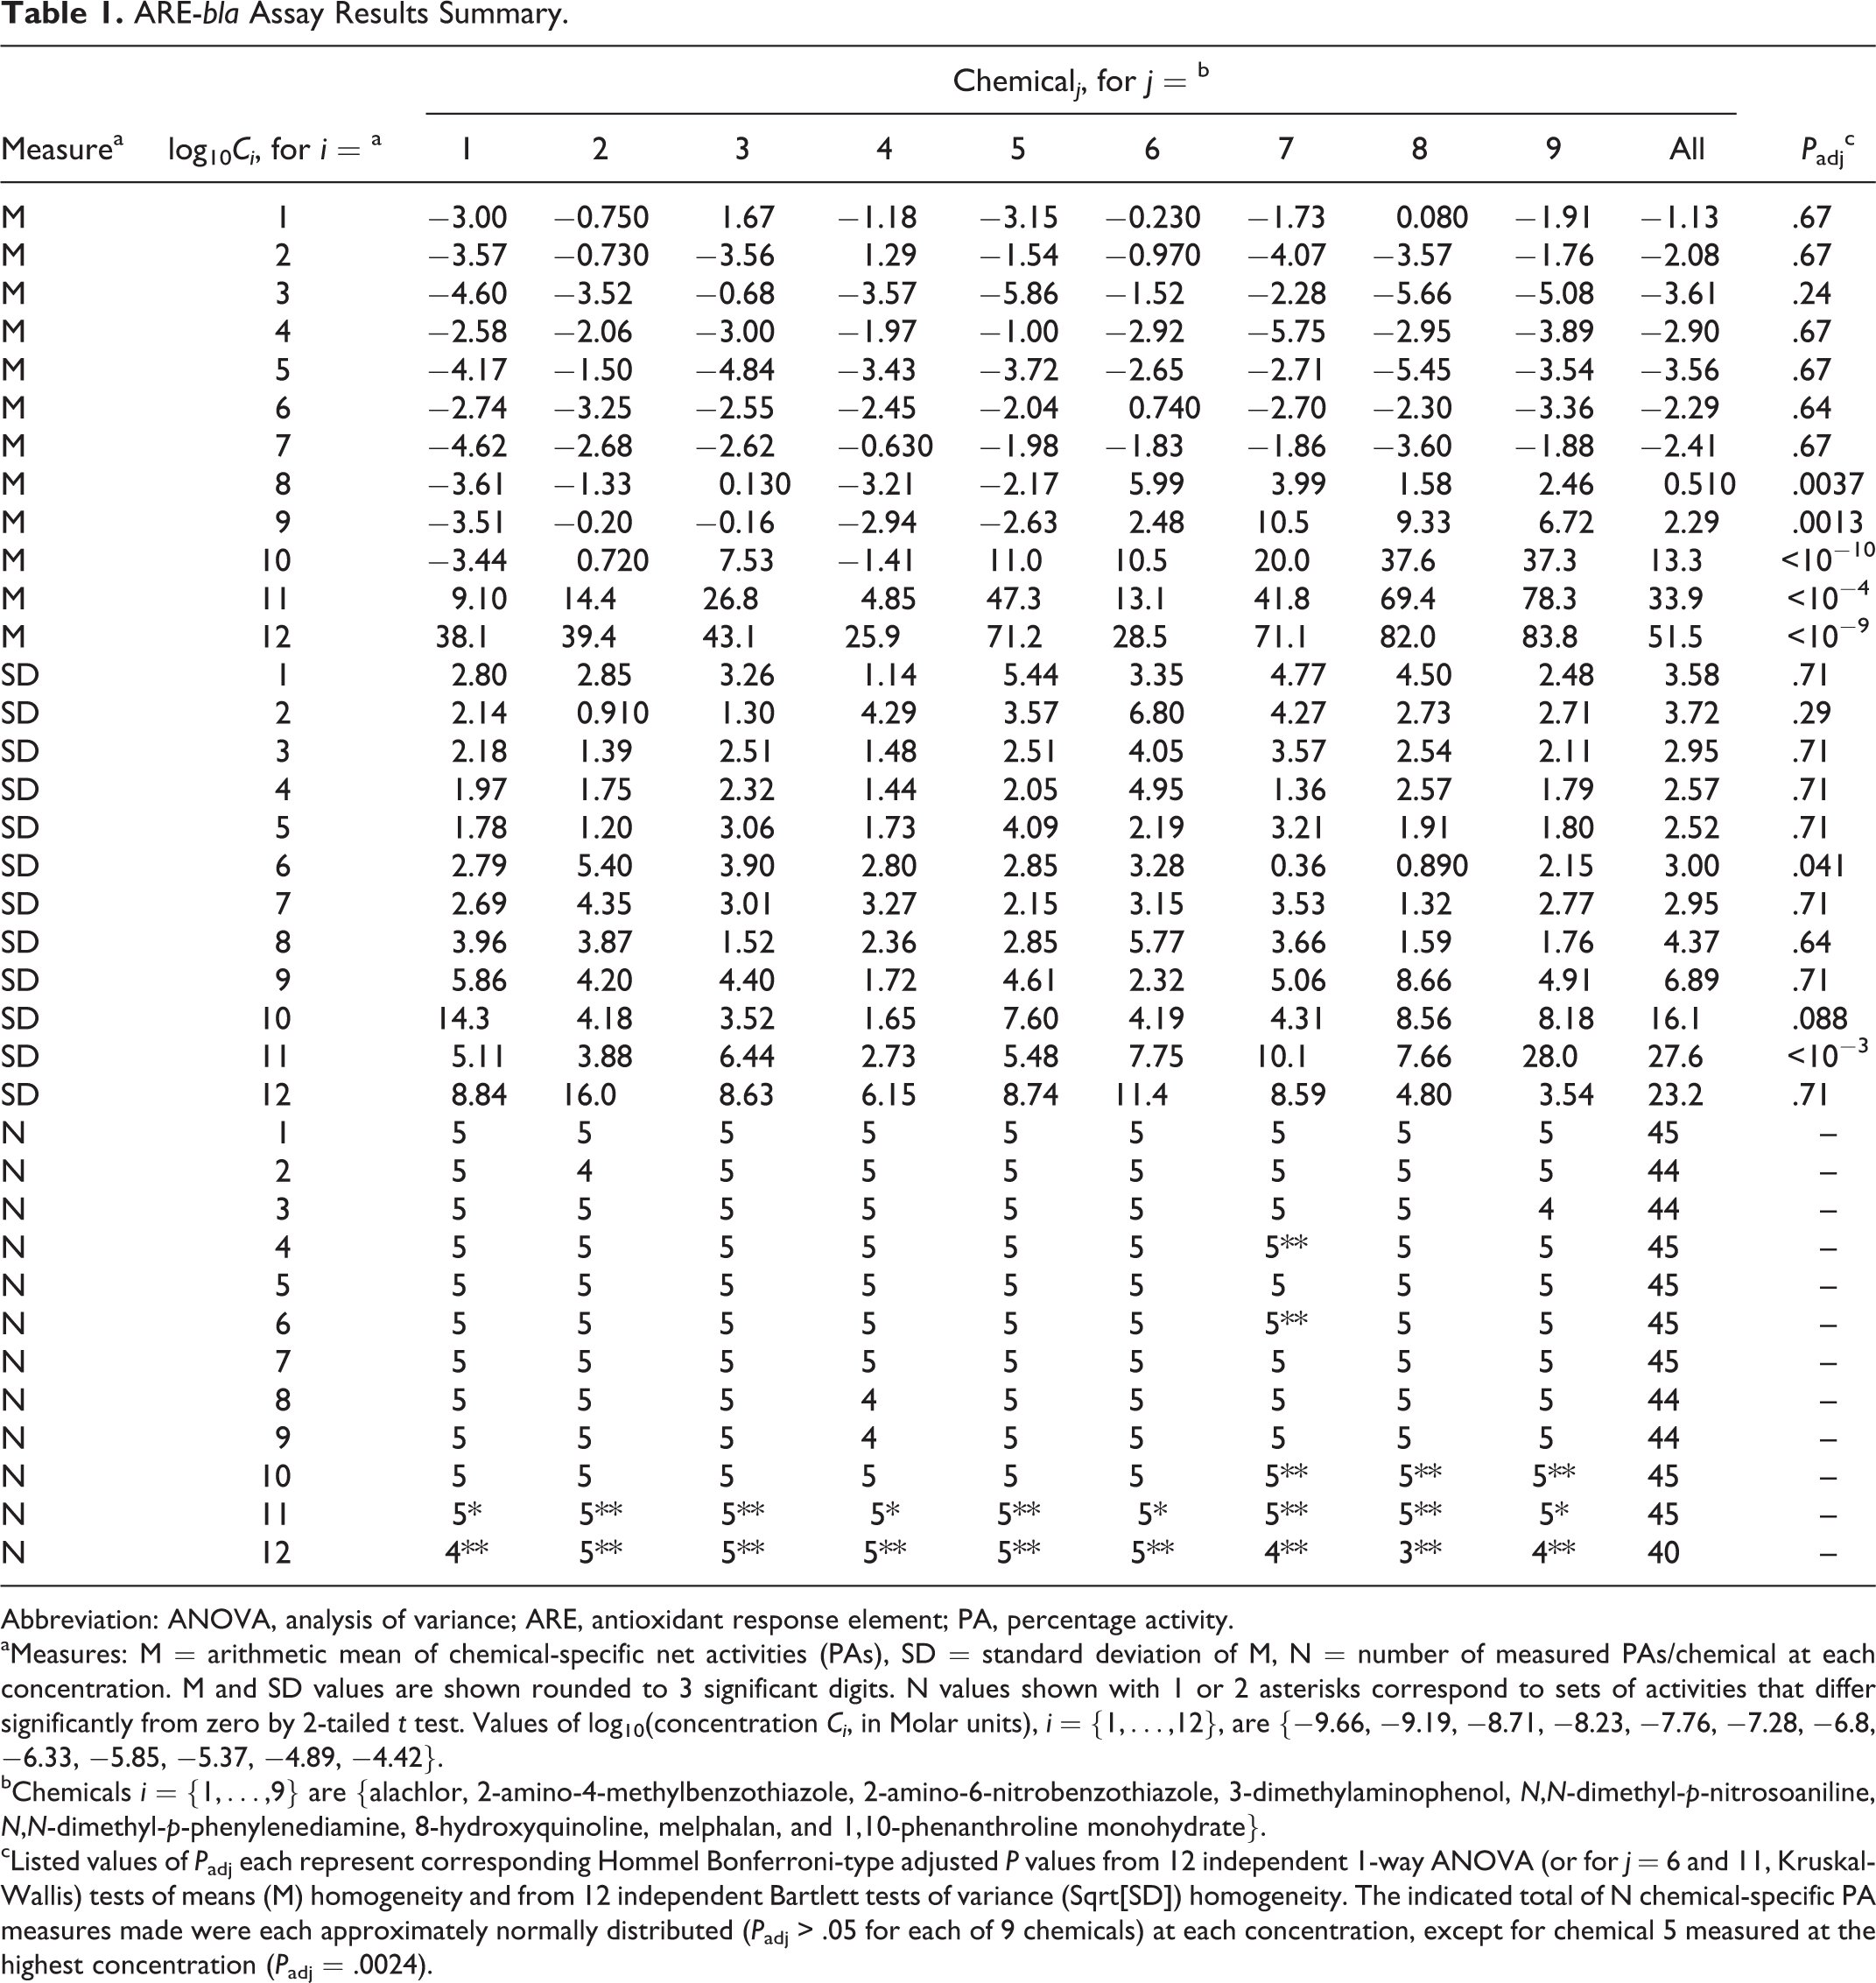
Abbreviation: ANOVA, analysis of variance; ARE, antioxidant response element; PA, percentage activity.
aMeasures: M = arithmetic mean of chemical-specific net activities (PAs), SD = standard deviation of M, N = number of measured PAs/chemical at each concentration. M and SD values are shown rounded to 3 significant digits. N values shown with 1 or 2 asterisks correspond to sets of activities that differ significantly from zero by 2-tailed t test. Values of log10(concentration Ci , in Molar units), i = {1,…,12}, are {−9.66, −9.19, −8.71, −8.23, −7.76, −7.28, −6.8, −6.33, −5.85, −5.37, −4.89, −4.42}.
bChemicals i = {1,…,9} are {alachlor, 2-amino-4-methylbenzothiazole, 2-amino-6-nitrobenzothiazole, 3-dimethylaminophenol, N,N-dimethyl-p-nitrosoaniline, N,N-dimethyl-p-phenylenediamine, 8-hydroxyquinoline, melphalan, and 1,10-phenanthroline monohydrate}.
cListed values of P adj each represent corresponding Hommel Bonferroni-type adjusted P values from 12 independent 1-way ANOVA (or for j = 6 and 11, Kruskal-Wallis) tests of means (M) homogeneity and from 12 independent Bartlett tests of variance (Sqrt[SD]) homogeneity. The indicated total of N chemical-specific PA measures made were each approximately normally distributed (P adj > .05 for each of 9 chemicals) at each concentration, except for chemical 5 measured at the highest concentration (P adj = .0024).
ARE-luc Assay Results Summary.

Abbreviation: ANOVA, analysis of variance; ARE, antioxidant response element; PA, percent activity.
aMeasures: M = arithmetic mean net activity, SD = standard deviation of M, N = number of net activities measured. M and SD values are shown rounded to 3 significant digits. N values shown with 1 or 2 asterisks correspond to sets of activities that differ significantly from zero by 2-tailed t-test. Values of log10(concentration Ci , in Molar units), i = {1,…,12}, are {9.58, 9.11, 8.63, −8.15, −7.68,…−7.20, −6.72, −6.25, −5.77, −5.29, −4.81, −4.34}.
bChemicals i = {1,…,5} are {3-dimethylaminophenol, N,N-dimethyl-p-nitrosoaniline, N,N-dimethyl-p-phenylenediamine, 8-hydroxyquinoline, and melphalan}.
cListed values of P adj each represent corresponding Hommel Bonferroni-type adjusted P values from 12 independent 1-way ANOVA (or for j = 6 and 11, Kruskal-Wallis) tests of means (M) homogeneity and from 12 independent Bartlett tests of variance (Sqrt[SD]) homogeneity.
Data Analysis
For each assay type, the significance of individual departures of mean combined PA from zero at each concentration was assessed by 2-tailed t tests, and corresponding characterizations of chemical j -specific sets of PA values at each concentration were assessed as follows: approximate normality (where feasible) by Shapiro-Wilk tests, 23 approximate variance homogeneity by Bartlett tests, 24 PA homogeneity by 1-way analysis of variance or (at concentrations at which significant [P adj ≤ .05] PA-variance nonhomogeneity was detected) by Kruskal-Wallis tests. 25 To account for multiple independent tests, corresponding adjusted P values (P adj) for each member of each set of 12 test-specific P values were obtained using Hommel Bonferroni-type procedure. 26 For each assay type, in view of approximate equality of chemical-specific sets of PA measures at each of the lowest 5 concentrations examined (see Results section), approximate equality of chemical-specific slopes and (conditional on equal slopes) of chemical-specific Y intercepts estimated by linear regression was performed using appropriate nested F-tests (each yielding an Fdf1 ,df2 -statistic with degrees of freedom df 1 and df2) from a corresponding analysis of covariance for linear regression (ANOCOVAR) 27 using chemical-specific data subsets involving only these concentrations.
Assay-specific ANOCOVAR results indicated approximately equal linear chemical-specific response patterns involving the lower 5 concentrations examined (see Results section). Consequently, an overall DR relationship for each assay was characterized jointly for all chemicals at lower concentrations, and averaged over chemical-specific responses at higher concentrations, by fitting a 3-parameter linear/k th-power function of log(Ci ), PA = b{log(1010 C)} + h{log(1010 C)} k , by inverse-variance-weighted nonlinear regression 28 to each assay-specific set of combined ARE-activation data, where log denotes the base 10 logarithm. Each assay-specific fit was evaluated conditional on an assumed value of zero net change in PA (relative to that in vehicle-exposed cells) at a 10−10 M concentration of each chemical (a concentration less than the lowest concentration of each chemical tested in each assay and consistent with the corresponding ANOCOVAR results discussed). The significance of the linear parameter (b) from each fit compared to a null hypothesis that b = 0 was assessed by a 2-tailed t test. Goodness of fit was assessed by χ2 tests performed with df degrees of freedom and by coefficients of determination (R 2), each indicating the fraction of total PA data variance explained by each fit obtained. All calculations were performed using Mathematica 11.0.1 software.28
Results
Tables 1 and 2 summarize the ARE-bla and ARE-luc assay data examined. Table 1 (2) indicates approximate homogeneity of chemical-specific sets of PA responses exhibited at each of the lowest 7 (11) concentrations used in ARE-bla (ARE-luc) assays, and both sets of assay-specific chemical-specific PA-response variances exhibited significant nonhomogeneity (P adj ≤ .05) only at 2 concentrations Ci (i = 6 and 11) examined in each assay. In view of observed PA response homogeneity over (at least) the lowest 5 concentrations Ci (i ≤ 5) examined in each assay, ANOCOVAR analysis performed using chemical-specific groups of PA response data indicated for each assay (ARE-bla and ARE-luc) that chemical-specific linear fits over that concentration range all have approximately equal slopes (F 8,205 = 0.86, P = .55; and F 4,65 = 1.91, P = .12) and (conditional on a common estimated slope) approximately equal Y-intercepts (F 8,213 = 1.76, P = .087; and F 4,69 = 1.77, P = .14). The ANOCOVAR results obtained over these lower concentrations are consistent with a common linear model, PA = a + blogC, with a significantly negative slope for each assay-specific combined data set, with the following estimated parameter (95% confidence interval) values and P value for a 2-tailed t test that b = 0:
ARE-bla: a = −13.0 (−18.3 to −7.67), b = −1.19 (−1.78 to −0.578), P = .00016
ARE-luc: a = −18.8 (−30.4 to −7.22), b = −1.65 (−2.99 to −0.319), P = .016
The combined ARE-bla data are plotted in Figure 1 together with the following 3-parameter linear/kth-power fit (see Methods section) to those data: b = 1.74 (1.21 to 2.28), h = 0.00616 (−0.00589 to 0.0182), k = 5.34 (4.15 to 6.53). This fit is consistent with those data (R 2 = .987; χ2 = 0.65, df = 9, P fit = .999) and exhibits a highly significantly negative initial linear slope b (P = 4 × 10⁻⁵) and overall J-shaped DR pattern (Figure 1). The mean values of ARE activation response for combined data shown in Figure 1 at log Ci with i = 2 to 7 (from left to right) are all significantly negative (P adj = .0023, P adj ≤ 10−8, and P adj < .0001, with i = 2, 3 to 5, and 6 to 7, respectively), whereas those with i = 10 to 12 are all significantly positive (P adj < 10−5).
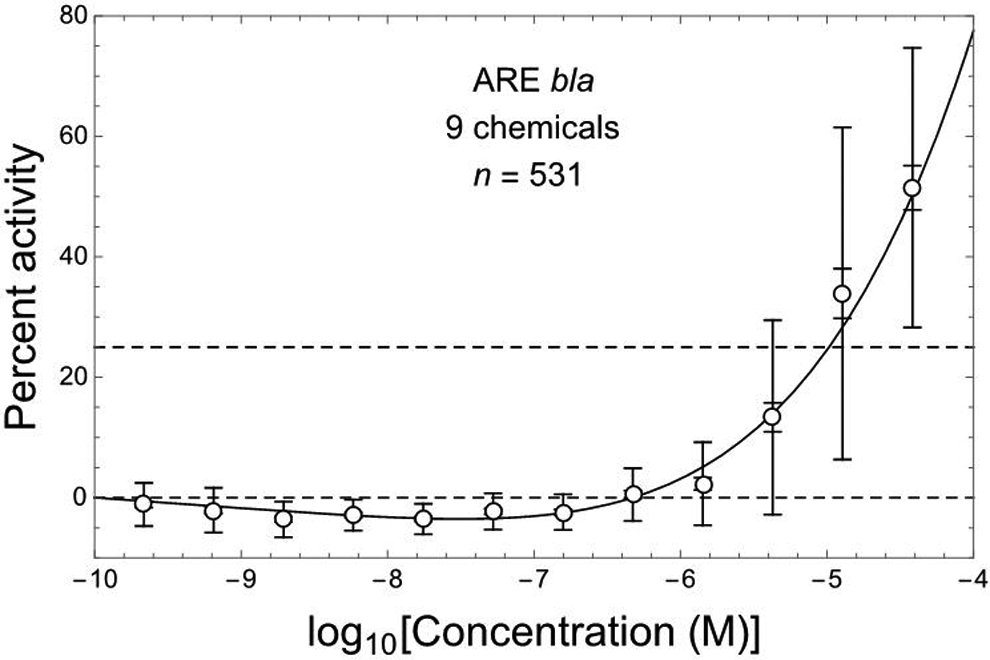
ARE-bla in vitro assay response (relative percent activity, PA) for Nrf2/ARE pathway activation at 12 concentrations of 9 different hepatotoxic chemicals (Shukla et al 19 ), here combined over all chemicals using corresponding normalized data kindly made available by Drs M. Xia and R. Huang (National Institutes of Health National Center for Advancing Translational Sciences); points = arithmetic mean PA, error bars = ±1 SDM (inner bars) and ±1 SD (outer bars). Dashed horizontal lines correspond to PA = 0% and 25%. Nonlinear J-shaped DR fit (solid curve, R 2 = .987) includes an initial linear slope that is significantly negative (P = .000040, by 2-tailed t test).
Similar results were obtained for the combined ARE-luc assay data shown in Figure 2, together with the following linear/kth power fit (see Methods section) to those data: b = 2.21 (1.35 to 3.07), h = 0.00616 (−0.00589 to 0.0182), k = 5.34 (4.15 to 6.53). The fit obtained to the combined ARE-luc assay data is consistent with those data (R 2 = .907; χ2 = 1.69, df = 9, P fit = .996) and exhibits a highly significantly negative initial linear slope (P = .00025) and overall J-shaped DR pattern (Figure 2). The estimated values of initial slope (b) from Figures 1 and 2 do not differ significantly by 2-tailed Z-test (P = .29) based on the corresponding b-estimate standard errors. The mean values of ARE-activation response for combined data shown in Figure 2 at log Ci with i = 2 to 7 (from left to right) are all significantly negative (P adj = 10−6, P adj = .0011, P adj < 10−7, and P adj ≤ .0020 with i = 1, 2, 3-5, and 6-7, respectively), while those with i = 10 to 12 are all significantly positive (P adj = .0014 and P < 10−5; i = 10 and 11-12, respectively).

ARE-luc in vitro assay response for Nrf2/ARE pathway activation at 12 concentrations of 7 different hepatotoxic chemicals (see Figure 1). Nonlinear J-shaped DR fit (solid curve, R 2 = .907) includes an initial linear slope that is significantly negative (P = .00025, by 2-tailed t test).
Discussion
Early theoretical studies have predicted that for Nrf2-mediated antioxidant responses, controlled variables such as ROS can exhibit nonlinear DR by a variety of mechanisms, including J-shaped response patterns in the case that an ultrasensitive feedback loop produces greater feedforward gain than bioactivation gain, 29 -32 perhaps mediated by posttranslational low-dose control mechanisms of cellular stress response that operate in the absence of altered transcription. 33 The results of the present study show that a J-shaped DR is also exhibited by Nrf2-mediated gene expression in response to redox-active chemicals.
If a J-shaped DR pattern like that shown here to operate for multiple reactive chemicals in HepG2 cells is generally characteristic of chemical Nrf2-ARE activation in vivo, effects mediated or modulated by this pathway would be expected to have the same J-shaped DR pattern. This prediction is consistent with observations that low and localized elevations in stem cell ROS levels serve to signal and control their proliferation and differentiation, while moderately increased ROS levels stimulate Nrf2-mediated adaptations to relatively low levels of oxidative stress, and higher ROS levels stimulate NF-κB and activator protein 1 that provide additional defense against more severe oxidative stress typically accompanied by inflammation and tissue repair in which Nrf2 appears to help resolve inflammation and regulate the magnitude of inflammatory response. 5,10,34 Pharmacological Nrf2 activation thus appears to manifest a low-dose nonmonotonic DR, whereby (1) Nrf2 in its normal physiological range acts to balance cellular ROS/antioxidant (redox) states; (2) intracellular ROS above a critical threshold activate Nrf2 to induce Kruppel-like factor 9 and thioredoxin reductase 2 activities that in turn exacerbate oxidative stress; and (3) strongly elevated Nrf2 activity quenches ROS levels by triggering increased antioxidant (eg, glutathione and NADPH) capacity that can reduce or prevent oxidative stress and associated cell damage and increased tumor risk, 4,35,36 but which if sustained may induce epithelial cell hyperplasia, multidrug resistance, inflammasome activation, and detrimental pathologies 10,34 including increased tumorigenesis and tumor promotion after relatively high and sustained Nrf2 activation. 4,37
The nonlinear, J-shaped DR patterns of in vitro Nrf2-ARE activation in HepG2 cells described here have particularly interesting implications if sustained levels of such activation (eg, mediated by chronic experimental or environmental chemical exposure) can act to increase tumor risk. For example, oxidative stress (by DNA-reactive chemical mutagens or mutagenic metabolites) could be a dominant tumorigenic pathway if sustained Nrf2-ARE activation induces recruitment of stem cells into an epigenetically maintained active state of adaptive hyperplasia that normally terminates after exposure stops but may be dysregulated and potentially tumorigenic if transduction of the normal termination signal is blocked by a rare mutation. 38,39 Under this hypothesis, the implied J-shaped DR pattern for increased tumor risk would differ fundamentally from the linear-no-threshold DR pattern implied by the multistage somatic mutation (MSM) theory of tumorigenesis. 38 -43 Consistent with this hypothesis is evidence that potently anti-inflammatory synthetic oleanane triterpenes such as the acetylenic tricyclic bis-(cyano enone) TBE-31, 1-2-cyano-3-,12-dioxooleana-1,9(11)-dien-28-oyl (CDDO) ethyl amide (CDDO-EA), and CDDO-imidazole (CDDO-Im) activate the Nrf2-ARE cytoprotective pathway, induce phase II enzymes, and can suppress or completely block formation of enzyme-altered proliferative hepatocellular foci and liver tumors in rodents coadministered hepatotoxic liver carcinogens such as aflatoxin B1 (also a potent mutagen) and carbon tetrachloride. 17,36,37,44,45 Although aflatoxin B1 exposures induce macromolecular adducts with a linear DR pattern over a wide range of doses down to 0.16 ng/kg, coadministration of CDDO-Im before and during aflatoxin B1 exposures that otherwise efficiently increase the occurrence of liver preneoplastic foci and tumors in male rats can nearly or completely eliminate these aflatoxin B1-induced lesions without proportionately reducing aflatoxin B1–DNA adducts, 36,34,37 which appears to be at odds with MSM theory. In contrast, rats fed for 11 weeks with a diet containing 25 ppm CDDO-Im experienced extensive bile duct proliferation and a ∼10-fold increase rather than any decrease in preneoplastic focal volume, and dietary CDDO-Im concentrations >25 ppm induced a striking increase in liver weight with elevated bile duct apoptosis, blood lipids, and serum alanine aminotransferase enzyme levels indicative of hepatotoxicity, suggesting that long-term CDDO-Im treatment induces structural and metabolic liver abnormalities that may contribute to increased tumor risk. 37
Evidence for a key role of Nrf-ARE activation in tumorigenesis adds to other evidence difficult to reconcile with MSM theory (eg, 36,38,39,41,46 -57 ). For example, ultradeep sequencing of 76 oncogenes in small biopsies of normal human skin recently revealed that “Remarkably, multiple cancer genes are under strong positive selection even in physiologically normal skin, including most of the key drivers of cutaneous squamous cell carcinomas,” and that “clones carrying two to three driver mutations…had not acquired malignant potential, raising the question of what combinations of events are sufficient for transformation.” 57 Recent evidence linking dysregulated patterns of microRNA expression and Nrf2 activation at very early stages of hepatocellular carcinogenesis 58 are also consistent with a non-MSM hypothesis that such patterns may typically drive tumorigenesis. 39
The molecular basis for the J-shaped ARE activation response observed in HepG2 cells, and the extent to which this may occur in other types of cells, remains to be determined. Zhang and Andersen 29 pointed out that “Local gains do not remain characteristically constant as the feedback network is increasingly activated by external stressors.…Although such inadequacy in effectively mounting a protective response is seemingly undesirable, in certain situations it may be an energy-saving design. For cells living in an environment featuring frequent but minor fluctuations, they may have purposely evolved to tolerate perturbations of small magnitude to avoid otherwise expensive and frequent activation of anti-stress genes. Another situation where the less-regulated phase may be preferred is in cells where the controlled variable is also used for signaling purposes.” Although Zhang and Andersen 29 considered only gene transcription factor-mediated feedforward mechanisms affecting a controlled cellular state as one way to explain why controlled cellular (eg, ROS-mediated redox) states can exhibit a J-shaped ultrasensitive-response patterns, feedforward action can also be mediated by a variety of posttranslational events that act more rapidly and efficiently than feedforward control mediated by altered gene expression. 33 Nuclear factor erythroid 2-related factor 2–induced target gene expression has a tightly controlled positive (nonzero) basal level that is maintained by complex regulatory machinery, 11 so Nrf2 expression itself clearly represents a tightly controlled cellular state affected directly by ROS stress. Consequently, if the most sensitive target of minor and transient elevations in ROS or electrophile concentrations is a direct and readily saturated inhibition of ARE activation, this would represent a fast-forward feedback mechanism consistent with an overall J-shaped activation response pattern. Nongene expression–mediated feedback is a fundamental advantage, for example, of relatively rapid and extensive microRNA-based modulations of protein expression, which now are recognized to play diverse and key roles in molecular biology, pathology, and toxicology. 59 -61 It is thus plausible that Nrf2-ARE activation is controlled by feedforward inhibition, mediated directly or indirectly by the cellular redox state, perhaps even involving a microRNA target that interacts directly with Nrf2. 62,63 Alternatively, J-shaped Nrf2-ARE activation may arise via posttranslational ROS-modulated conformational change(s) in Nrf2 and/or Keap1 that act initially (at very low levels of increased ROS) to reduce and then (at higher ROS concentrations, bistably) enhance either Nrf2-Keap1 dissociation or nuclear Nrf2 binding to nuclear ARE domains.
Chemical-specific patterns of induced ARE activation vary among cell types in which this end point has been measured, and HepG2 cell appears to exhibit sensitivities generally consistent with the overall range of those observed in other cell types examined to date. For example, Simmons et al18 estimated micromolar concentrations of 8 different metals and 2 ROS-inducing organic chemicals (hydroxyquinone and o-phenylenediamine) at which cell line–specific baseline levels of ARE activation were doubled in HepG2 cells and also in 2 to 4 other cell lines tested (HEK239T, MCF7, A172, and/or A549). In that study, 2 additional metals yielded only a single estimated doubling concentration, thus allowing no comparison with the background-doubling concentration estimated in HepG2-cells, and some of the other tested agents failed to yield a detectable ARE activation response in 1 or 2 of the cell lines tested. Although doubling concentration estimates in that study were referred to as “potency,” it is the inverse of each such estimate that characterizes potency as this term has been defined traditionally to measure net increased response per unit of exposure (in that study, measured as micromolar concentration). Defined this way, ARE induction potencies estimated for HepG2 cells were greater than those in other cell types for 3 of the 10 agents for which such a comparison was feasible, and 8 agents had HepG2 potencies within 3-fold of those estimated for all 10 agents. 18 Wu et al13 also found that Nrf2 signaling in primary human chronic lymphocytic leukemia cells was similar to that measured in normal peripheral blood mononuclear cells both at baseline and in response to various Nrf2-activating compounds.
To the extent that nonlinear, J-shaped DR patterns of in vitro Nrf2-ARE activation in HepG2 cells described here may also occur in different tissues in vivo, such DR patterns may thus have implications important to consider in estimating DR relationships for a wide range of toxic end points associated with chronic exposure to reactive chemicals or metabolites, including related elevations in tumor risk. Consequently, future experiments should be directed at measuring Nrf2-ARE activation in different tissues in vivo with as much DR resolution as the HepG2-cell data sets examined in this study.
Footnotes
Authors’ Note
The views presented do not necessarily reflect those of my reviewers, Exponent, Inc, or any of its clients.
Acknowledgments
The author is grateful to Drs Menghang Xia and Ruili Huang of the NIH NCATS who kindly provided normalized data corresponding to Figures 2 to 5 of Shukla et al19 study they co-authored, to Eric Markowsky, Dr Ryan Lewis, and Dr Joyce Tsuji who provided initial feedback on earlier drafts, to anonymous reviewers whose insightful comments improved this manuscript, and to my employer Exponent, Inc that funded preparation of this manuscript.
Declaration of Conflicting Interests
The author(s) declared no potential conflicts of interest with respect to the research, authorship, and/or publication of this article.
Funding
The author(s) received no financial support for the research, authorship, and/or publication of this article.