
Abstract
The biological effects of exposure to radioactive fluorodeoxyglucose (18F-FDG) were investigated in the lymphocytes of patients undergoing positron emission tomography (PET) procedures. Low-dose, radiation-induced cellular responses were measured using 3 different end points: (1) apoptosis; (2) chromosome aberrations; and (3) γH2AX foci formation. The results showed no significant change in lymphocyte apoptosis, or chromosome aberrations, as a result of in vivo 18F-FDG exposure, and there was no evidence the PET scan modified the apoptotic response of lymphocytes to a subsequent 2 Gy in vitro challenge irradiation. However, lymphocytes sampled from patients following a PET scan showed an average of 22.86% fewer chromosome breaks and 39.16% fewer dicentrics after a subsequent 2 Gy in vitro challenge irradiation. The effect of 18F-FDG exposure on phosphorylation of histone H2AX (γH2AX) in lymphocytes of patients showed a varied response between individuals. The relationship between γH2AX foci formation and increasing activity of 18F-FDG was not directly proportional to dose. This variation is most likely attributed to differences in the factors that combine to constitute an individual’s radiation response. In summary, the results of this study indicate18F-FDG PET scans may not be detrimental but can elicit variable responses between individuals and can modify cellular response to subsequent radiation exposures.
Introduction
From the discovery of the X-ray by Roentgen in 1895, medical imaging has grown rapidly to become a cornerstone of patient care. It has increased the physician’s ability to diagnose and treat disease and subsequently revolutionized medicine. The amount of information that can be obtained relatively easily without resorting to intrusive techniques is impressive and still growing. However, the development of these technologies has not been without consequences, such as the present day concerns regarding the increased cost to the health care system and potential biological consequences from diagnostic radiation exposure. 1,2
There is concern about the biological consequences of radiation exposures associated with many diagnostic imaging modalities and the potential for overexposure while using these tools. 3 Additionally, some companies are now marketing directly to patients and encouraging them to self-refer for diagnostic imaging 4,5 which has further increased the controversy and ethical debate about radiation exposure in medicine. 6
The effect of low-dose radiation is a contentious issue for many reasons. Some researchers predict the cancer risk of diagnostic imaging using a linear no-threshold risk model (LNT), largely derived from atomic bomb survivors. 7 Other researchers have challenged the LNT model of risk prediction and cited many studies that show nonlinearity of response to radiation. 8 The biological effects of diagnostic imaging are increasingly being investigated. Recent studies of 18 F-FDG PET injections (0.74-18.5 megabecquerel [MBq]) in mice showed no increased DNA damage based on micronucleated reticulocyte and γH2AX end points. 9 The low dose rate of 18 F-FDG decay appears to reduce DNA damage relative to equivalent doses of γ- or x-irradiation. 9 Although direct evidence of adaptive response (AR) induction was absent at most 18 F-FDG doses, the highest injected doses (14.8 and 18.5 MBq) resulted in a significant 20% reduction in constitutive γH2AX levels below control values, suggesting some form of DNA protective mechanism was induced at higher doses. 9 Complimentary studies using cancer-prone Trp53+/− mice demonstrate 18 F-FDG injections of 0.75 MBq (10 mGy whole body dose) increased the latency of some types of cancers. 10
A study on the consequences of 131I treatment (259-3700 MBq) showed an increase in chromosomal damage (measured by a sister chromatid exchange assay) 3 days after treatment, with only partial recovery at 6 months. 11 Another study took peripheral lymphocytes from patients before receiving the 131I treatment (259-3700 MBq) and 1 week following treatment. Samples were divided into 3 groups and challenged with in vitro radiation doses of 0, 0.5, and 1 Gy (137Cs γ-rays) and damage measured using the micronucleus assay. An AR was seen in 8 of the 20 people studied as indicated by decreased micronucleus frequency in the exposed samples compared to the samples taken before radionuclide injection, however large interindividual variation was observed. 12
The effects of computed tomography (CT) imaging have been studied by Kuefner et al who measured DNA lesions using γH2AX foci formation 30 minutes after coronary CT angiography procedures. 13 The double strand break (DSB) yield was found to change linearly in relation to the dose length product (DLP), with significant correlation (ρ = .81, P < .00001). The DLP is measured in units of mGy × cm and represents the CT dose index multiplied by the number of slices (N) and the thickness of each slice (T). Furthermore, they found that when the DSB was normalized to the DLP, there was negative correlation with the body mass index (BMI) of the patient (ρ = −.37, P < .06). In other words, those with a larger body habitus had fewer DSBs compared to those smaller than them, indicating that tissue may be absorbing or attenuating the beam and resulting in less effect to lymphocytes.
This study evaluates the effects of PET imaging using isolated peripheral human lymphocytes sampled before and after a standard PET scan in a patient. Prior to the scan, a small volume of 18 F-FDG is injected into the venous blood stream. The 18 F-FDG circulates until it is transported into cells to be utilized as a glucose substrate. A combination of this behavior and the molecular structure of 18 F-FDG cause it to accumulate in hypermetabolic tissues. As the 18 F decays (t1/2 = 110 minutes), it produces a positron (E = 250 keV β+), which subsequently annihilates into 2 gamma photons (E = 511 keV γ). Radiation detectors use the gamma photons to localize the accumulated radionuclide. Contact time between lymphocytes and 18 F-FDG depends on how long the 18 F-FDG circulates before being taken into tissues and cells for metabolism. The whole body effective dose from a PET scan for the purpose of tumor imaging is estimated at 10 mSv. 14
In the current study, patients undergoing PET scans to identify, detect, or stage tumors were approached to enter the study. Peripheral blood was taken both before the radionuclide was injected and also following 18 F-FDG administration and the subsequent scan. We hypothesized the low dose of radiation from a PET procedure causes an AR, which would manifest as the modification of cellular response to subsequent radiation exposures. The biological end points chosen for this study were apoptosis, chromosome aberrations, and γ-H2AX foci formation. Both the direct effect of the radiation dose arising from patient radionuclide exposure and the AR were investigated.
Methods and Materials
Patient Accrual and Sample Collection
The study was performed in conjunction with the Nuclear Medicine department at McMaster University Medical Centre. Patients receiving a PET scan to investigate an undefined lung or breast mass were approached to enter the study. Eleven patients were recruited and ethical approval was obtained through the Hamilton Health Sciences Research Ethics Board, and procedures followed were in accordance with the Helsinki Declaration. 15
Blood samples were collected from each patient into sodium heparin venous blood collection tubes (BD Biosciences, Mississauga, Ontario) both before injection with
18
F-FDG (Pre-PET) and upon completion of the PET scan (Post-PET). Blood was transported at room temperature in a Styrofoam transport box to the laboratory with an average elapsed time from collection to processing of 30 minutes. Lymphocytes were isolated from whole blood using Histopaque 1077 by centrifugation at room temperature for 30 minutes at 300g, according to the manufacturer’s instructions (Sigma-Aldrich, Oakville, Ontario). The isolated lymphocytes were washed twice with complete Roswell Park Memorial Institute medium at room temperature (17% fetal bovine serum, 0.8%
Patient Dose Estimates
Blood samples were collected from each patient both immediately before injection with 18 F-FDG (Pre-PET) and upon completion of the PET scan (Post-PET). The average time lapse between collection of the Pre-PET and Post-PET samples was 2 hours. The activity of 18 F-FDG injected was recorded for patient undergoing a PET scan to estimate individual radiation exposure with an average injected dose of 294.2 ± 18.7 MBq. The half-life of 18 F is 109.77 minutes, an average elapsed time between sample collection of 2 hours, and indicates 53.13% of the injected dose (156.3 ± 9.9 MBq) was deposited prior to the Post-PET sample collection. The average effective dose equivalent was 2.8 ± 0.2 mSv. 16
Apoptosis
Apoptosis was assessed in the lymphocyte samples using a 3,3′-dihexyloxacarbocyanine iodide (DiOC6) apoptosis assay 17,18 and Beckman Coulter EPICS XL Flow Cytometer (Beckman Coulter).
Following isolation, 2 Pre-PET scan and 2 Post-PET scan 25-cm3 flasks containing 5 mL each of lymphocyte suspension were warmed to 37°C simultaneously in a 95% humidified incubator containing 5% CO2 and incubated for 4 hours. Paired Pre-PET and Post-PET flasks were then irradiated on ice using a 137Cs source (661 keV) at a dose rate of 0.1 Gy/min for total doses of either 0 (sham irradiation) or 2 Gy before being returned to the incubator for 44 hours. Postincubation, 3 samples of 2.5 × 10⁵ cells from each flask were placed into 5 mL centrifuge tubes and spun at 300g for 5 minutes. The supernatant was removed to leave approximately 100 μL of media, which was used to resuspend the cells for labeling.
Apoptotic cells were identified as those with decreased mitochondrial membrane potential. 10μL of 7 AAD and 100 μL of phosphate-buffered saline (PBS) were added to each tube before incubating 10 minutes in the dark and at room temperature. Postincubation, at room temperature, 500 μL of DiOC6 solution (40 nmol/L of DiOC6 in PBS, made fresh daily) was added to each tube. Samples were left to incubate for 15 minutes in the dark at room temperature. Information was collected from 10 000 lymphocytes per sample and characterized by size, density, and fluorescence signal intensity.
Chromosome Damage
Chromosome damage was measured in 4 patients using conventional cytogenetic culture, harvest, and fixation in combination with spectral karyotyping (SKY). As with the apoptosis method, 2 Pre-PET scan and 2 Post-PET scan 25-cm3 flasks containing 5 mL each of lymphocyte suspension were warmed to 37°C simultaneously in a 95% humidified incubator containing 5% CO2 and incubated for 4 hours. Paired Pre-PET and Post-PET 25-cm3 flasks containing 5 mL each of lymphocyte suspension were irradiated on ice using a 137Cs source (661 keV) at a dose rate of 0.1 Gy/min for a total dose of either 0 or 2 Gy. Following irradiation, cells were stimulated with 25 μL/mL phytohemaglutinin (PHA; Sigma-Aldrich) and incubated at 37°C (95% humidity and 5% CO2). After 47 hours, 10 μL/mL of colcemid (Invitrogen) was added to all flasks and incubated for 45 minutes.
Samples were centrifuged at 200g for 7 minutes, and the supernatant was removed by aspiration. KCl solution of 0.075 mol/L, prewarmed to 37°C, was added to each sample dropwise to a total of 10 mL. Samples were incubated for 20 minutes at 37°C and then centrifuged at 200g for 7 minutes. The supernatant was aspirated off and replaced, dropwise, with 10 mL of fresh 3:1 fix (methanol:glacial acetic acid). Samples were incubated for 15 minutes at room temperature and centrifuged again to replace the supernatant with 12 mL of fresh 3:1 fix and stored at −20°C.
Stored samples were centrifuged once at 200g for 7 minutes to replace the supernatant with fresh 3:1 fix and centrifuged again to remove the supernatant and replaced it with enough fresh 3:1 fix to obtain an adequate slide dropping concentration (approximately 0.5-1.5 mL). Cell suspension was dropped onto cleaned slides in a Thermotron CDS-5 (Thermotron Industries, Holland, Michigan) set to 28°C and 50% humidity. Slides containing suitable high-quality metaphases were selected, aged for 16 to 30 hours in a dry incubator at 37°C, and used for the SKY protocol according to manufacturer’s instructions (ASI, Carlsbad, California).
Metaphase images were captured using an Olympus BX51 microscope (Olympus, Canada) fitted with a DM 230025 ASI SpectraCube (ASI) and Acquisition Expo software. Image analysis and karyotyping were performed using SKYVIEW software (ASI). A metaphase was considered suitable for analysis if it appeared to have lost less than 6 chromosomes randomly and had no flaws obstructing analysis in either the inverted DAPI or the spectral image. Between 36 and 112 (mean = 73, σ = 25.5) metaphases contributed to the totals for each sample treatment, depending on cytogenetic sample volumes, mitotic index, and final slide quality. Metaphase and karyotype analysis was based upon information from pseudocolour assignment as well as the spectral and inverted DAPI images. Each karyotype was analyzed for structural aberrations such as dicentrics, translocations, and rings. The number and type of observed aberrations, plus the minimum number of breaks needed to give rise to them, were recorded. Numerical chromosomal abnormalities were also recorded when encountered but did not contribute toward the break total.
DNA Damage
DNA double-strand breaks were measured by γH2AX fluorescence using the H2AX Phosphorylation Assay Kit (Cell Signaling Technologies, Boston, Massachusetts), which contains a fixing solution (37% formaldehyde and 10%-15% methanol), permeabilization solution (5% saponin, 100 mmol/L HEPES, pH 7.4, 1.4 mol/L NaCl, and 25 mmol/L CaCl2) and washing solution (1% saponin in PBS).
Following isolation, 2 mL of Pre-PET and Post-PET lymphocyte cell suspension was transferred to 15-mL conical tubes containing 4 mL of PBS. Samples were centrifuged at 300g for 7 minutes, the supernatant was removed by aspiration, and the pellet was vortexed. Cells were incubated on ice with 500 μL of fixation solution for 20 minutes and washed twice with 6 mL of PBS before 500 μL of permeabilization solution was added.
Aliquots of 100 μL were transferred into five 5-mL centrifuge tubes. Four replicate tubes were stained with 3.5 μL of antiphospho-Histone γH2AX (Ser139)–FITC conjugate antibody, and 1 control tube was stained with normal mouse IgG–FITC conjugate antibody. Tubes were incubated on ice for 20 minutes and then washed with 200 μL of wash solution. Samples were resuspended with 300 μL of PBS and measured by flow cytometry. Mean channel values for all 4 tubes were averaged and normalized to the control tube for each sample. A subsequent radiation exposure was not given for this part of the study; therefore, there are no γH2AX Pre-PET+ 2 Gy or Post-PET +2 Gy samples.
Statistical Analysis
Procedural errors occurred during the γH2AX assay when processing patient sample D and during the apoptosis assay when processing patient sample J. As a result, these specific samples were excluded from the study.
Student’s paired, 2-tailed t test was used to compare γH2AX foci and apoptosis levels between samples. Linear correlations between injected FDG activity, apoptosis, and γH2AX were determined using the Pearson product–moment correlation coefficient with 2-tailed P values calculated. SKY data were analyzed using the Kolmogorov-Smirnov test, analysis of variance (aov) and Generalized Linear Mixed Models (Poisson family, canonical log link, glmmPQL) in R (version 2.12.2, R-project.org). A Generalized Linear Mixed Models approach was chosen because repeated measures, which are intrinsic to cytogenetic techniques, are addressed within the model structure. Also, the model output represents the population averaged effect, which identifies significant population trends while allowing for donor individuality.
Results
Apoptosis
No increase in apoptosis was observed between Pre-PET +0 Gy and Post-PET +0 Gy samples (P = .9), indicating that the radiation dose from the PET scan was not sufficient to induce apoptosis (Figure 1). Furthermore, no difference, and therefore no apoptosis-based AR, was observed between Pre-PET and Post-PET samples following a subsequent 2 Gy exposure (P = .5; Figure 2).

Apoptosis in lymphocytes isolated before (Pre-PET + 0 Gy, Control) and after (Post-PET + 0 Gy, Exposed) a PET scan procedure, as measured by flow cytometry and a 3,3′-dihexyloxacarbocyanine iodide (DiOC6) apoptosis assay. Total incubation at 37°C, 95% humidity, and 5% CO2 between sample isolation and start of the apoptosis assay was 48 hours. Information was collected in triplicate from 10 000 lymphocytes per sample and characterized by size, density, and fluorescence signal intensity. Error bars represent the standard error of the mean. PET indicates positron emission tomography.

Radiation-induced lymphocyte apoptosis measured in isolated peripheral lymphocytes. The Control sample (Pre-PET +2 Gy) and Exposed sample (Post-PET + 2 Gy) were each incubated for 4 hours at 37°C, 95% humidity. and 5% CO2 following isolation, before being given a 2-Gy in vitro radiation exposure. Lymphocyte suspensions were irradiated on ice using a 137Cs gamma source (661 keV) at a dose rate of 0.1 Gy/min. Following an additional 44-hour incubation, samples were quantified for apoptosis using the 3,3′-dihexyloxacarbocyanine iodide (DiOC6) apoptosis assay and flow cytometry. Information was collected in triplicate from 10 000 lymphocytes per sample and characterized by size, density, and fluorescence signal intensity. Radiation-induced apoptosis is defined by the amount of apoptosis at 2 Gy minus observed background apoptosis. Error bars represent the standard error of the mean. PET indicates positron emission tomography.
Chromosome Damage
The Kolmogorov-Smirnov test showed the individual distributions within the SKY data set were not significantly different in shape (P ≥ .214), which suggests they had a similar type of biological response and are suitable for more detailed comparison.
A summary of the observed breaks and dicentric chromosomes per metaphase is presented in Table 1. No difference was found in break counts between Pre-PET + 0 Gy and Post-PET + 0 Gy samples (P = .528, Figure 3A), indicating that a PET scan does not cause observable chromosome damage. However, a statistically significant AR was seen following a subsequent 2 Gy exposure. Post-PET + 2 Gy samples were found to have an average of 22.86% fewer observable breaks compared to Pre-PET + 2 Gy samples (95% confidence interval = 9.45%-37.92%, P = .0005; Figure 3A). This AR was also statistically significant when only observed dicentric chromosomes were considered as opposed to total observed breaks. Post-PET + 2 Gy samples had an average of 39.16% fewer observed dicentrics compared to Pre-PET + 2 Gy samples (95% confidence interval = 8.45%-78.58%, P = .0094; Figure 3B). A significant relationship between the observed total breaks and dicentric chromosome count was also found in cells exposed to 2 Gy (P = .0169; Figure 4).
Summary of Chromosome Damage Observed by SKY Across all Groups.a

Abbreviations: AR, adaptive response; PET, positron emission tomography; PHA, phytohemaglutinin; SKY, spectral karyotyping
a Lymphocytes were isolated from samples taken before (Pre-PET) and after Completion of a PET Scan (Post-PET), and exposed to 0 Gy (Mock Irradiation, + 0 Gy) or 2 Gy (+2 Gy) of γ radiation. Following Conventional cytogenetic culture and harvest techniques, slides were made and processed for SKY according to manufacturer instructions. High-quality metaphases (n) were analyzed and the number and type of chromosome aberrations observed plus the minimum number of breaks needed to give rise to them were recorded. a and b denote groups significantly different from each other; P = .0005 and P = .0094, respectively, as determined by a generalized linear mixed model analysis (R version 2.12.2, R-project.org). This result demonstrates a PET scan can induce an AR and change cellular response to subsequent radiation exposures.

Interaction plots of the chromosome break (A) and dicentric chromosome frequency (B) observed by SKY. Samples were taken before (Pre-PET) 18F-FDG injection and after completion of the PET scan (Post-PET). Lymphocytes were isolated and exposed to 0 Gy (mock irradiation, +0 Gy) or 2 Gy (+2 Gy) of gamma radiation in vitro using a 137Cs source (661 keV) at a 0.1Gy/min dose rate. Following stimulation with 2 5μL/mL PHA; culture for 47 hours at 37°C, 95% humidity, and 5% CO2; and treatment with 10 μL/mL of colcemid for 45 minutes, cells were harvested according to conventional cytogenetic techniques, and slides were made and processed for SKY according to manufacturer instructions. The number and type of observed chromosome aberrations, plus the minimum number of breaks needed to give rise to them, were recorded for high-quality metaphases (n = 276-330). No difference was found in break counts between Pre-PET +0 Gy and Post-PET +0 Gy samples (A; P = .528), indicating that a PET scan does not cause observable chromosome damage. A significant adaptive response (AR) can be seen following the subsequent 2 Gy exposure; Post-PET + 2 Gy samples were found to have an average of 22.86% fewer observable breaks compared to Pre-PET + 2 Gy samples (A, 95% confidence interval = 9.45%-37.92%, P = .0005). This AR was also statistically significant when only observed dicentric chromosomes were considered. Post-PET + 2 Gy samples had an average of 39.16% fewer observed dicentrics compared to Pre-PET + 2 Gy samples (B, 95% confidence interval = 8.45% to 78.58%, P = .0094). This result demonstrates a PET scan can induce an AR and change cellular response to subsequent radiation exposures. PET indicates positron emission tomography; PHA, phytohemaglutinin; SKY, spectral karyotyping; 18F-FDG, fluorodeoxyglucose.

The relationship between observed chromosome break and dicentric chromosome frequency within the samples exposed to 2 Gy (Pre-PET + 2 Gy and Post-PET + 2 Gy). Lymphocytes isolated before (Pre-PET) and after (Post-PET) a PET scan were exposed to 2 Gy of gamma radiation in vitro using a 137Cs source (661 keV) at a 0.1 Gy/min dose rate. Following stimulation with 25 μL/mL PHA; culture for 47 hours at 37°C, 95% humidity, and 5% CO2; and treatment with 10 μL/mL of colcemid for 45 minutes, cells were harvested according to conventional cytogenetic techniques, and slides were made and processed for SKY according to manufacturer instructions. The number and type of observed chromosome aberrations, plus the minimum number of breaks needed to create them, were recorded for high-quality metaphases (n = 276-330). Generalized Linear Mixed Modeling (R, version 2.12.2) showed a significant relationship (P = .0169) between observed break and dicentric chromosome frequency described by the equation
γH2AX Foci Formation
Six of 10 patients show a marked increase in γH2AX foci formation following a PET scan exposure, 1 patient had a marked decrease in foci formation after the scan, and 2 patients displayed no change (Figure 5). A weakly positive but statistically insignificant correlation was observed between the injected 18 F-FDG activity level and γH2AX foci formation (ρ = .28, P = .24; Figure 6). A more positive but still insignificant correlation was observed between γH2AX intensity and apoptosis levels (ρ = .54, P = .11; Figure 7)

γH2AX foci intensity in lymphocytes isolated before (Pre-PET + 0 Gy, Control) and after (Post-PET + 0 Gy, Exposed) a PET scan procedure, as measured by the H2AX Phosphorylation Assay Kit (Flow Cytometry). Mean channel values for quadruplicates were averaged and normalized to an antibody control tube specific to each sample and donor. Error bars represent the standard error of the mean. Lymphocytes were processed for measurement directly following isolation from whole blood using Histopaque-1077 and resuspended at 5 × 10 5 cells/mL in complete Rosewell Park Memorial Institute medium. PET indicates positron emission tomography.

Normalized γH2AX intensity following a PET scan (Post-PET; Figure 5) plotted against the megabecquerel (MBq) activity of the FDG injected for each donor. Error bars represent the standard error of the mean. A weakly positive but statistically insignificant correlation can be observed (Pearson product–moment correlation coefficient, ρ = .28, P = .24). PET indicates positron emission tomography; FDG, fluorodeoxyglucose.
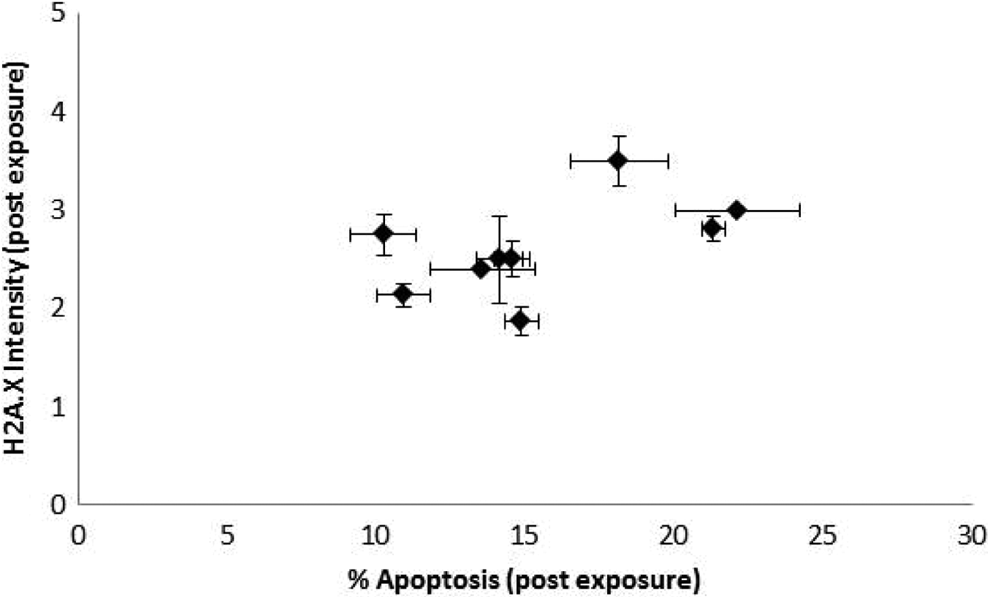
Normalized γH2AX intensity and apoptosis levels following a PET scan (Post-PET; Figures 1 and 5) for each donor. Error bars represent the standard error of the mean. A positive but statistically insignificant correlation can be observed (Pearson product–moment correlation coefficient, ρ = .54, P = .11).
Discussion
The aim of this study was to determine whether exposure to 18 F-FDG during a PET scan can cause acute changes in lymphocyte apoptosis, chromosome stability, γH2AX foci formation, or modify their response to subsequent radiation exposure. This work complements previous reports investigating 131Iodine treatments measuring apoptotic changes, 12 chromosomal damage, 11 and γH2AX foci formation in patients receiving CT imaging. 13,19
Acute Effects of PET Scan
Apoptosis
No change in apoptosis was seen as a consequence of the 18 F-FDG radionuclide injection. This result indicates that either there was insufficient damage to induce an apoptotic response or that the cells endogenous protective mechanisms were sufficient to offset the effects of the PET scan. A lack of elevated levels apoptosis in lymphocytes, which are quite sensitive to radiation, indicates that the exposure associated with a PET scan may not be deleterious. The interdonor variation suggests factors specific to each individual play a considerable role in the apoptotic response. This includes methodological factors, such as the specific activity of the 18 F-FDG injected, as well as biological factors, or individual radiation response.
Chromosome damage
The lack of any significant difference in observed chromosome aberrations between Pre-PET + 0 Gy and Post-PET + 0 Gy samples suggests a PET scan does not result directly in chromosome damage and instability at the doses investigated. Analysis of the SKY data was designed to allow individual variations and reveal general trends across donors. Therefore, this conclusion still allows for the possibility that any given individual could have either a positive or a negative change in chromosome aberrations as a result of a PET scan. Previously published guidelines regarding radiation exposure and biological dosimetry predict a similarly low number of chromosome aberrations within the dose range of a PET scan. 20 Due to the expense and time commitment of SKY, this experiment was limited to 4 patients. Additional applied studies with larger cohorts should be completed to confirm the current result.
Both the Pre-PET + 0 Gy and Post-PET + 0 Gy samples displayed a low frequency of chromosome aberrations. This is not unexpected, due to the level of detail provided by SKY, the number of metaphases analyzed, and the general age range of our donors. 21,22 Some of the observed aberrations could represent previous exposure to DNA damaging agents or lifestyle factors. To our knowledge, these patients did not have exceptional histories in this regard and had not previously received chemotherapy or radiation therapy; however, their exact histories were not confirmed.
γH2AX foci formation
Changes in γH2AX foci levels following the PET scan were quite variable between donors: 6 of 10 donors displayed a significant increase, 3 of 10 had no change, and 1 of 10 showed a decrease in the number of foci in the Post-PET sample. Similar to the result seen with apoptosis, an observation of large interdonor variation suggests a number of methodological and biological factors are at play. For example, we have previously reported on the individuality of DNA repair capabilities and antioxidant levels. 23 The apparent increased magnitude of variation between Pre-PET and Post-PET γH2AX values, as compared to those seen by apoptosis, is most likely explained by the intrinsic characteristics of each technique. Phosphorylation of the H2AX histone at the site of double-strand DNA breaks generates γH2AX, which makes it an essentially continuous variable produced at a low threshold (single DNA breaks); conversely, apoptosis is a binary outcome with a considerable threshold.
Previous research by Löbrich et al showed a good correlation between the dose of radiation received during a CT scan and γH2AX foci formation. 19 In the present study, only a weak positive correlation was found between the injected activity of 18 F-FDG and foci formation. This discordance is most likely due to the different nature of radiation exposure received from each imaging modality. The PET scan imaging involves an injected radionuclide that emits as it circulates in the blood stream and bioaccumulates in hypermetabolic tissue. The dose rate of the injected radionuclide is considerably lower than those received during a CT scan, which significantly alters tissue response to the radiation exposure. 24 This combined with differences in the physical habitus of the patient, or variations in metabolic uptake rate, could significantly alter the distribution of radiation emission.
Combined acute effects
For the patients who had increased γH2AX foci formation in the Post-PET samples, the question becomes what happens to the damage. If it is repaired correctly, or eliminated via apoptosis, then the damage may have no consequence to the cell or organism as a whole; however, if the damage persists, or repaired with error, then it leaves open the possibility of future consequences.
One way of investigating this question is to determine whether cells with DNA damage, such as γH2AX foci, are more prone to enter the apoptotic pathway. Previous research by Huang et al demonstrated that apoptosis is associated with increased levels of γH2AX phosphorylation. 25 To explore this in the current study, γH2AX Post-PET and apoptosis Post-PET + 0 Gy levels were compared, and a positive correlation was suggested between the 2 end points. The lack of a significant difference in observed chromosome breaks between the Pre-PET + 0 Gy and Post-PET + 0 Gy samples also suggests the damage seen by γH2AX is either properly repaired within the proliferative component of the sample or that damaged cells are not entering the cell cycle. With additional donors and a wider spectrum of DNA damage, a more accurate and potentially statistically significant model could be made between these 3 markers of cell damage.
Adaptive Response
Adaptive response refers to the ability of a given radiation exposure to induce change in the response of cells to subsequent exposures. Cells exposed to a small, initial priming dose of radiation incurred less overall damage when given a subsequent, larger, challenge dose, is classed as an AR. This effect has been documented with multiple agents including [ 3 H] thymidine, 26 low-dose X-ray radiation, 27 and is thought to be dependent on the dose and type of radiation as well as the timing between exposures. 28 Human lymphocytes have been previously used to study induced ARs. Cregan et al found evidence of adaptation in a subset of donors when human lymphocytes were given an in vitro adapting dose of 0.1 Gy, left to incubate, and then challenged with a 2 Gy dose. 29 The adaptation was seen as an increase in apoptosis levels compared with the nonexposed sample. Monsieurs et al studied patients receiving 131I treatment by taking blood samples before and 1 week after the radionuclide injection and challenging them with 0.5 and 1 Gy doses. 12 In 8 of 20 patients, a decrease in micronuclei was seen in the blood samples that had been exposed to the iodine exposure when compared to the control. The ability for chronic low-dose radiation exposures to adapt human lymphocytes has also been studied. A study performed in Argentina took peripheral lymphocytes from 21 long-haul aircrew members and 15 healthy matched volunteers. 30 Aircrew were found to have a higher frequency of spontaneous dicentrics and ring chromosomes than matched controls independent of age. Interestingly, spontaneous chromosomal aberrations were also significantly inversely proportional to the number of flight hours that the crew member worked. This result could represent an AR from the chronic low-dose radiation exposure. Both groups displayed similar breaks per cell, but aircrew were significantly more sensitive to an in vitro bleomycin exposure at the G0 stage of the cell cycle when measured by dicentric and ring chromosome frequency.
Apoptosis and AR
No difference in apoptotic response was seen between the two groups, indicating that the 18 F-FDG exposure had not altered the apoptotic mechanism. In comparison to Cregan et al, the lymphocyte is exposed to a dose and dose rate much lower than 0.1 Gy during a PET scan. 29 Additionally, the current study used a different technique to measure apoptosis at 44 hours and not 24 hours.
Chromosome damage and AR
A significant decrease, or AR, was observed when the chromosome damage between the Pre-PET + 2 Gy and Post-PET + 2 Gy samples. Although only 4 donors were investigated in this aspect of the study, all 4 clearly shared the same trend and the analytical strategy was designed to focus on population average effects rather than individual variation. Additionally, magnitude of the AR following a PET scan was considerable, and Post-PET samples had, on average, nearly a quarter fewer observed breaks (22.86%, 95% confidence interval = 9.45%-37.92%), and an even larger decrease in observed dicentrics (39.16%, 95% confidence interval = 8.45% to 78.58%). Although additional experiments are necessary to confirm this result and investigate it further, the findings of this preliminary study strongly suggests the average response to a PET scan includes a robust and considerable AR to chromosome damage.
None of the donors in the SKY cohort (F, G, H, I) displayed a significant increase in apoptosis between the Pre-PET + 2 Gy and Post-PET + 2 Gy samples. This suggest the observed AR is not due to the elimination of cells by apoptosis and is more likely the result of the upregulation or activation of repair pathways by the initial priming dose of radiation (PET scan). Future studies may find it beneficial to utilize a more cost- and time-efficient marker to investigate chromosome damage. Although SKY greatly facilitates the identification of chromosome aberrations at an unprecedented level, it requires specialized equipment, reagents, a lengthy protocol, and significant training for consistent analysis. The dicentric chromosome assay uses simple solid staining to gauge chromosome damage and is frequently used to estimate radiation damage. 31 In the current study, SKY was chosen because of the greater level of detail it provides; however, after analyzing the data, there is strong evidence that the detail provided by SKY was not necessary for this experiment, and a dicentric assay alone would have been sufficient.
Conclusion
The biological consequences of a diagnostic 18 F-FDG PET scan were studied in patients by measuring induction of apoptosis, chromosome aberrations, and γH2AX foci formation. Apoptosis was not influenced by a PET scan exposure, and there was no evidence of an AR for an apoptotic end point. Exposure to a PET scan caused no direct increase in chromosome aberrations and resulted in a significant, protective AR to chromosome damage during a subsequent in vitro challenge irradiation. γH2AX foci formation was variable between individuals, and no significant trend was observed. Additionally, the dose–response curve between γH2AX foci formation and injected activity was only loosely proportional to calculated dose, which suggests donor-specific factors can significantly impact the exact response to the lower dose rate of this injected radionuclide. In conclusion, this study found an interesting modification of cellular response to subsequent radiation exposure and individual variation in response but no evidence of adverse effects following a standard 18 F-FDG PET scan.
Footnotes
Acknowledgments
Sincere thank-you to Mary Ellen Cybulski and Nicole McFarlane for their important technical contributions to this study. Additional thanks go to the tireless staff at the Juravinski Cancer Centre.
Declaration of Conflicting Interests
The author(s) declared no potential conflicts of interest with respect to the research, authorship, and/or publication of this article.
Funding
The author(s) disclosed receipt of the following financial support for the research, authorship, and/or publication of this article: This work was supported by the National Sciences and Engineering Research Council of Canada (NSERC) and NSERC Industrial Research Chair.