
Abstract
The textile industry is particularly vulnerable to problems in subcontractor selection, where choices are critical and must be made regarding quality, price, and delivery time. In this paper, we used a hybrid model of fuzzy Logic and ant colony optimization (ACO) to address the problem of subcontractor selection. Fuzzy Logic was used to make the ratings of the subcontractors less precise due to the uncertainty in the evaluation process and the subjective factors such as quality, price, and delay. This method enables decision-makers to develop a more sophisticated decision-making framework by translating qualitative judgments into quantitative ratings. At the same time, the ant colony system uses a swarm intelligence approach to search for possible subcontractors. It improves the selection process based on the pheromone implementation and the adaptive path planning. The integration of these two methodologies allows for a more effective decision support system for subcontractor evaluation and, consequently, improves the company’s overall operations. This article presents a real-life case study of a textile company that demonstrates the feasibility of this hybrid model and the better results obtained in subcontractor selection compared to human decisions. The results show that the system designed in this paper reduces costs and improves suppliers’ quality and delivery times, thereby enhancing the textile firm’s competitiveness. The analysis of human expertise versus the hybrid Ant Colony Optimization and fuzzy logic system reveals enhanced performance across delays, defects, and costs. The comparison between Algorithm Optimization and Human Decision-Making reveals an 8.25% total improvement. The algorithm outperforms human decision-making by reducing delays by 9.87%, costs by 17.97%, and defects by 2.55%. This paper provides a basis for future research on improving supply chain management decisions using intelligent systems.
Introduction
Motivation
The textile and apparel industry relies heavily on subcontractor selection, as it determines product quality, delivery times, and, most importantly, production costs. As a result of globalization, companies face increased competition, so they have to use proper frameworks for selecting subcontractors based on price, quality, and delay. This process is complicated because several qualitative and quantitative factors pose significant uncertainty to the system, and thus require sophisticated approaches. Standard decision-making tools often fail to address such cases, leading to the recommendation of discovering and implementing new technologies.
Literature review
The latest research demonstrates that Fuzzy Logic, together with the analytical hierarchy process (AHP) and ant colony optimization (ACO) models, proves highly effective for addressing these problems. Mathematical programing models serve to optimize problems that occur within the textile supply chain. The models proved essential for deciding how to produce and distribute fibers. The growing requirement for sustainable optimization approaches shows potential research paths according to Alves et al. 1 Haldar et al. contend that incorporating sustainability into the decision-making process is essential to make the textile industry more sustainable over the long term. 2 Fuzzy logic was used in supplier selection because it can handle partial or imprecise performance measurements. Fallahpour et al. created an integrated model that combines fuzzy inference systems with the fuzzy best-worst method to evaluate suppliers based on sustainability. 3 Similarly, Abbasianjahromi et al. classified the selection criteria using the Analytic Hierarchy Process and explained how fuzzy set theory can be applied to multicriteria decision-making. 4 Fuzzy logic, according to Kargi and Öztürk is crucial for decision-making, mainly when the environment, including the textile industry, provides ambiguous information. 5 Keršulienė and Turskis pointed out that there is a need to have strong standards in decision-making and, therefore, presented a fuzzy multicriteria decision-making approach with its evaluation algorithm that combines several methods for the candidate evaluation. 6 Koprulu and Albayrakoglu proposed an AHP model for supplier selection, evaluated a supplier relationship management strategy that defines strategic objectives, suggests weights for supplier selection criteria, and discussed the implications for pragmatic application. The construction industry has provided extensive analysis of subcontracting practices, as general contractors manage subcontractors while being responsible for time, cost, and quality. 7 Polat et al. highlighted that the literature on subcontractor selection was categorized into studies identifying selection criteria and suggested methodologies for choosing subcontractors for specific work packages. 8 Their research utilized a genetic algorithm to select subcontractors for all work packages in a real-life project, employing actual data on various subcontractors. In another study, Polat highlighted the need to choose qualified subcontractors. He proposed a decision-making approach that integrates AHP and Preference ranking organization method for enrichment evaluation (PROMETHEE) for the effective selection of subcontractors, which has been applied in an international construction project. 9 Lahdhiri et al. presented two models—Fuzzy Logic and the Analytic Hierarchy Process (AHP)—to assist in subcontractor selection within the textile industry. The fuzzy model achieved a predictive performance of 77% but encountered challenges in defining membership functions and defuzzification. In contrast, the AHP model attained a higher accuracy of 87%, highlighting the limitations of relying solely on fuzzy logic. 10 In another context; Kao dedicated his research to exploring the consequences of the COVID-19 pandemic on supplier selection processes within the clothing and textiles industry. The research contributed to the development of a new multicriteria decision-making method that assists decision-makers by combining fuzzy TOPSIS and multisegment goal programing. This method integrated qualitative and quantitative criteria and demonstrated effectiveness. 11 Lahdhiri et al. underscored the gap in the literature regarding supplier selection within the clothing industry. They recommended using hybrid multicriteria decision-making models such as AHP-TOPSIS, AHP-WSM, and AHP-WPM to evaluate suppliers. They defined important criteria, offering a new, valuable framework to apparel manufacturers and other industries. 12 Keshavarz-Ghorabage et al. emphasized the need for the right choice of subcontractors for successful construction projects since this enhances quality and boosts the reputation of the leading contractors. They suggested using the evaluation based on the distance from the average Solution method to solve fuzzy dynamic multicriteria group decision-making problems, enabling the evaluation over time. A numerical example illustrates how the method can aggregate the inputs of decision-makers over subcontractor evaluation to facilitate better decision-making. 13 In the textile domain, Ersoy and Dogan drew attention to supplier selection and performance evaluation in the blanket industry; they applied Fuzzy-AHP and Fuzzy data envelopment analysis (FDEA) in their study and provided directions for future research. 14 Sanayei et al. dealt with supply chain problems regarding supplier selection, especially the discord between quantitative and qualitative measures. They explained the multi-criteria decision-making (MCDM) hierarchy model by applying the theory of fuzzy sets and the VIKOR method. It accommodated conflicting criteria and attempted to find ideal solutions using trapezoidal or triangular fuzzy numbers for evaluation. 15 Chan et al. found in their research a high correlation between global supplier selection and the supply chain’s overall competitiveness. Indeed, they highlighted the supplier’s decision variables, including the political and economic environment and infrastructure. Utilizing triangular fuzzy numbers and pairwise comparison matrices, they developed a model that, taking into account the different nature of the supplier selection problem, could handle the manufacturing context in terms of various decision-making perspectives in both quantitative and qualitative judgments based on fuzzy-AHP. 16 Yücenur et al. built upon the global supplier selection problem by using fuzzy-AHP and analytic network process (ANP) models, emphasizing the weights of the linguistic variables. The fuzzy-AHP model was used to measure criteria such as the level of services being provided and risk factors. 17
In the study of Luan et al., the Ant Colony Optimization (ACO) algorithm is used to tackle the complex supplier selection problem by efficiently exploring an ample solution space through pheromone trails. ACO improves decision-making by reinforcing successful solutions while encouraging diversity through pheromone evaporation. However, it struggles with slow convergence when used alone due to a lack of initial information. To address this, the authors propose a hybrid approach that combines ACO with a Genetic Algorithm (GA), which generates high-quality initial solutions to enhance pheromone levels, thereby accelerating the search process and improving overall performance. 18 In their research, Asthana and Gupta presented a multi-attribute supplier selection model for the Indian context using genetic algorithm (GA) and artificial neural network (ANN) and quality and service as attributes. They used them to calculate the scores for the automobile industry and rank the suppliers. 19 Yu et al. used a new approach to integrate supplier selection with the risk behavior of decision-makers using ANN, AHP, and TOPSIS. In this approach, risks were classified with ANN, weights were defined with fuzzy AHP, and ratings were evaluated with fuzzy TOPSIS. The test results showed that this methodology was able to integrate risk factors into supplier selection. The result has been achieved by optimizing partner selection in construction through subproject precedence networks. 20 Fuzzy rule quantification has been used for a fuzzy logic-based project scheduling approach to decision-making, as presented by Wang et al. Their fuzzy decision-embedded heuristic genetic algorithm (GA/FD) effectively achieved optimal solutions for large-scale projects, as demonstrated by a case study of a coal-fired power station. 21 Shiau et al. emphasized the need for choosing the right subcontractors and advocating for better tools to manage project complexities in the construction industry in Taiwan. They surveyed 400 companies and identified the key factors in selecting subcontractors, proposing a subcontractor selection system that utilizes an Internet platform for procurement, which can enhance fairness and profitability. 22 Ulubeyli and Kazaz introduced the subcontractor selection model, integrating qualitative and quantitative criteria via fuzzy sets for optimized decision-making in foreign projects. 23 Bulur and Kayar highlighted the importance of multi-criteria decision-making methods in allocating subcontractor work efficiently. Their study provided illustrative examples through comparisons of order allocation using TOPSIS and AHP methods. 24 Other research developed by Çakır introduced a model that combined Fuzzy Preferences Programing (FPP) and Graph Theoretical Matrix Approach (GTMA) in the context of solving multifaceted decision-making problems. 25 Demirkesen and Bayhan used the widely accepted method in the literature, the user-friendly choosing-by-advantages (CBA) approach. 26 In addition, Ramadhani and Handayati analyzed the AHP to improve the selection process. Their approaches provided significant insights from actual situations. 27 Yayla et al. illustrated the use of the generalized Choquet integral methodology to construct a hierarchical model for selecting subcontractors in Turkish textile industry companies. This case study describes the necessity of such approaches when competition is based on price. 28 El-Kholy discussed using AHP in selecting subcontractors, paying particular attention to the V-evaluated subcontractors on their quality, cost, and reliability. 29
The combination of Fuzzy logic with Ant Colony Optimization (ACO) produces better results than using them separately. Fuzzy logic proves suitable for various environments because it efficiently processes uncertain and imprecise data.30,31 The main advantage of this method stems from its ability to model situations with uncertain data which makes it essential for project management and risk assessment applications. 32 Fuzzy logic decision-making effectiveness increases when expert judgments merge with multiple criteria as shown in contractor evaluations and cost management. The implementation of fuzzy logic faces challenges because it requires advanced mathematical understanding which prevents certain users from using it effectively. Decision-making processes become biased when expert selection is inadequate because they rely on subjective judgments. The interpretation of results becomes difficult which restricts the practical use of this approach. Traditional statistical models are more appropriate for environments that have precise quantitative data available.33,34 The road infrastructure sector benefits from fuzzy-based models that produce accurate predictions about costs and timelines. 35 The system shows flexibility in supply chain management and real estate project profitability assessment.36,37 ACO demonstrates exceptional performance in solving combinatorial problems while handling dynamic environments but requires extended convergence times and precise parameter settings. The combined approach enables the solution of multi-objective issues that aim to minimize costs while enhancing customer satisfaction.38,39 The combination of ACO with fuzzy logic creates an effective method for handling complex problems while achieving optimal performance and managing uncertainty. The combination of fuzzy logic with ACO produces more accurate results while enabling adaptive optimization and easier management of complex constraints.40,41 The research by Tešić et al shows how fuzzy logic enhances MCDM through triangular fuzzy numbers with variable confidence intervals to calculate criteria weights. The method enables quantitative assessment of uncertain and qualitative data which results in improved decision accuracy when using Fuzzy Complex Proportional Assessment (COPRAS) for sustainable mobility. 42 Zhang et al. developed a mixed-integer programing model to optimize sustainable supply chain networks by reducing costs and pollution while increasing labor opportunities through Chaotic Particle Ant Colony Optimization which outperforms conventional approaches. 43 Qiu and Huang use fusion ant colony algorithms to enhance mechanical design and manufacturing systems through efficiency and productivity gains despite their complex implementation requirements. 44 Shezan et al. developed solar-wind hybrid microgrids for remote Malaysian communities using PID and fuzzy logic controllers, ensuring stability and economic benefits under various conditions. 45 Sheykhan et al. developed a comprehensive model to achieve sustainable competitive advantage by using multiple MCDM tools to evaluate critical factors, including corporate social responsibility and green marketing, for developing actionable recommendations to enhance brand image. 46 Vashishtha, Gupta, and Mittal perform a thorough review of fuzzy logic-based sentiment analysis to show its effectiveness in improving subjective opinion accuracy and develop five distinct method categories for enhanced understanding and application. 47
In our study, we determined the historical performance of each subcontractor to calculate their cost and performance indices for delays, prices, and defects while considering all historical parameters. We analyzed their historical work performance by examining both their delay duration their pricing structure and defect occurrence. Using these necessary elements that represent the performance index of each subcontractor regarding delays and prices, we calculated the overall performance index using fuzzy logic methods, following specific rules. We analyzed the various production orders within each schedule and assessed the quantities of each order, including the days of work and the allowable delay days. This means we can have some delays and the basic price for the production order, as well as the tolerable price that the subcontractor can execute the order with, along with the percentage of tolerated defects. All of this allows us to calculate related indices for each subcontractor based on their indicators of delays, costs, and defects. Then, we combined these three parameters to obtain a global performance parameter for each subcontractor for every production order, encompassing the performance indices related to delays, costs, and defects.
We applied ant colony techniques to find an optimal path after collecting all required data for each subcontractor including performance indicators for each production order. The heuristic matrix requires calculation through the performance indices ratio of subcontractors. We developed a matrix that connects each subcontractor’s performance index to all presented production orders using all previous calculations. The ant colony advantages enable us to find the shortest path which in our scenario corresponds to selecting subcontractors with lower performance indices. The ant colony calculations lead to a defined path which determines the production order sequence from first to last while the ants select the most suitable subcontractor path across multiple iterations until we reach the optimal solution.
Our method provides several advantages over existing literature. The method combines fuzzy logic with Ant Colony Optimization to create a strong framework for decision-making under uncertain conditions. The assessment of subcontractor performance becomes more complete because our method evaluates multiple criteria at once. Our method improves the objectivity and transparency of selection procedures by reducing the subjectivity that traditional methods commonly present. Our research presented a fresh approach to calculate performance indices and their connection to production orders which previous studies have not fully investigated. Our research adds new knowledge and methods to the field which improves subcontractor selection for complicated construction projects.
Our research aims to investigate the application of ant colony optimization and fuzzy logic systems in one model that combines the two methods to select the best subcontractors. It discusses the application of these approaches in detail and their advantages. This article aims to enhance the subcontractor selection process in the textile supply chain by identifying current challenges and proposing detailed solutions to address these issues effectively.
Materials and methods
Materials and software used
In this study, we used a laptop equipped with advanced hardware components. The computer operates at a speed of 2.60 GHz, utilizing an Intel Core i7-9750H processor to execute complex tasks, and features 16 GB of RAM. In addition, it is equipped with a NVIDIA GTX 1650 graphics card. The laptop is characterized by a 512 GB SSD enables fast data access and reduces application loading times, improving research efficiency and productivity. To make all the necessary calculations, we utilized MATLAB software.
Methods used
To conduct our study, we employed several methodologies.
Fuzzy logic
Fuzzy Logic is a reasoning framework for incoherent or imprecise information. In contrast to classical Logic, which uses binary true or false values, Fuzzy Logic permits degrees of truth from 0 to 1 to be considered. It can be utilized within the control handles of a system, artificial intelligence, or even the recognition of patterns. The essential steps of fuzzy logic include the following:
Fuzzification
This step converts precise numeric inputs into indeterminate fuzzy values. Each input is assigned a membership function that defines its degree of membership in a fuzzy set, ranging from 0 to 1.
Applying fuzzy rules
The fuzzified values undergo manipulation through fuzzy rules, which are referred to as predefined “If and then” rules. The rules define system responses across different conditions.
Inference
Fuzzy inference is the process of formulating the correspondence between a given input and an output using fuzzy logic. This correspondence then provides a basis for making decisions or discerning trends.
Defuzzification
Defuzzification is the process of producing a quantifiable result in clear logic, from fuzzy sets and their corresponding membership degrees. It is the process of mapping a fuzzy set to a clear set.
Ant colony optimization
Ant colony optimization (ACO) is a metaheuristic optimization algorithm inspired by the foraging behavior of ant colonies. It relies on the fact that ants deposit and follow pheromone trails when searching for food for other ants. ACO has been successfully applied to various combinatorial optimization problems, such as the traveling salesman problem (TSP) and routing problems. This algorithm models “artificial ants” that move through the search space and accumulate pheromone concentrations along their paths, thus converging on a satisfactory solution or, more often, on a set of very similar solutions.
Initialization
○
○ The system begins with a specified number of ants along with parameters, which include pheromone evaporation rate (ρ), pheromone importance (α), and heuristic importance (β).
Solution construction (ants’ path building)
○ The process begins with ants starting at random positions or designated beginning points before they construct their paths by transitioning between different states.
○ The path selection depends on the pheromone level and Heuristic information.
Pheromone update
Once all ants have completed their solutions (paths), the pheromone levels are updated:
■
■
Evaporation
○ The traces of pheromones evaporate naturally over time, reducing their impact. This reduces the effectiveness of less-than-optimal solutions and encourages the exploration of new ones.
Termination
The algorithm terminates when a stopping criterion is met. Common stopping criteria include:
■ A maximum number of iterations.
■ Convergence to a solution.
■ Reaching a predefined optimal solution.
Research methodology: Process
The process of our research methodology is illustrated in the following figure:
Figure 1 demonstrates how fuzzy logic merges with Ant Colony Optimization (ACO) to solve subcontractor selection and production planning problems. The Fuzzy Inference System (FIS) receives Delay, Price and Defect as input variables while the fuzzy rules determine the Global Score computation. The ACO parameters receive their initial values before initiating an iterative process that enables ants to select subcontractors based on transition probabilities. The algorithm performs pheromone updates while it searches for the most cost-effective path. The final output shows the optimal path together with its cost value and a convergence curve that tracks the best costs throughout the iterative process.

The overall research process.
The subcontractor path describes the order of subcontractor selection for projects through their performance-based evaluation of delays and prices and defects. The ACO algorithm uses this path to determine the best sequence of subcontractor selection for completing production orders or specific tasks. The path emerges from repeated evaluations of subcontractor contributions and costs until it selects the combination that produces the best results for project delay reduction and expense control and quality enhancement.
Results and discussions
Determination of performance indicators for subcontractors
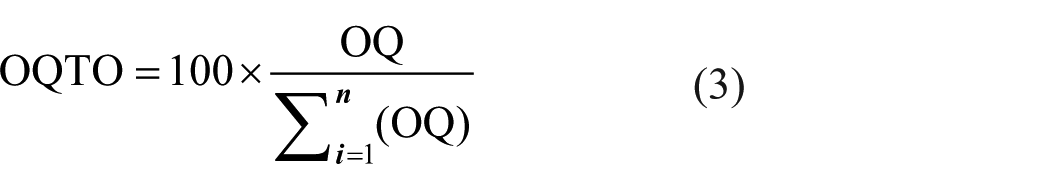
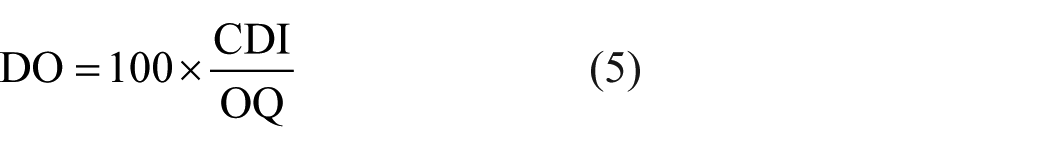
This step is crucial for the rest of the work, as it highlights the need to identify indicators for each parameter related to subcontractors. This helps determine appropriate methods for measuring their performance, in order to make informed decisions. A systematic approach to subcontractor evaluation significantly improves partner selection and project execution. In this section, subcontractor performance indicators are presented in equations (10)–(12).
Table 1 provides a clear and concise summary of the key indicators associated explicitly with subcontractor 1 (S1). This data will help us assess its performance, identify its strengths and weaknesses, and optimize the management of outsourced work.
Order performance metrics overview for subcontractor 1.

The parameters defined here are:
-
-
-
-

-
-
-
-
-

-
-

-
-

Based on the previous formulas and equations, we calculated each subcontractor’s relative delays, prices, and defect levels by analyzing their past performance over a set period according to the following formulas:


Where:
n: represents the number of production orders

After applying all the necessary calculations related to the subcontractor data, the following key results were obtained and are presented in Table 2.
Results of subcontractor 1 performance evaluation.

The score values represent the essential performance metrics for delays, price, and defects, offering important insights into the efficiency and quality of the order fulfilment process. In our ongoing analysis, we will maintain the same meticulous calculation approach to carefully determine the various parameters for all the textile company’s subcontractors, ensuring consistent and accurate evaluation. Table 3 presents the detailed results of these calculations, providing a clear comparison and understanding of performance across all subcontractors.
Company’s subcontractors score results.

Application of fuzzy logic for determining overall scores for subcontractors
Presentation of the system: Fuzzy logic integration
The calculation of the overall score for each subcontractor is performed accurately using fuzzy Logic, as shown in Table 3. The implementation of this innovative method is described in the sections below
Figure 2 illustrates a fuzzy logic-based system for optimal subcontractor selection using the Mamdani method. It shows how various evaluation criteria are processed to calculate a global score for subcontractors. The Mamdani approach fuzzifies the three input scores using membership functions and then defines fuzzy logic rules that describe how the scores interact to influence the decision. The heuristic algorithms then aggregate and defuzzify the results to produce a global score for subcontractors. This method aids in multi-criteria decision-making by effectively handling the vagueness and ambiguity in evaluating subcontractors.
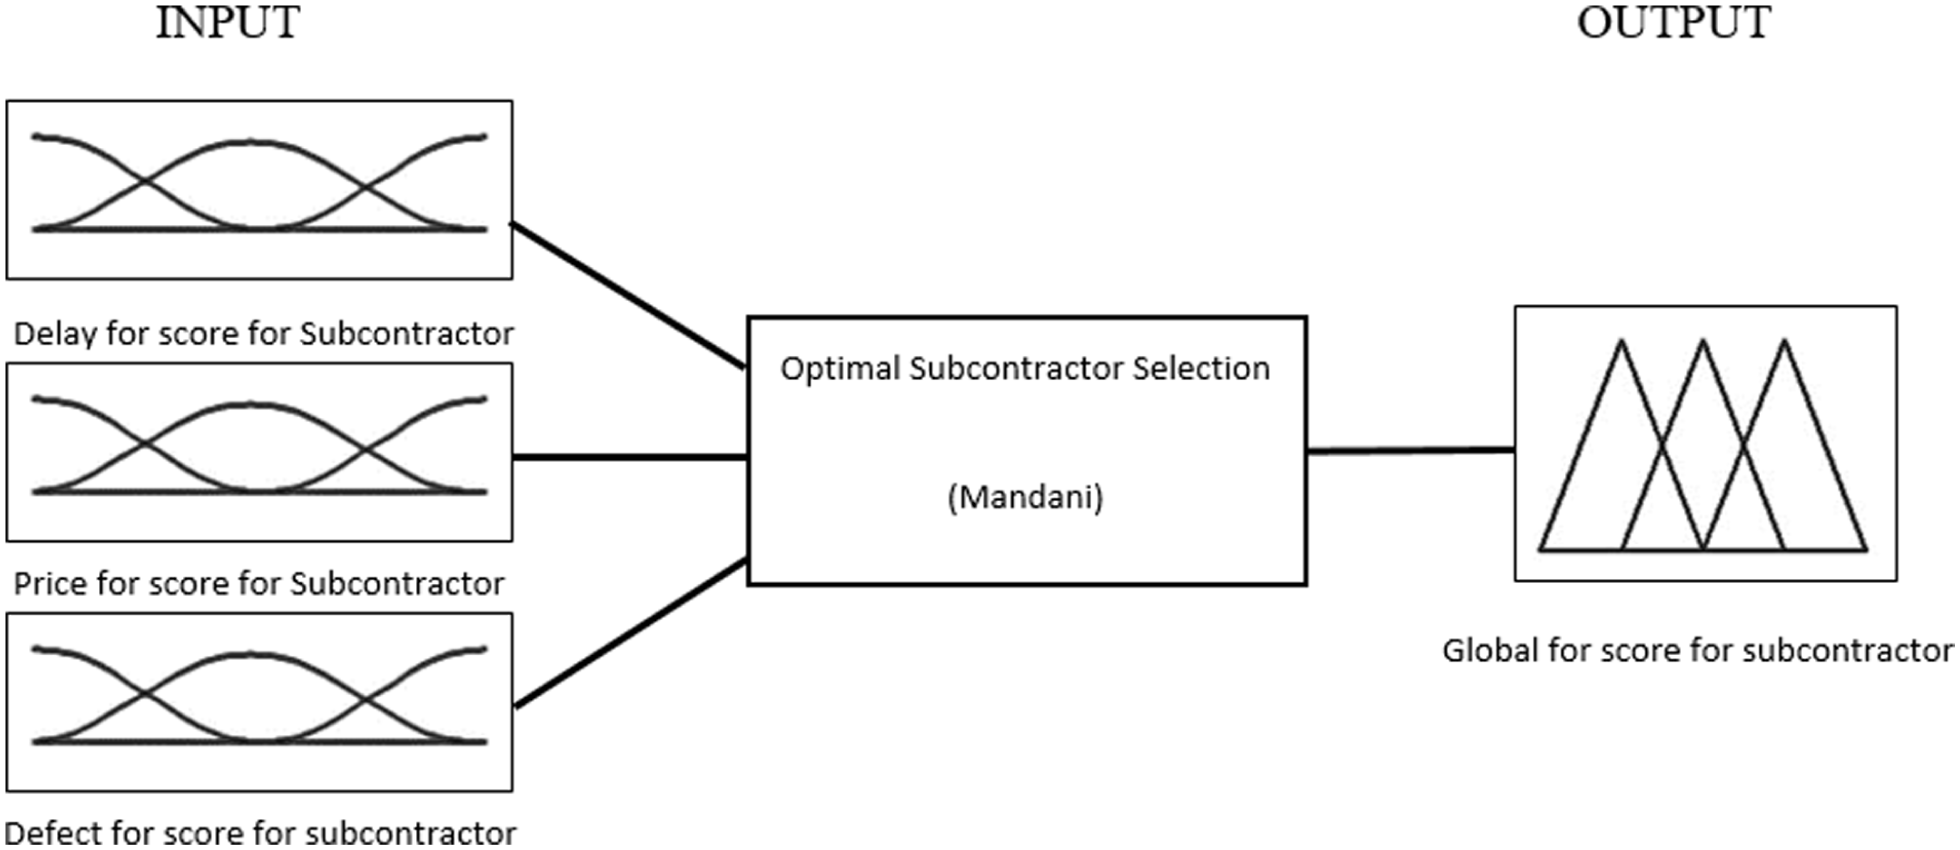
Fuzzy logic-based system optimal subcontractor selection using the Mamdani method.
Membership functions and parameters for subcontractor
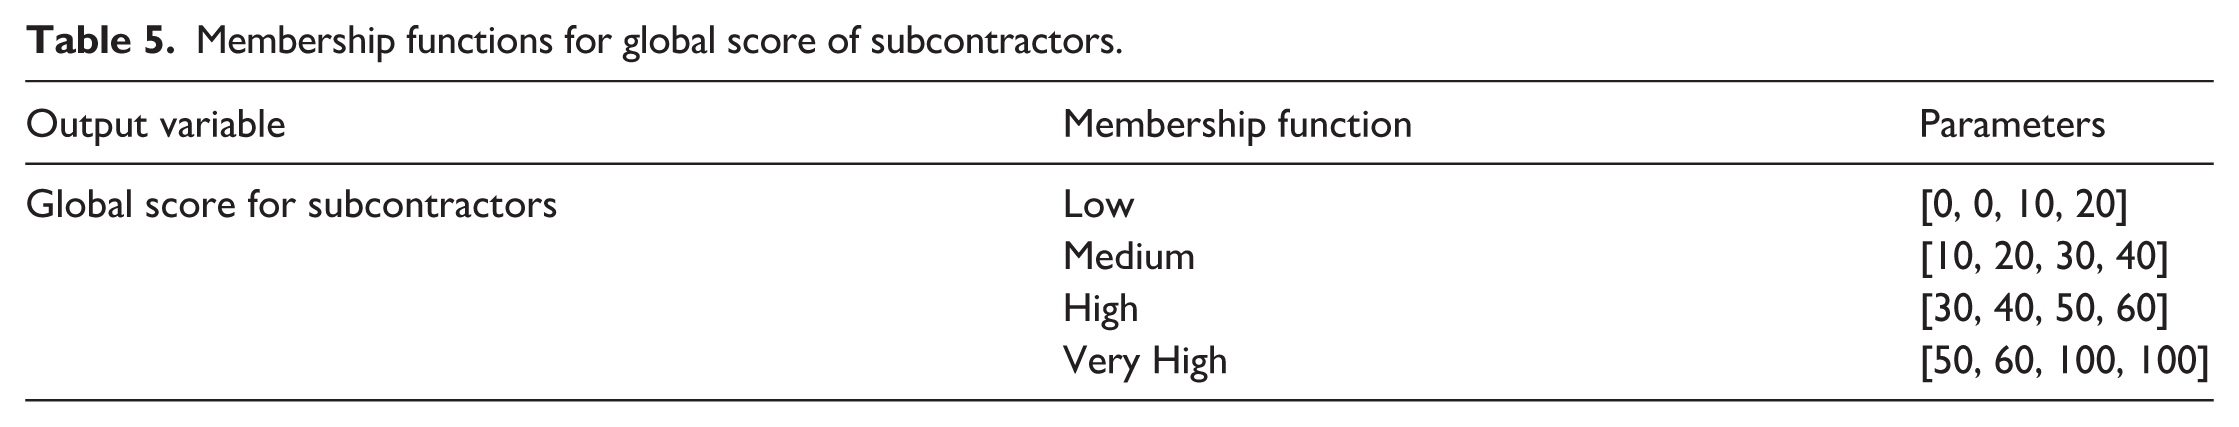
The following section outlines all the membership functions and parameters required to evaluate the subcontractors’ performance scores, as well as the overall score. Table 4 presents the input variables (delay, price, and defect scores) with their associated membership functions and parameters. Additionally, the subcontractors’ overall score, as shown in Table 5, represents a comprehensive assessment of their performance. Thus, these tables provide most of the information needed for the evaluation stage of the proposed methodology for subcontractor selection.
Membership functions and parameters for subcontractor performance scores.

Membership functions for global score of subcontractors.
Membership function plots, as presented in Figures 3 and 4, display the varying levels of input parameters and the overall score, clearly illustrating the application of fuzzy logic in the selection process. These presentations allow us to understand how performance indicators are transformed into relevant information for decision-making.

Membership function plot for input parameters for subcontractors.

Membership function plot for the global score for subcontractors.
The function takes a set of parameters, including delay score, price score, and defect score, for a subcontractor and classifies them into membership levels, as shown in Figure 3. This set of parameters forms the input function for the subcontractor. The scores of three parameters on the right-hand side of the figure have to be defined as Low, Medium, High, and Very High. This presentation facilitates an understanding of the fuzzification of each input and provides a more nuanced evaluation of the subcontractor’s performance based on highly significant parameters. The same set of membership levels was used for the overall performance score of Subcontractors in Figure 4. Understanding these figures deepens our understanding of the fuzzy logic framework used for the subcontractor selection decision-making process at a definitional level.
List of rules used in the fuzzy logic system
Table 6 presents the set of rules for the fuzzy logic system designed to evaluate subcontractor performance. The overall score is calculated by combining delay, price, and defect scores. These scores are then categorized into four levels: low (L), medium (M), high (H), and very high (VH). This helps in the decision-making process by showing the correlation between the input scores and the decisions made, which in turn facilitates the identification of the most suitable subcontractor.
List of rules.

General presentation of calculation systems in fuzzy logic
In this section, we discuss the crucial step of the fuzzy logic system that converts linguistic variables into their corresponding numerical values. This step facilitates efficient data processing within the fuzzy logic system.
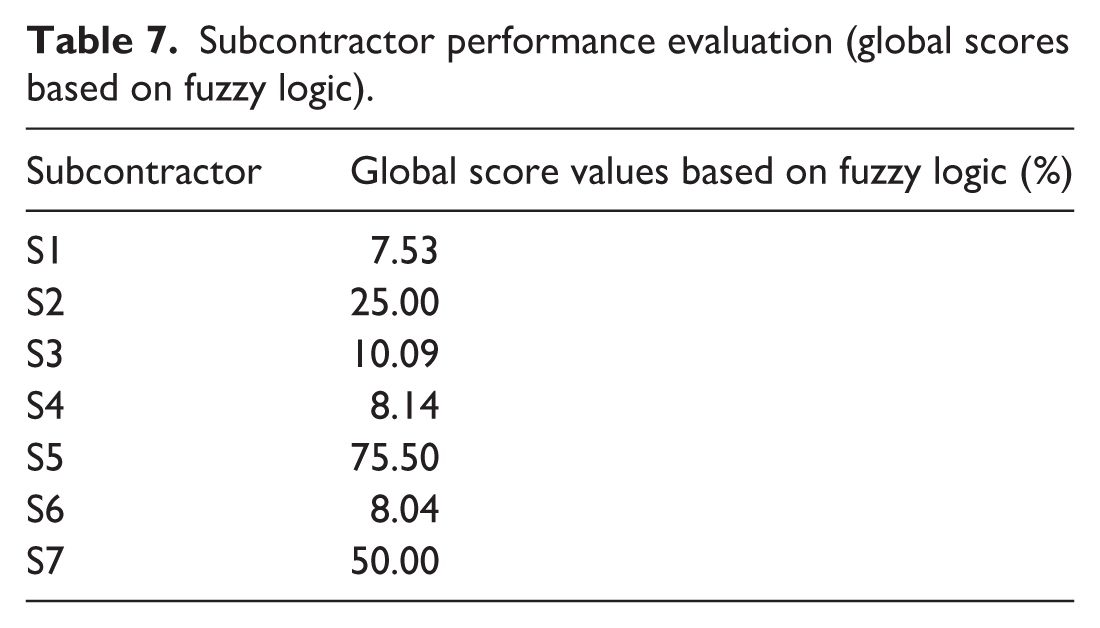
The transformation of linguistic descriptors into numerical values appears in Figure 5. The process begins by converting qualitative assessments into quantitative values by assigning specific numbers to each term. The system can then reverse this process to translate mathematical results into descriptive terms that correspond to the Global Score. The system requires this dual-direction conversion to correctly represent subcontractor performance indicators through fuzzy logic control and achieve user requirements. Subcontractor performance evaluation presented in Table 7 was done using fuzzy Logic system. The outcome of this evaluation is a set of global scores, which collectively indicate the relative performance and dependence of the respective subcontractor.

Presentation of calculation systems in fuzzy logic.
Subcontractor performance evaluation (global scores based on fuzzy logic).
Evaluation of the relationship between delay, price, defect and global score
Figures 6 to 8 illustrate 3D surface plots for delay, price, defect and global score. They are visual relations and help the parties involved understand what these problems are and how efficiently they relate and impact.

3D surface plot of defect scores, delay scores, and global scores for subcontractors.

3D surface plot of price scores, delay scores, and global scores for subcontractors.

3D surface plot of defect scores, price scores, and global scores for subcontractors.
The relationship between defect scores, delay scores, and the global score
The 3D surface plot in Figure 6 represents the relationship between defect scores, delay scores, and the global score for subcontractors.
The plot shows two distinct plateaus, one corresponding to a high global score (yellow) and the other to a much lower score (cyan/blue). This reflection means that subcontractors’ global scores decline significantly, when their delay and defect scores go beyond a certain level. We can observe a threshold effect, which is apparent as a steep drop in the global score when defect and delay scores are too high.
The correlation of delay scores with price scores and the global score
According to Figure 7, as long as the delay scores remain low, the global score is elevated (indicated by the yellow region); however, there is a rapid drop-off in the blue area, which represents a global score that is low when delay scores are high.
There is a striking threshold effect: the global score stays high as long as the delay scores are within a certain limit; however, once the delays exceed 40–50, it drops steeply. Price scores, as shown in the graph, do not seem to contribute to the global score at all, which means that delays are the single most important performance indicator.
The correlation observed between price scores, defect scores, and the global score
The analysis of Figure 8 noted that the global score remains flat at 50 for most of the graph, as represented by the yellow region. This observation suggests that fluctuations in price and defect scores do not significantly impact the performance score. However, there is a sharp drop in the global score when a particular price score (55) and defect score (5–10) are met, suggesting that a possible penalty or threshold exists where certain defect levels dominate the global score.
Application of ant colony program
Algorithm parameters for ant colony optimization simulation”
The algorithm’s parameters are set as follows:
Ants: 10 ants total. (The selection of 10 ants for the Ant Colony Optimization (ACO) algorithm resulted from experimental testing and analysis. The evaluation of different ant numbers through multiple trials revealed that 10 ants delivered the best results regarding solution quality and convergence speed.)
Subcontractors: 7 subcontractors (S1–S7).
Iterations: 1000 iterations.
Pheromone Evaporation Rate: 0.5.
Heuristic Weight (Visibility): 1.
Pheromone Weight: 2.
The pheromone importance (α): 1
The heuristic importance (β): 2
Determination of the heuristic matrix
The heuristic matrix was determined and presented in Table 8. It shows the ratio between pairs of subcontractors’ global scores, which were determined in Table 7. It was calculated using the following formula:

Where:
- Hi,j represents the value of the heuristic matrix corresponding the cell (i,j)
-
-
- G
Heuristic matrix.

Overview of the ant colony optimization process
The ant colony optimization process starts with initialization by setting initial pheromone levels across all paths either uniformly or based on heuristic insights. The process requires defining both the number of ants, the pheromone evaporation rate (ρ), the pheromone importance (α), and the heuristic importance (β). The solution construction process begins with ants starting at random positions or designated starting points before they move between nodes to create their solutions. The path selection process uses probability, which favors paths with stronger pheromone trails and also considers available heuristic information. The probability of choosing a path from node i to node j is calculated using a formula incorporating pheromone levels and heuristic data as presented in equation (1).
Once all ants complete their paths, the pheromone levels are updated. A local update adds a small amount of pheromone along the paths taken by the ants, promoting exploration. The global update strengthens the best paths according to solution quality, which directs future ants to use these routes. The pheromone update rule incorporates evaporation as a natural process to decrease pheromone levels which allows less optimal solutions to fade out while new possibilities emerge. The algorithm operates until it reaches a predetermined stopping condition. The algorithm returns the best solution that it discovered during the entire process.
Determination of the correspondence matrix between subcontractors and orders
To assign subcontractors to each order, we provided a list of orders to be processed, which was detailed in Table 9.
Order production parameters.

In this table, we calculated several parameters that will be used in the next steps of the optimization procedure:

We evaluated each subcontractor’s performance Index for every single order regarding the delay, price and defects. All the results were summarized in Table 10 and determined through the following equations:


Where
- Si represent the ith subcontractor.
- POj represent the jth process order.
- Delay score rate, Price score rate and Defect score rate for a corresponding subcontractor were given from Table 3.
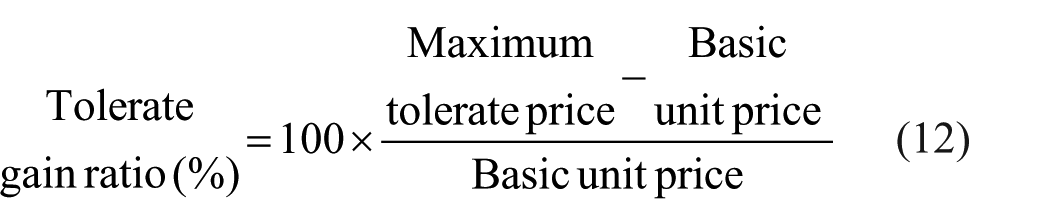
- Tolerate Delay ratio, Tolerate gain ratio and Tolerate defect ratio for a corresponding process order were given from Table 9.
Subcontractors performance Index based on delay, price, and defects.

The Total Performance Index of each subcontractor is presented in Table 11 and determined with the following equation:

Performance index for each subcontractor corresponding to each process order.

Subcontractor selection process results
The purpose of the optimization was to find the best order of subcontractors that result in the lowest Sum of performance Index. Table 12 outlines the best subcontractor selection path, the positions assigned to each subcontractor. The Sum of the performance Index of 17.02 represents the most efficient solution, while maintaining project quality and efficiency.
Optimal subcontractor selection path and corresponding costs.

The optimal path is: S1→S2→S6→S4→S3→S7→S5. The Sum of the performance Index to achieve the optimal path is 17.02, which stands as the best possible solution.
Each column from PO1 to PO7 is a position in the sequence, and the subcontractor and its performance index were described above.
Convergence of subcontractor performance index optimization
In this part, we determined the Convergence of the Subcontractor Performance index Optimization as presented in the following figure:
Figure 9 illustrates the progress of the subcontractor’s Performance index as the order of the optimization algorithm’s functions changes. The horizontal axis represents the number of iterations, while the vertical axis represents the subcontractor’s Performance index.
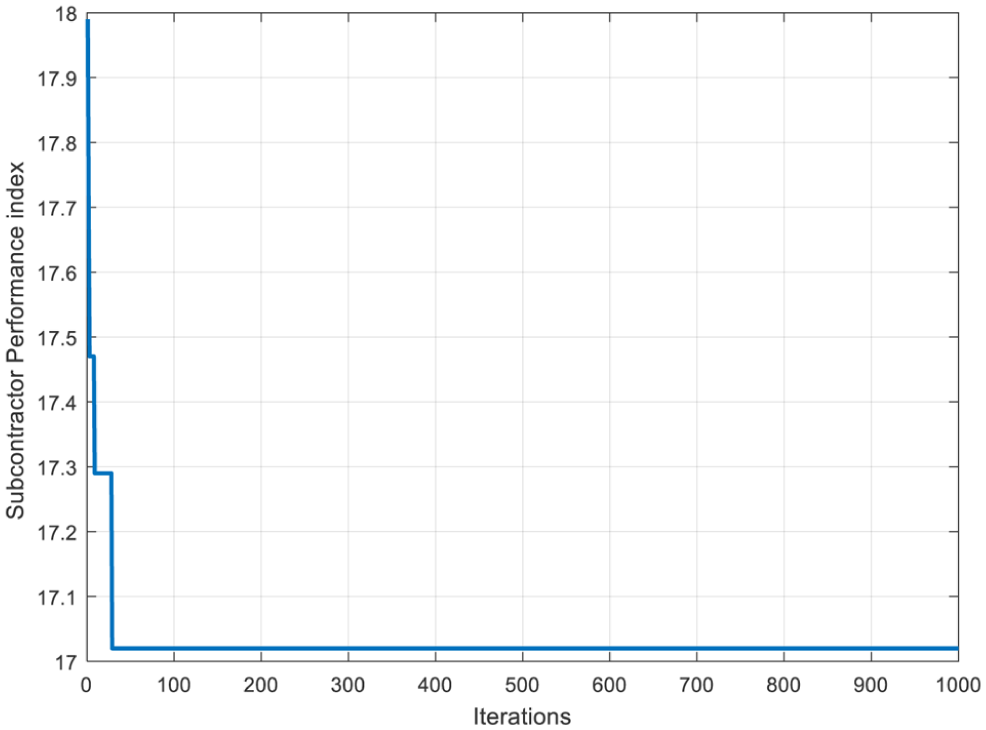
Convergence of subcontractor total performance index optimization over iterations.
Initially, the values are quite high; however, after roughly 29 iterations, it starts to drop significantly and eventually plateaus. This implies that the optimization algorithm can find an improved solution quickly and converge to a near-optimal subcontractor Performance index with stability in subsequent iterations.
Results evaluation
Assessment study
To evaluate our hybrid system, which combines fuzzy Logic and ant colony optimization for optimal subcontractor selection and various order distribution, we aim to achieve a high-reliability level in quality, minimal defects, and low delays.
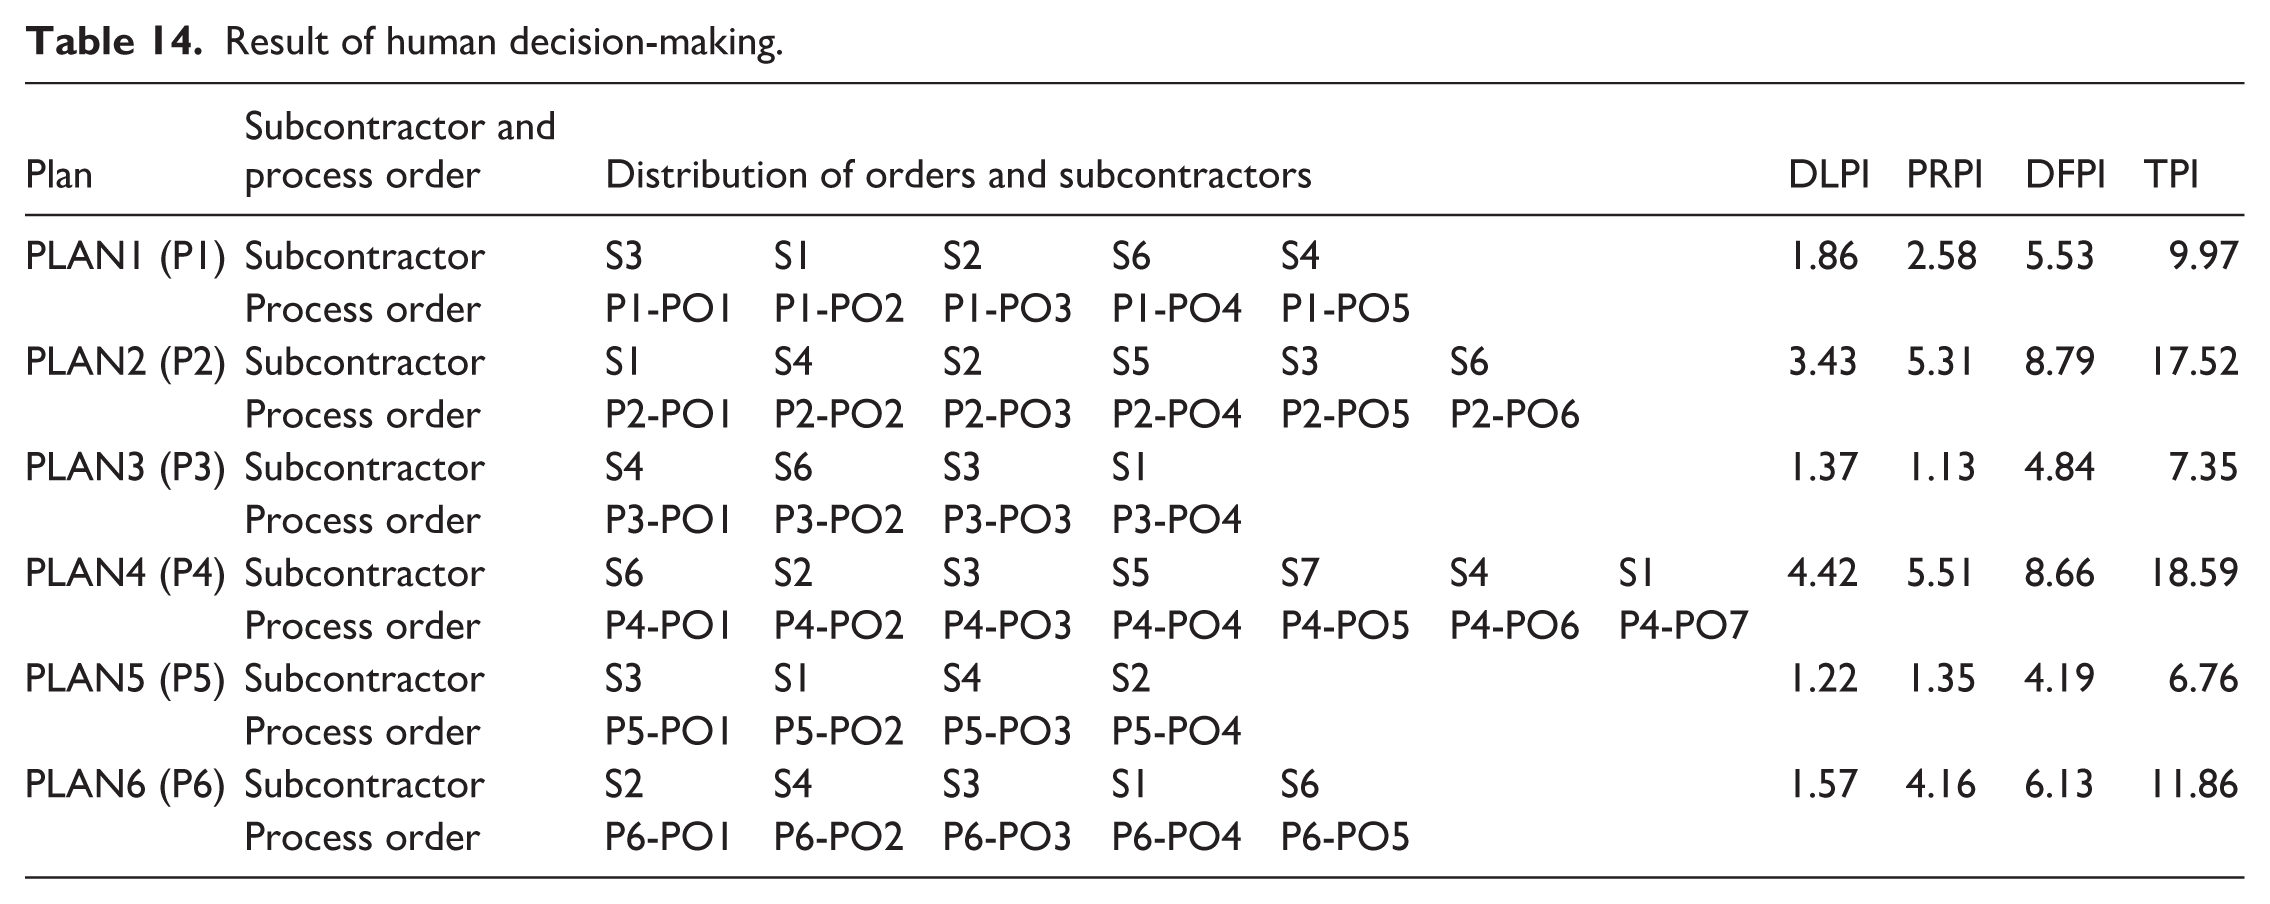
For this evaluation, we analyzed a set of schedules, each with a specific number of orders. We compared our algorithm with those validated by a logistics manager who used personal judgment. This comparison helped assess the effectiveness and efficiency of our hybrid approach in meeting the desired goals. The following tables present the results of algorithm optimization and human decision-making processes concerning the order distribution among the subcontractors. Table 13 shows the output of the optimization algorithm, which includes the total performance index and the process order distribution to subcontractors. Table 14 presents the results of the decision-making process. Besides the benefits of each method in improving subcontractor selection and order distribution, this comparison also shows the differences in order allocation strategies between automated and human evaluation.
Results of algorithm optimization.

Result of human decision-making.
In Figure 10, which compares the Total Performance index of subcontractor selection plans from both Algorithm Optimization and Human Decision Making, a lower value indicates a better outcome. It illustrates how the results for each plan differ greatly in the two methods.
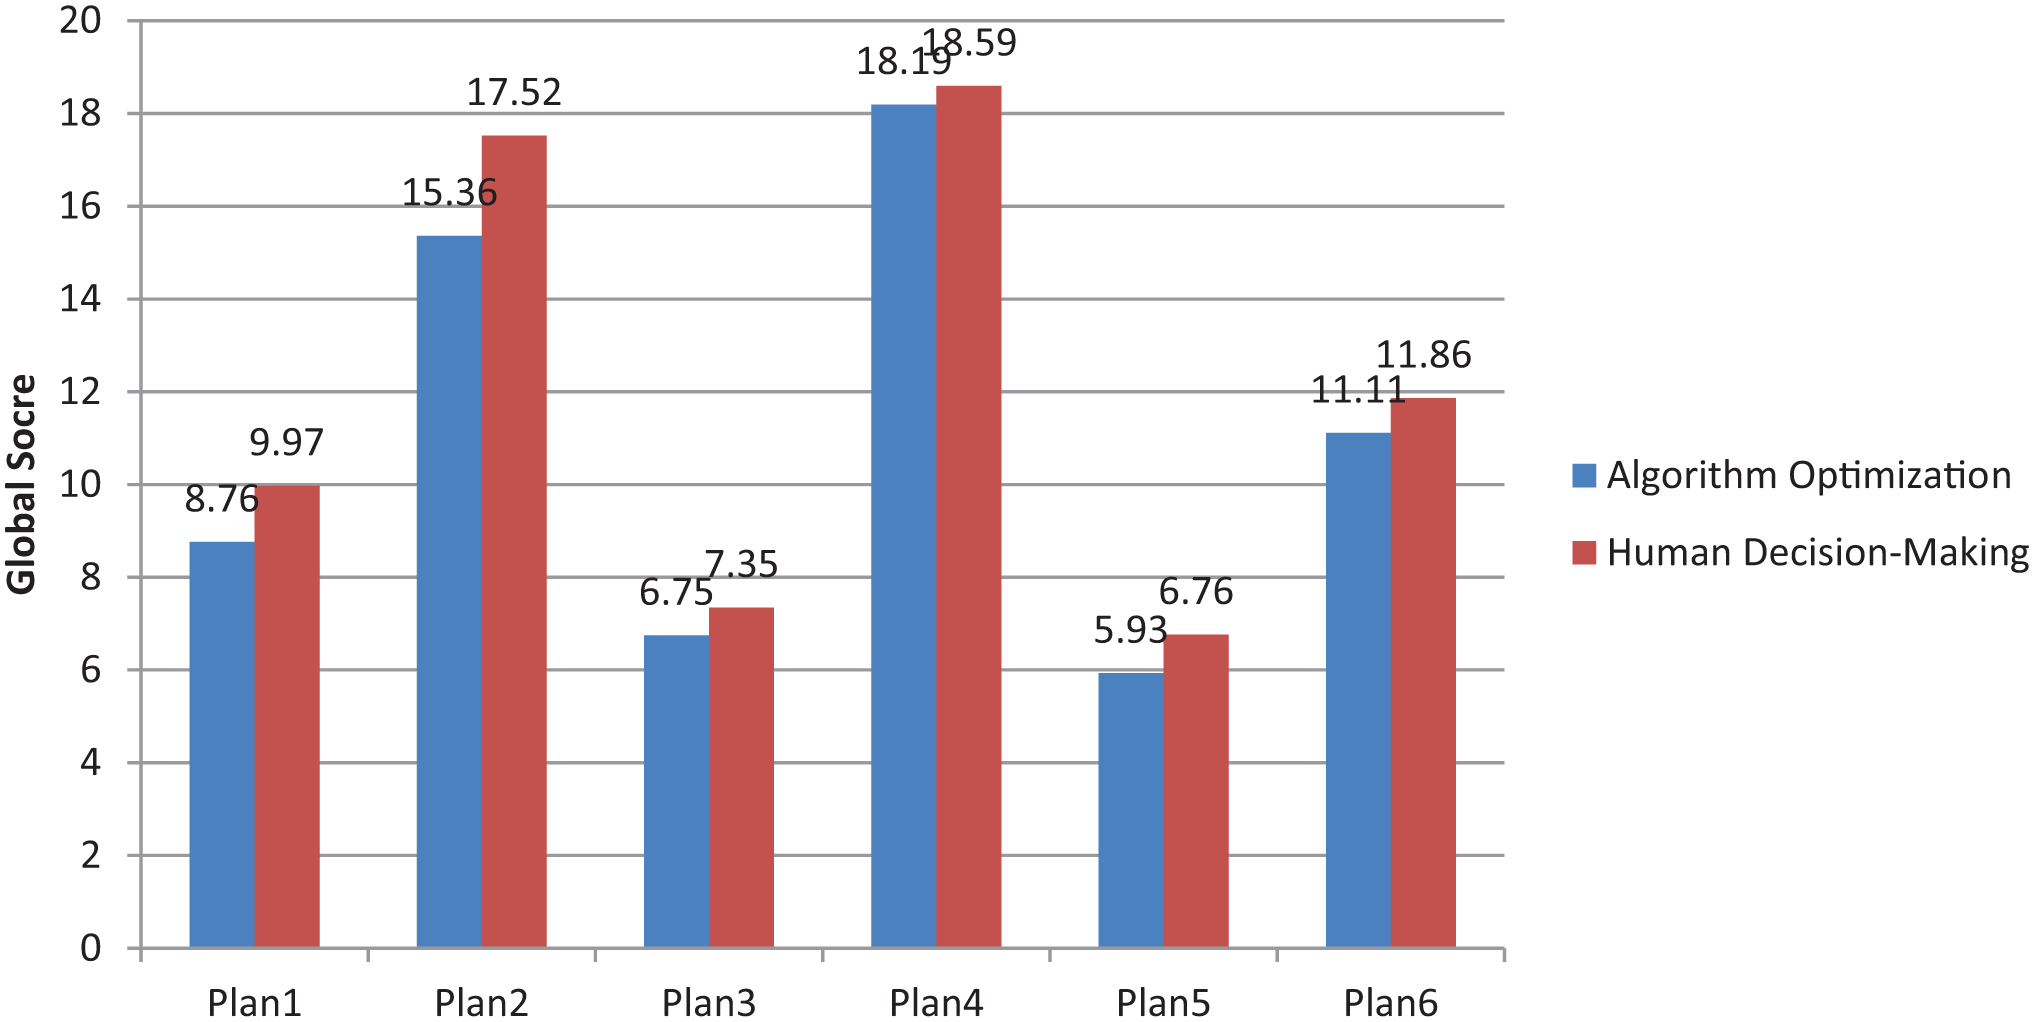
Comparison of total performance index: algorithm optimization versus human decision-making.
The algorithm effectively makes it possible to balance different criteria like delay, price, and defects to avert risks and overspending. In some cases, especially in relation to experience and risk appetite, human judgment is superior to the algorithm. This means that while the algorithm performs well in selecting the best subcontractor, human discretion is invaluable at the final decision stage. Therefore, given the expert review and algorithmic decision support, a combination of these approaches will most likely provide the optimal solution during the selection process. This analysis also proves the need to incorporate human intelligence into the selection process evaluation, despite the fact that AI is involved in decision making.
Statistical analysis study
A statistical analysis study was done to compare Algorithmic Optimization and Human Judgment in Subcontractor Selection. This study is presented in Table 15.
Statistical comparison of algorithmic optimization versus human judgment in subcontractor selection.
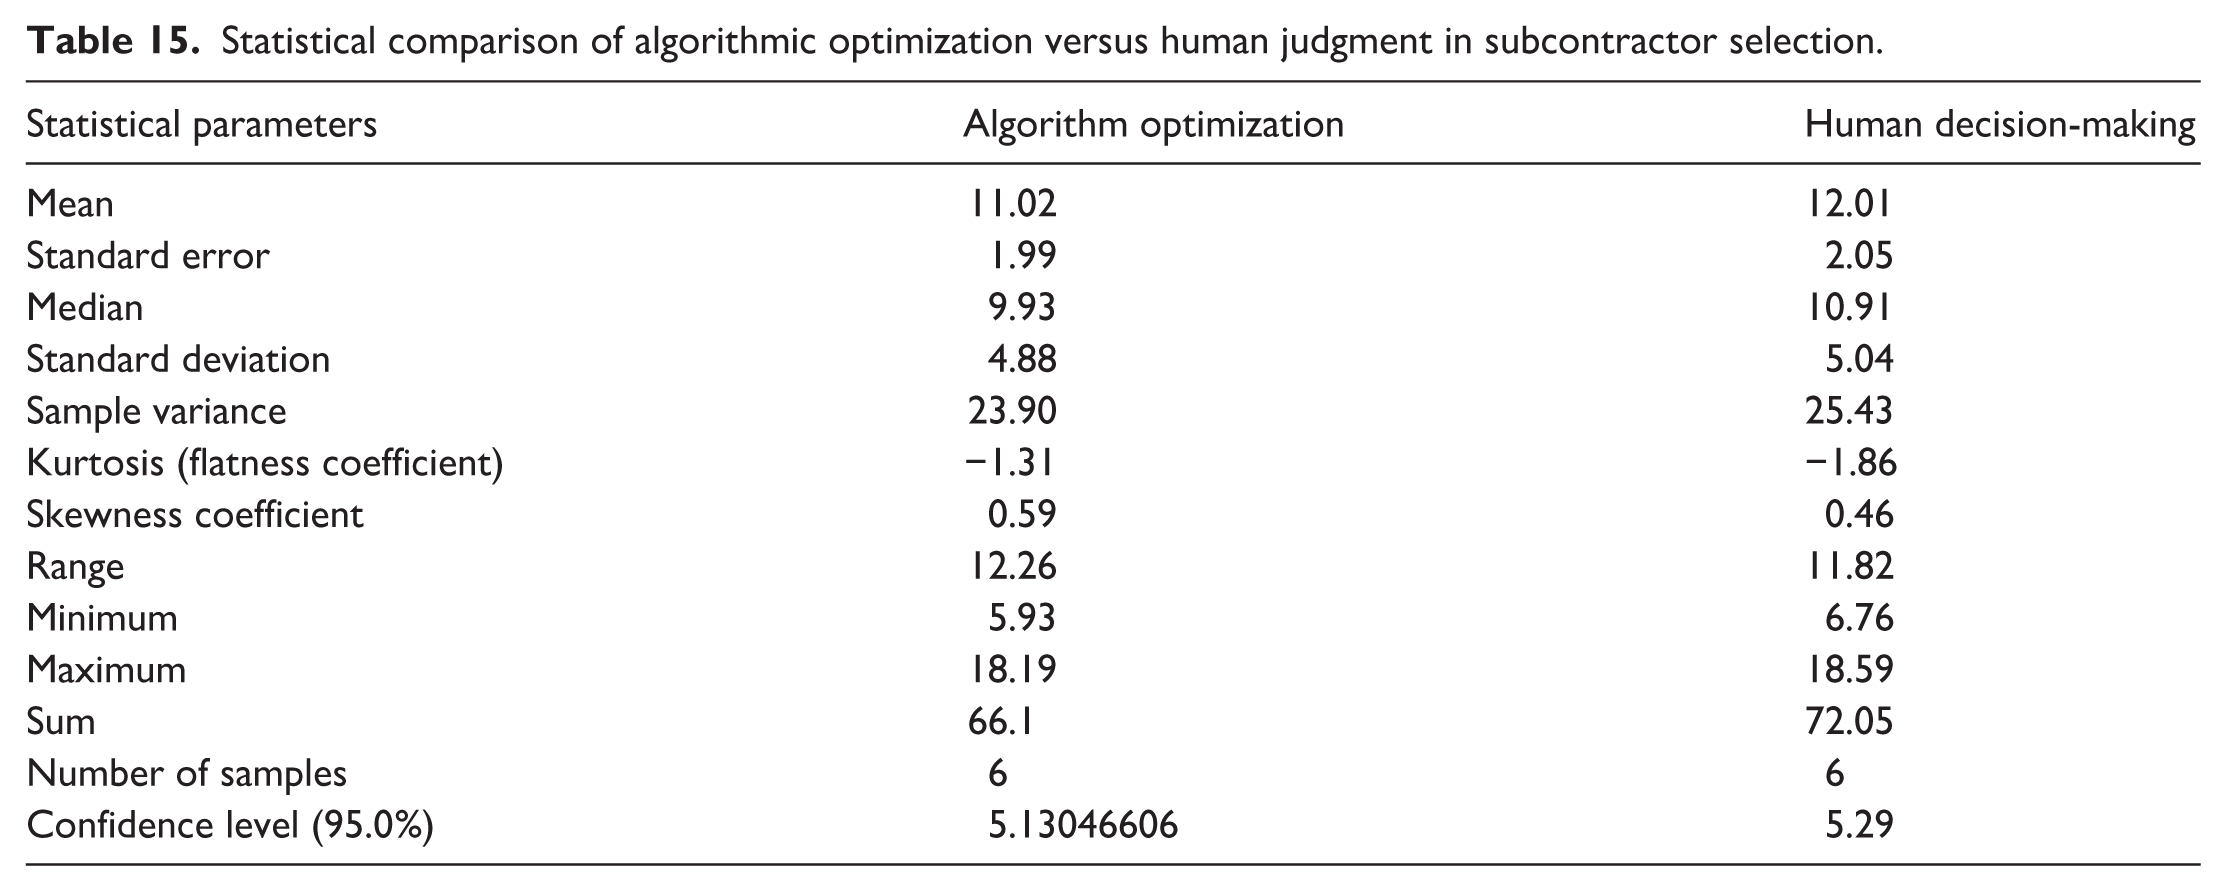
Table 15 shows us clearly that algorithmic optimization has a worse performance with a mean score of 11.02 compared to the human counterpart, who is 12.01. This means that the algorithm is more efficient, as lower scores reflect better decision-making. In addition, the two methods showed the same variability, with standard deviations of 4.89 and 5.04, which means the two are equally consistent. These suggest that algorithmic optimization is more efficient, although human decision making has a higher average score. A mixed solution where human and algorithmic decisions are combined to improve the subcontractor selection process should be further examined.
The evaluation of these two systems reveals enhanced performance in delays and defects and prices through their comparison between human expertise and the hybrid Ant Colony Optimization and fuzzy logic algorithm. The overall performance improvement amounts to 8.25%. The algorithm outperforms human decision-making by reducing delays by 9.87% and prices by 17.97% and defects by 2.55%.
Managerial and operational implications
The implementation of fuzzy logic in Ant Colony Optimization (ACO) for subcontractor selection and production planning brings substantial managerial and operational advantages. Through systematic evaluation of subcontractors based on performance metrics, including delays, prices, and defects, managers obtain a complete decision-making instrument that affects project results.
The fuzzy inference system enables managers to handle complex data while making decisions through subjective criteria interpretation. The ability to assess subcontractor capabilities becomes essential in environments with unclear performance metrics because it leads to more precise capability evaluations.
The identification of optimal subcontractor paths through this system enables managers to distribute resources with maximum efficiency, which decreases costs and delays. The focused subcontractor selection process directs projects to the most qualified providers which results in enhanced project duration and quality standards.
The model reveals possible risks which subcontractor performance may present. Through historical data analysis combined with fuzzy evaluation, managers can predict delay and defect issues, which enables them to develop proactive risk mitigation strategies.
The model enables continuous assessment of subcontractor performance through its implementation. The constant monitoring of subcontractor effectiveness through this system promotes accountability while motivating subcontractors to maintain high standards.
The use of data-driven insights enables companies to develop better relationships with subcontractors by selecting those who demonstrate consistent high performance. Strategic implementation of this approach allows for organizations to develop enduring partnerships that create mutual advantages.
The proposed model not only improves subcontractor selection efficiency but also creates an operational improvement framework that leads to successful construction project outcomes.
Conclusion
In this study, a novel methodology in subcontracting selection within the textile industry was developed based on fuzzy logic principles and Ant Colony Optimization (ACO). The issues of selection factors like subcontractor delay, price, and defect are resolved with a new hybrid approach, which was anticipated to aid in decision-making. Fuzzy Logic helps represent the vague and subjective assessment of subcontractors. At the same time, ACO functionalities enhance the management of the subcontractor’s selection by the use of pheromones and other adaptive routes of a swarm intelligence search. Our project was based on several stages: First, we calculated the global scores of the subcontractors based on detailed evaluations of delay price and defect, using fuzzy logic. Then, we determined the heuristic matrix to be applied in the ACO method, performing the necessary calculations to establish the performance index of the subcontractors for each production order. Finally, the results obtained through ACO translate into a clearly defined path corresponding to the succession of subcontractors, allowing for an efficient and optimal distribution of production orders between them. A case study of this hybrid model employing ACO with Fuzzy Logic demonstrated its validity within a textile company’s production environment, where it was found to aid in better selection of subcontracting companies. This paper motivates future work to look into the use of hybrid intelligent systems for optimizing supply chain strategic choices.
Footnotes
Declaration of conflicting interests
The authors declared no potential conflicts of interest with respect to the research, authorship, and/or publication of this article.
Funding
The authors disclosed receipt of the following financial support for the research, authorship, and/or publication of this article: Princess Nourah Bint Abdulrahman University Researchers Supporting Project number (PNURSP2026R246), Princess Nourah Bint Abdulrahman University, Riyadh, Saudi Arabia.