
Abstract
Predicting cashmere fiber and wool fiber is one of the main challenges in the textile industry. Near infrared spectroscopy(NIR) is a fast, nondestructive and quickly packaged detection method. Due to the highly similar characteristics of the near infrared spectroscopy of cashmere fiber and wool fiber, it is difficult to distinguish them. In order to improve the accuracy of predicting cashmere fiber and wool fiber, a near infrared spectroscopy cashmere fiber and wool fiber prediction model based on Markov transition field (MTF) and improved YOLOv8 is proposed in this paper. This method calculates the Markov transition matrix of local near infrared spectroscopy data between adjacent wavelength intervals, arranges each probability in wavelength order to expand the Markov transition matrix, forming a MTF of local wavelengths. By replacing the backbone network of YOLOv8 with a hierarchical visual transformer using displacement windows, the network’s attention to local frequency bands and peaks is enhanced. Dropout is added to Swin Transformer (ST) to prevent network overfitting. To examine the effectiveness and stability of the model, it is compared with KNN, decision trees, random forests, AlexNet, VGG16, GoogLeNet, ResNet50, YOLOv8 and other models, and ablation experiments are conducted to further validate the proposed model structure. Experimental results show that the average prediction accuracy of cashmere fiber and wool fiber using this method is highest at 97.01%. The proposed near infrared spectroscopy cashmere fiber and wool fiber prediction model based on MTF and improved YOLOv8 can achieve rapid and non-destructive prediction of cashmere fiber and wool fiber, providing new ideas for qualitative analysis in the field of near infrared spectroscopy.
Keywords
Introduction
As the world’s largest producer of cashmere raw materials and exporter of textile processing, China occupies an irreplaceable and important position in the international cashmere trade system. Cashmere fiber has become the core raw material for high-end apparel manufacturing due to its excellent lightness, delicate touch and warmth-retaining properties. However, cashmere production is extremely scarce, and in the production process, the accurate identification of cashmere fiber and wool fiber has always faced technical bottlenecks. Due to the high degree of similarity between the two in terms of morphological characteristics, traditional detection methods have limitations such as time-consuming and high cost. Therefore, the establishment of a fast and efficient fiber prediction model is not only related to the quality control of raw materials, but also the key to optimize the textile testing technology system. 1
Traditional identification methods mainly include microscopic methods, DNA methods and image-based methods. 2 The optical microscopy method relies mainly on the experience of the inspector to identify the type of fiber, which is influenced by subjective factors, relatively slow detection speed and high labor costs. The DNA method 3 identifies animal fibers by polymerase chain reaction (PCR) primers and probes, which are effective in identifying cashmere/wool mixtures. The chemolysis method 4 predicts the cashmere content (CC) of blended samples by referencing the near-infrared (NIR) band assignments of chemical bonds in proteins and performing a stoichiometric analysis. These two methods are limited by human and material resources and are not suitable for wide-scale dissemination. The main component of both cashmere and wool is keratin, and their spectral images are very similar, but the different content of cysteine produces different near-infrared absorption peaks, resulting in some differences in the near-infrared spectral band data of cashmere and wool fibers. Chrimatopoulos et al. 5 combined the attenuated total reflection Fourier transform infrared spectroscopy (ATR FT-IR) with partial least squares discriminant analysis (PLS-DA) to establish a prediction model. The PLS-DA model provided a good differentiation between camelid and eight species of hair. Zhu et al. 6 proposed an image identification method of cashmere fiber and wool fiber based on an improved Xception network. Zhu et al. 7 proposed an improved version of ShuffleNetV2 and migration learning that cashmere wool fiber classification, which achieves fast and accurate fiber classification. Lv et al. 8 used principal component analysis (PCA) combined with the wavelength maximum distance method to predict cashmere fibers and wool fibers. The experimental results showed that the prediction accuracy of cashmere was 80.76% and that of wool was 87.02%. Wang et al. 9 used particle swarm optimization-support vector machine (PSO-SVM) to establish a qualitative model of cashmere fiber and wool fiber, and the experimental results showed that the prediction accuracy of cashmere fiber and wool fiber reached 93%, which achieved the qualitative analysis of cashmere and wool.
With the rapid development of deep learning, neural networks become an effective architecture for image classification, 10 target detection 11 and image segmentation. 12 Deep learning networks can be trained and learned from images, 13 and can also be used as a preferred method for extracting features from spectral data. As a network model in deep learning, Yolov8 excels in a number of tasks, such as image segmentation, classification and object detection. 14 Gu et al. 15 proposed an improved Yolov8 network model and deployed it on edge mobile devices to achieve simultaneous detection of mango fruit and fruit stalk, and achieved good results. Riza et al. 16 developed a YOLOv8-CoLa network model based on the framework of YOLOv8 to accurately detect the degree of fermentation of cocoa beans. Wang et al. 17 integrated the Shape-loU loss function into YOLOv8 to achieve good results in the detection of small and medium-sized foreign bodies in Pu’er sun-dried green tea. Wang et al. 18 proposed a YOLOv8 network to enhance the attention mechanism, which realized the detection of colorectal polyps. Duan et al. 19 introduced a small target detection head and Inner-WioU to improve YOLOv8 to realize the detection of small targets in UAV aerial photography. Li et al. 20 used the improved YOLOv8n model, combined with the Bi FPN structure and the SPD-Conv module, to improve the detection performance of mango fruits and stems. Cao et al. 21 proposed a Pyramid-YOLOv8 model. On the YOLOv8x network framework, the multi-attention feature fusion network structure is adopted, and a lightweight module is designed to reduce the amount of calculation, so as to realize the rapid detection of rice leaf blast disease. Tao et al. 22 enhanced the feature extraction ability by introducing the Convolutional Block Attention Module (CBAM), optimized the weighted intersection union ratio (Wiou) loss function, and improved the YOLOv8 algorithm to achieve fast and accurate detection and identification of pavement cracks. The differences between the above test objects are more obvious, the differences between wool and cashmere are smaller, and the sensitivity of the local band differences is lower, so it is necessary to improve the sensitivity of the yolov8 algorithm to the local band differences.23,24
To solve the problem of fast and nondestructive identification of cashmere fiber and wool fibers, a prediction model for identification of cashmere fiber and wool fiber based on near-infrared spectroscopy is proposed by using MTF and improved YOLOv8 network inspired by the above discussion. The problem of high similarity of traditional one-dimensional spectral features is solved by converting the time series data into images through MTF, replacing the backbone network with a hierarchical visual transformer to enhance the sensitivity to the local band differences and adding a dropout in the Swin Transformer to prevent overfitting and to improve the generalizability, which achieves a fast near-infrared spectroscopy for cashmere fibers and wool fibers, efficient and non-destructive prediction of cashmere fiber and wool fiber by NIR spectroscopy.
Methods
An improved YOLOv8
Based on the characteristics and neural network structure, a ST-YOLOv8 network for predicting cashmere fiber and wool fiber by near infrared spectroscopy is established by using MTF and improved YOLOv8 network. Firstly, MTF transforms the near infrared spectroscopy data of cashmere fiber and wool fiber to ensure its suitability for enhancing the YOLOv8 network model. Secondly, replacing the continuous 3 × 34 convolutions in the YOLOv8 Backbone with Swin Transformer enhances the network’s focus on local frequency bands and peaks of near infrared spectroscopy data, thereby improving the accuracy of cashmere fiber and wool fiber prediction. Additionally, adding a Dropout layer in the Swin Transformer reduces network complexity to prevent overfitting. Finally, improving the Detect layer in YOLOv8 achieves the final prediction of cashmere fiber and wool fiber. The overall model architecture is illustrated in Figure 1.

MTF and ST-YOLOv8 network overall model framework.
The network architecture of YOLOV8 consists of three main components 25 :
(i) Backbone: a series of convolution and deconvolution are used to extract features, and residual connections and bottleneck structures are also used to reduce the network size and improve the performance.
(ii) Neck: multi-scale feature fusion techniques are used to fuse feature maps from different stages of the Backbone to enhance feature representation.
(iii) Head: mainly responsible for the final target detection and classification tasks, including a detection head and a classification head. The detection head contains a series of convolutional and inverse convolutional layers to generate detection results, while the classification head uses global average pooling to classify each feature map.
Markov transition field
In this paper, MTF transforms the near infrared spectroscopy data of cashmere fiber and wool fiber to ensure its suitability for enhancing the YOLOv8 network model. The first step to establish the Markov transition field is to quantify the one-dimensional spectral data and establish a first-order Markov transition matrix.
For a given near infrared spectral data, the wavelength sequence as is presented as:

The absorbance amplitude corresponding to the wavelength sequence is:

The continuous time series

where
For the quantile interval

Although the Markov transition matrix based on one-dimensional spectral data contains the dynamic characteristics of Markov, it ignores the conditional relationship between the distribution of the wavelength sequence

In the Markov transition field,
Swin Transformer transfer learning
Swin Transformer is an attentional mechanism that can be used to replace the backbone of the network proposed by Zhang et al. 26 in 2023, which mainly adopts a hierarchical construction method to enhance the sensing field of the target so as to sense more spectral band features and reduces the amount of computation by dividing the feature graphs, and finally adopts the window transform to solve the information transfer between the windows due to the division of the graphs. The Swin Transformer framework diagram is shown in Figure 2.

Swin Transformer framework diagram.
First, the input is chunked into the Patch Partition module, that is, one Patch for every
The Swin Transformer uses Shifted Windows Multi-head Self-Attention (SW-MSA) and Windows Multi-head Self-Attention (W-MSA) instead of the standard Multi-head Self-Attention unit (Multi head Self-Attention, MSA) and used on two consecutive Swin Transformers. Residual connections and Layer Norm (LN) are added before Multilayer Perceptron (MLP), W-MSA and SW-MSA to give the model better training stability. The swin transformer block structure diagram is shown in Figure 3.
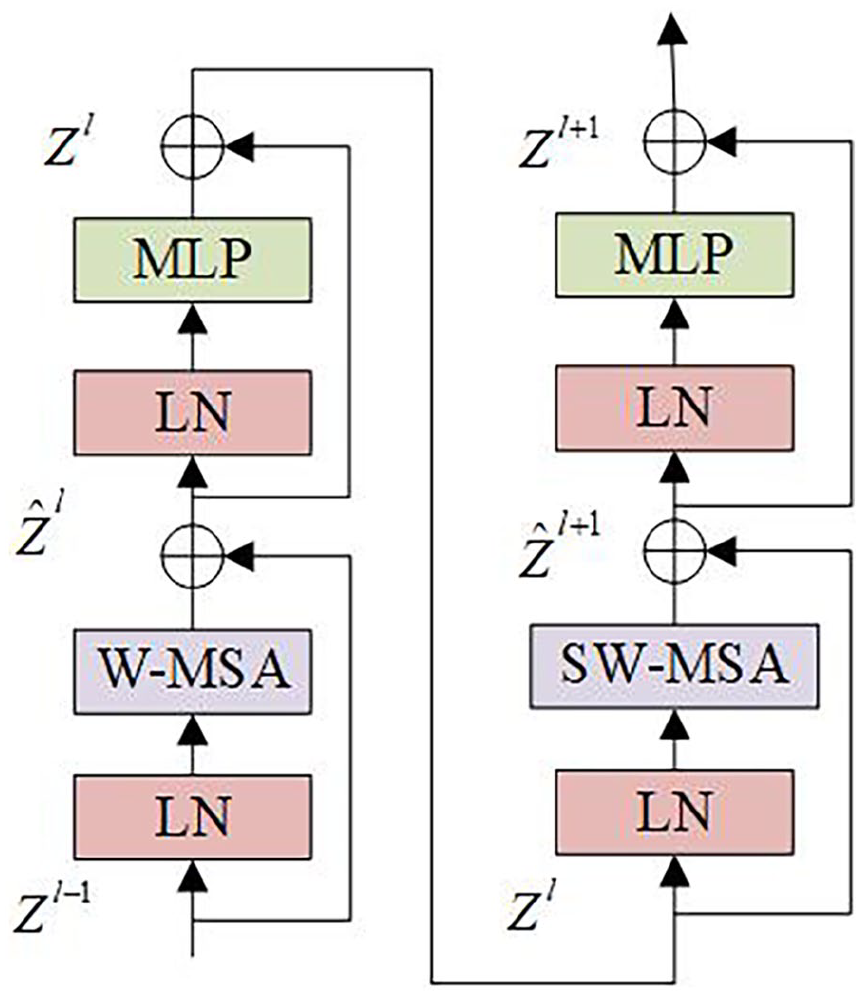
Swin Transformer block structure diagram.
The continuous Swain transformer module update rate is:


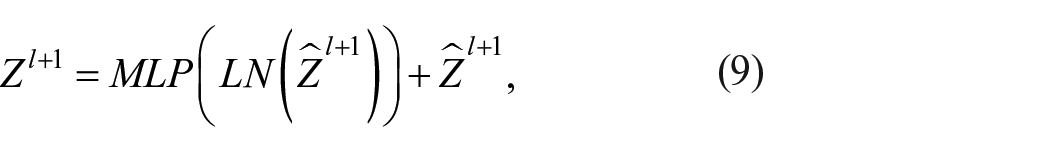
where
The Windowed Multiple Self-Attention Unit (W-MSA) in the Swin Transformer module shown in Figure 4, divides the input feature map into a series of windows that do not overlap with each other, and performs the attention computation within each window in order to reduce the amount of network computation. However, this window segmentation method leads to a lack of information exchange between different windows, which limits the performance of the network. To solve this problem, a new window layout method of Window Multiple Attention Units (SW-MSA) is introduced. The new window layout involves offsetting the regularly segmented windows by a distance of M/2 pixels from the top-left corner to the bottom-right corner, respectively and performing a cyclic displacement operation. Combining the Window Multihead Self-Attention Unitand the Window Multihead Self-Attention Unit in the Swin Transformer module can effectively reduce the amount of computation of the network as well as ensure the global correlation between pixels and improve the performance of the network.

Shift windows layout: (a) input images, (b) W-MSA windows segmentation, (c) shifted windows, and (d) SW-MSA windows segmentation.
The dropout function
To reduce the dependency on individual neurons and enhance the network’s generalization capability, a Dropout layer is added to the Multi-Layer Perceptron (MLP) within the Swin Transformer Block of Swin Transformer. The Dropout function is shown as follows:

Add Dropout layer structure diagram is incorporated as illustrated in Figure 5. The Dropout function prevents the network model from overfitting on the training data, thus achieving better performance on the test dataset. The input first passes through a fully connected layer (Linear), then undergoes non-linear transformation via the ReLU activation function. Subsequently, it goes through the Dropout layer to reduce the number of hidden units in the neural network’s hidden layer, thereby decreasing the model’s complexity and preventing overfitting. Finally, the input is fed into the next fully connected layer (Linear).
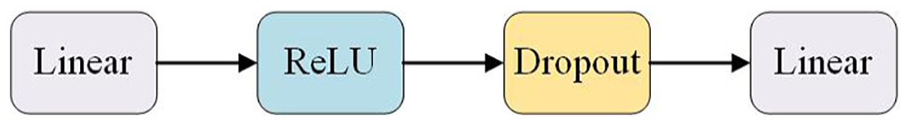
Add Dropout layer structure diagram.
Model loss function
Since cashmere/wool fiber prediction is a binary classification task, a binary cross-entropy loss function (BceLoss) was used for prediction quality assessment. The BceLoss function is shown as follows:

where,
In summary, the local spectral data are encoded into a 2D image by Markov transfer field to strengthen the band correlation features, and the YOLOv8 model architecture is improved – the displacement window hierarchical visual Transformer is used to enhance the local band focus, and the Dropout mechanism is introduced to suppress the overfitting, which significantly improves the NIR spectral prediction accuracy. This method can also be applied in other object recognition 27 and face recognition. 28
Materials and experiments
Data collection
The near infrared spectral datasets of wool (210 samples) and cashmere (180 samples) cover seven wool breeds and five cashmere goat breeds from Australia, Chifeng, Xinjiang, Qinghe, Afghanistan, Outer Mongolia and Shaanxi in China, respectively. Both the wool and cashmere samples are in the form of loose fibers, and the specific sample images and physical parameters are shown in Figure 6 and Table 1.

The images of samples: (a) wool fiber and (b) cashmere fiber.
Fiber classes and physical information.

Note: M,Da (μm) is the mean diameter; M,Lb (mm) its length.
Spectra collection
The RZNIR 7900 near infrared spectral analyzer was used to collect data in the 1000–2500 nm band using diffuse reflection method. Given that the 1000–1300 nm band is significantly interfered by the dye components, the effective spectral band of 1300–2500 nm was finally selected to construct the fiber prediction model. The specific process is:
(i) Near infrared spectral band data collection stage, near infrared spectral analyzer at room temperature conditions, power on the preheating half an hour. Subsequently, the fibers are laid flat into the detection aperture of the NIR spectral analyzer, so that the fibers are uniformly distributed in the aperture, and ensure that the thickness is not less than 3 mm, and the scale is used to buckle the pressure, so that the fibers and the aperture are more tightly adhered to prevent light leakage resulting in the NIR spectral band data generated by the noise.
(ii) Using the RZNIR 7900 NIR spectrometer, align and scan the fiber samples, ending the measurement after the NIR spectral curve stabilizes.
The reliability of the data was improved by bi-directional scanning, and the spectral dataset was constructed by taking the mean value of each sample after 30 forward/reverse measurements (total 1170 entries: wool 630/cashmere 540). Additionally, we first applied SNV preprocessing followed by SG preprocessing to the spectral data of cashmere fiber and wool fiber, and the raw and pre-processed spectral features are shown in Figures 7 and 8.

The near infrared spectra curves of the raw cashmere fiber and wool fiber.

The near infrared spectra curves of the cashmere fiber and wool fiber after pre-treatment (SNV + SG).
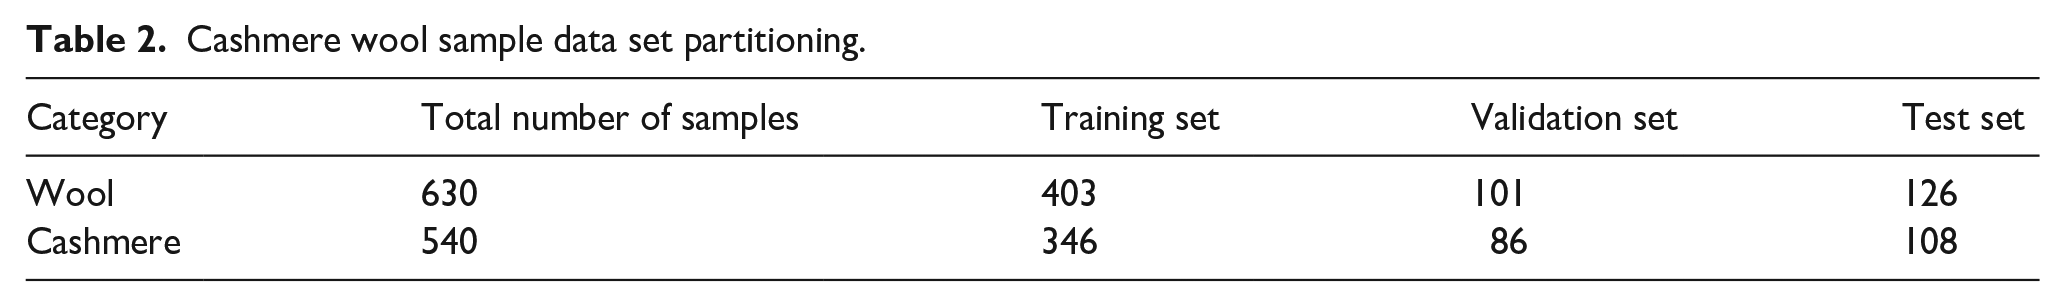
In this study, a dataset was constructed based on 630 wool and 540 cashmere samples, which was divided into a training set (60%), a validation set (20%) and a test set (20%) in the ratio of 6:2:2 for model training, weight optimization and validation of prediction efficacy, respectively, and the specific division structure is shown in Table 2.
Cashmere wool sample data set partitioning.
Experimental environment and parameter setting
Based on the PyTorch deep learning network framework, this experiment establishes the proposed model. The experimental environment consists of a 13th Gen Intel (R) Core (TM) i9-13980HX 2.20 GHz processor, with 1T of computer memory, and an NVIDIA GeForce RTX 4080 Laptop GPU with 12G of memory. To optimize the model and compare it with others, the system is configured with a conda virtual environment, utilizing Python 3.7.0 and PyTorch 1.10.0.
The training algorithm hyperparameters used in this study include but are not limited to learning rate, optimizer, batch size and epochs. The specific settings are illustrated in Table 3.
Parameters of YOLOV8 model.

Choice of quantile D in prediction
Measure D dominates the MTF texture distribution characteristics (Figure 9), and its parameter sensitivity analysis (Figure 10) reveals that the optimal recognition accuracy is achieved when D = 6, at which time the texture gradient is significantly enhanced and the distribution of the numerical densities is balanced, and that too small a measure (weakening of the texture features) and too large a setting (density clustering effect) both reduce the classification effectiveness, so D = 6 is established as the optimal solution.

MTF images with different values of quantile D: (a) D = 2, (b) D = 5, (c) D = 10, (d) D = 15, and (e) D = 20.

Prediction accuracy of cashmere fiber and wool fiber with different quantile D.
Model evaluation index
In this study, the model is trained and tested by the NIR spectral dataset, the training set is used to iteratively optimize the parameters, the test set to verify the generalization performance, and the metrics such as Recall (R), Accuracy (ACC), F1 (F1-Score), Precision (P) and confusion matrix are mainly used as indicators to evaluate the fiber prediction effect of the model. The evaluation indexes mentioned above are shown as follows:
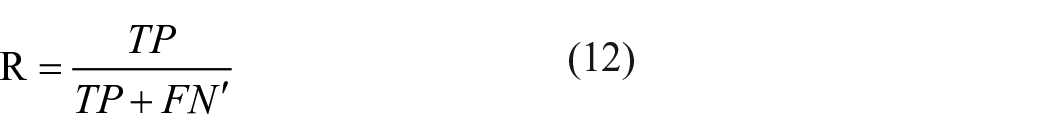
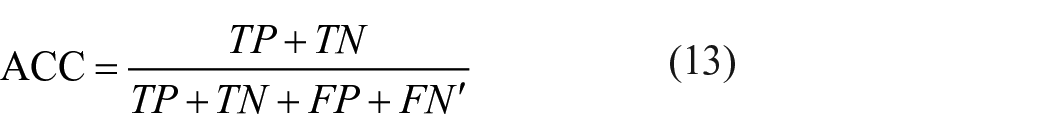


where
Results and discussion
Prediction performance
In the process of collecting near infrared spectral data, it is usually affected by noise, baseline offset and other factors. Therefore, it is necessary to preprocess before establishing the near infrared spectral fiber prediction model of cashmere and wool. In this paper, Savitzky-Golay filtering, Standard Normal Variate Transform (SNV), First-order Derivative (FD) and combined preprocessing methods are used. Among them the smoothing parameter of S-G is a polynomial of degree 2, and the smoothing points are 9. The results of different preprocessing methods on the prediction accuracy of cashmere fiber and wool fiber on KNN, Decision tree, Random forest, AlexNet, VGG16, GooLeNet, ResNet50, YOLOv8 and improved YOLOv8 models are shown in Table 4. The image of the near infrared spectral data of cashmere and wool after SNV + S-G pretreatment is shown in Figure 11.
Modeling accuracy of models by different preprocess methods.


The image of near infrared spectral data of cashmere and wool after SNV + S-G pretreatment.
As can be seen from Table 4, appropriate preprocessing of NIR spectral data can improve the prediction accuracy, in which SNV + S-G preprocessing has the highest number of highest prediction accuracies for different models, indicating that SNV + S-G preprocessing method is applicable to the NIR spectral data of cashmere fibers and wool fibers. Meanwhile, the prediction accuracies of the proposed model in this paper are the highest under different preprocessing methods, which verifies the effectiveness of the prediction accuracy of the proposed model.
Comparison of ablation experiments
To verify the influence of the network proposed in this paper on the prediction effect of cashmere wool fiber, a series of ablation experiments were carried out on the self-built data set. The experiments set by are as follows: YOLOv8 original network, ST + YOLOv8, Dp + YOLOv8, Dp + ST + YOLOv8. The ablation experiment results are shown in Table 5.
Ablation experiment.

From Table 5, it can be seen that the addition of Dp module improves Acc and R to a lesser extent, while the addition of ST module improves Acc and R significantly, and the combination of the two and the application of Dp + ST + YOLOv8 to YOLOv8 improves Acc by 2.27% and R by 7.06%. For P and F1-score, the addition of Dp and ST modules alone only improves them by about 2% and 3%, but the combination of the two and application of Dp + ST + YOLOv8 to YOLOv8 improves P by 6.05% and F1-score by 8.26%, which indicates that the proposed Dp + ST + YOLOv8 network model significantly optimizes the fiber prediction accuracy while maintaining the high fiber prediction accuracy while significantly optimizing the core metrics of target detection.
Comparison of detection performance of different methods
The Dp-ST-YOLOv8 method in this paper is used as the recognition framework. From the prediction accuracy, the MTF method in this paper is compared with other data conversion methods such as Grand Angle Field (GAF), Recursive Graph (RG), Graphical Differentiation Method (GDM) and Relative Position Matrix (RPM). The experiment was carried out for 100 iterations and the best results were selected for no testing purpose, and the Acc, R, P, F1-score for the five prediction methods are shown in Table 6.
The recognition accuracy of five methods for cashmere wool fiber prediction.

As can be seen from Table 6, the algorithm proposed in this paper shows a significant advantage of 97.01% in Acc compared to GAF (91.88%), RG (84.62%), GDM (80.77%), and RPM (78.63%) under the same experimental setup. In terms of R, Dp + ST + YOLOv8 also shows an improvement of more than 5% compared with other algorithms. With high Acc, Dp + ST + YOLOv8 also improves P by more than 4%. F1-Score, as the reconciled average of Acc and R, is optimized together, and Dp + ST + YOLOv8 obtains more than 4.5% improvement in F1-Score. In conclusion, Dp + ST + YOLOv8 not only improves the detection accuracy, but the high recall provides better detection of small and occluded targets and provides higher versatility.
Comparison of feature aggregation of different methods
The degree of feature aggregation is realized by T-distributed stochastic neighbor embedding (T-SNE). T-SNE converts the similarity between data points into probability, and evaluates the quality of feature visualization through the Kullback Leibler divergence of the joint probability of the original space and the embedded space. The T-SNE feature distribution of different methods are shown in Figure 12.

T-SNE feature distribution of different methods.
It can be seen from Figure 12 that the feature clustering obtained based on the data conversion method in this paper is clear, the differences between the features are obvious, and the distinction is good, while the feature distance of other methods is not obvious enough. The T-SNE feature distribution shows that the near infrared spectral features of cashmere and wool extracted by this method have good separability.
It can be seen from Table 6 that the fiber prediction accuracy of this method is higher than that of other methods, indicating that MTF transformation of cashmere and wool near infrared spectral data can effectively alleviate the complexity of near infrared spectral data, making this method have better fiber prediction performance and stability.
Comparison of prediction results of different methods
From Table 7, it can be observed that the Dp + ST + YOLOv8 method achieved the highest accuracy in the classification tasks for both types of fibers (cashmere 96.44%, wool 95.29%), outperforming the suboptimal random forest (cash- mere 87.61%) and VGG16 (wool 85.90%) by approximately 8.8% and 9.4%, respectively. This indicates that the method significantly enhances classification performance by integrating the improved YOLOv8 framework with specific optimization strategies (Dp + ST), significantly enhances classification performance.
The prediction results of cashmere fiber and wool fiber in different models.

Conclusion
In this paper, the problem of accurate identification of cashmere fibers and wool fibers in near-infrared spectra is investigated, and an improved YOLOv8 algorithm is proposed for accurate identification of cashmere fibers and wool fibers. The algorithm utilizes MTF to convert time series data into images, solves the problem of high similarity of traditional one-dimensional spectral features and effectively extracts the features in near-infrared spectra. Replacing the backbone network with a hierarchical visual transformer enhances the sensitivity to local band differences and improves the prediction accuracy. And Dp was added into the ST module to prevent overfitting, reduce the complexity of the model and improve the generalization. The main conclusions of this paper are summarized as follows.
(i) In the ablation experiment, the Acc and P of the improved YOLOv8 model are improved by 2.28% and 6.05%, respectively. Compared with the original YOLOv8 network, the improved model shows significant improvements in all key metrics. In addition, the improved model shows more reliable performance in tomato detection, with higher Acc and P resulting in lower leakage rates compared to other models.
(ii) The improved YOLOv8 was compared with GAF, RG, GDM and RPM in the dataset experiments. The test results show that the improved YOLOv8 model outperforms other models in several aspects of Acc, R, P, F1-score. Its improved effect is especially prominent in complex scenes, small target detection and high similarity target differentiation tasks, providing a better solution for accurate identification of cashmere fiber and wool fiber.
The study also shows that combining deep learning with NIR spectral band data can effectively extract deeper feature information from NIR spectra. Therefore, future research can introduce updated deep learning network models into the field of fiber prediction by NIR spectroscopy, providing a new direction for the prediction of cashmere fiber and wool fiber using NIR spectroscopy.
Footnotes
Funding
The author(s) disclosed receipt of the following financial support for the research, authorship, and/or publication of this article: This work is supported by Shaanxi Provincial Department of Education Research Project (23JC031); Xi’an Science and Technology Project (23DCYJSGG0008 2023); Yulin city science and technology plan project (CXY-2020-052) funding.
Declaration of conflicting interests
The author(s) declared no potential conflicts of interest with respect to the research, authorship, and/or publication of this article.