
Abstract
The diversity of weaving equipment has led to inconsistencies in communication protocols, impeding data collection and interoperability between devices, and ultimately reducing production efficiency. Additionally, fabric defects significantly impact product quality, while current visual inspection technologies are primarily reactive and traditional quality prediction methods often exhibit considerable errors. This study leverages the standardization and interoperability features of open platform communications unified architecture technology to facilitate data acquisition within the weaving department, establishing a reliable Internet of Things framework that supports subsequent fabric quality prediction, and optimizing the back propagation neural network through the K-means clustering algorithm and particle swarm optimization to predict the type and number of fabric defects. A comparative analysis with traditional BP and PSO-BP prediction models was conducted, ultimately verifying the feasibility of using OPC UA to transmit weaving data for fabric quality prediction. The research results demonstrate that using OPC UA technology enables the unified transmission of weaving equipment data, addressing the issue of heterogeneity in weaving department equipment. The K-means-PSO-BP model can effectively predict defects such as double weft, hundred feet, and broken warp with minimal error, achieving a root mean square error of less than 0.15.
Introduction
Weaving is a critical stage in fabric production. 1 A variety of weaving equipment, including Toyota looms, Tsudakoma looms, and Picanol looms, form the foundation of fabric production. However, the diversity of these equipment types necessitates different communication protocols. The realization of network communication among various types of weaving equipment necessitates customized communication protocols. This leads to repeated development efforts and significant challenges, including unifying weaving equipment information and achieving interoperability between different machines, thereby reducing production efficiency. Furthermore, the comfort and durability of textiles are closely linked to fabric quality. During the fabric production process, fabric defects often result in a price reduction of approximately 50% for fabric products. 2 Therefore, it is particularly important to accurately predict fabric quality in weaving production. Currently, improving fabric quality in weaving production relies primarily on continuous adjustments and experimentation based on manual experience. However, this method is inefficient and often influenced by subjective judgment, impacting the objective analysis of the overall situation. Thus, unified weaving equipment data collection, prediction of fabric defects, and improvement of fabric quality are of great significance for realizing intelligent manufacturing in textile enterprises and enhancing their competitiveness.
The heterogeneity of weaving equipment and the diversity of communication protocols have caused numerous issues in department data collection, including communication incompatibility, repeated development efforts, and interoperability difficulties. Among the key technologies addressing these problems, OPC UA technology3,4 has garnered significant attention. Shin 5 proposed an OPC UA-based data analysis model interface to achieve interoperability in manufacturing intelligence. By defining the mapping rules between PMML and OPC UA, they designed the relevant information model and implemented a prototype system to publish and subscribe to the converted regression and neural network models. Liu et al. 6 proposed a CPMT platform based on OPC UA and MTConnect, enabling standardized, interoperable, and efficient data communication between machine tools and various software applications. Oksanen et al. 7 investigated the feasibility of using OPC UA technology to transmit ISO 11783-related process data between mobile agricultural vehicles and the Internet. Gutierrez-Guerrero and Holgado-Terriza 8 proposed a new mechanism for automatically configuring OPC UA systems, allowing the configuration of OPC UA servers to be automated from programmable logic controller (PLC) devices connected to basic Ethernet. Mathias et al 9 utilized OPC UA servers to provide clients with a database-related information distribution scheme, allowing external but related clients to monitor the information grid without explicit access to user patterns. Cavalieri et al 10 implemented OPC UA server access on a web platform, thus enhancing interoperability for resource-constrained devices. To improve the energy efficiency of machine tools, He et al 11 developed an energy consumption prediction method based on the OPC UA model, demonstrating the feasibility of this framework for predicting machine tool energy consumption. In summary, research on OPC UA, both domestically and internationally, mainly focuses on equipment information modeling and communication. However, research on the unified information model and data transmission specifications for entire departments, particularly weaving departments, remains insufficient.
Furthermore, to enhance the quality of textiles, scholars have investigated the detection of fabric defects using visual inspection technology.12–17 However, this image recognition-based technology is a form of lagging control because defects can only be identified once they have appeared, which fails to meet the needs of modern enterprises for high-quality product management. Therefore, to achieve advanced control of textile quality, quality prediction technology is essential. Early research on textile quality prediction primarily utilized mathematical regression and statistical methods. Regression analysis successfully predicted quality indicators.18,19 However, as theoretical research deepened, it became evident that traditional mathematical regression methods struggled to accurately predict fabric quality. With the advancement of artificial intelligence technology, scholars began exploring the application of neural network models for quality prediction in the textile industry. As market requirements for textile quality increased, traditional neural networks could no longer meet the quality control needs of enterprises. Research has gradually shifted toward optimizing traditional neural networks to enhance textile quality prediction. And numerous studies on fabric quality prediction have emerged within the industry. Wang and Yu 20 employed a BP neural network model, integrating extensive real-world data and the characteristics of fabric production. By forecasting loom efficiency and fabric defect rates, they successfully validated the feasibility of an ANN-based prediction model. However, the model showed low accuracy in predicting defects. Zha and Xie 21 proposed a four-layer BP neural network with double hidden layers, building upon the traditional three-layer BP model, to predict cotton yarn quality. Xiong et al. 22 introduced a particle swarm optimization (PSO)-optimized BP neural network to predict yarn tensile strength. Majumdar 23 proposed using an adaptive fuzzy neural network (ANFIS) combined with fuzzy logic and neural networks to predict yarn elongation at break and unevenness. Verification results indicate that the ANFIS model exhibits higher accuracy and stability than traditional neural network models. Yildiz et al 24 proposed a method that combines high-resolution scanning with Fast Fourier Transform (FFT) to detect warp and weft density, significantly enhancing prediction accuracy. Additionally, thermal imaging technology has been applied for fabric defect detection, 25 using a gray-level co-occurrence matrix and K-nearest neighbor algorithm to improve classification accuracy. Although the aforementioned studies mainly focus on predicting yarn quality, their research ideas are also highly relevant for predicting fabric quality in the weaving process.
Therefore, this paper focuses on the weaving department context to produce fabrics and employs OPC UA to achieve the unified transmission of weaving equipment data, thus collecting the production data of the weaving department. Subsequently, a neural network is used to predict fabric defects in the weaving process, with the K-means clustering algorithm 26 and particle swarm optimization 27 introduced to enhance the BP neural network 28 and reduce model prediction error, thereby providing technical support for improving department management and optimizing fabric quality.
Method
Analysis of weaving production problems
Analysis of weaving data transmission problems
The production process in the weaving department involves processing the yarn produced by spinning through the loom to create fabrics, followed by a final inspection of the fabrics. The quality of fabrics produced in the weaving department is directly linked to the economic growth of the enterprise. During the weaving production process, workers cannot obtain the real-time status data of the weaving equipment, preventing timely adjustments to the equipment status and resulting in uneven fabric production quality. Additionally, the weaving department contains various types of equipment with a low degree of automation, resulting in diverse and heterogeneous sources of weaving data.
This lack of standardization in communication methods hinders the transmission of data between weaving equipment. An on-site investigation of the weaving department identified the commonly used types of weaving equipment and their communication methods, as shown in Table 1. Different types of looms, whether producing the same or different types of fabrics, need to set distinct process parameters during the weaving production process based on the characteristics of the yarn and fabric, and adjust these parameters according to actual conditions. However, traditional weaving departments contain a variety of equipment types, leading to multi-source heterogeneity in weaving data collection, limited interoperability, and difficulty in obtaining key fabric production information in real time. This situation hinders the timely discovery and resolution of fabric quality issues and limits the improvement and optimization of fabric quality.
Weaving equipment and communication.

Analysis of factors affecting defects
According to national standards, defects were selected as the evaluation index of fabric quality, and the types of defects along with their causes that occurred during the weaving process were categorized and quantified based on these standards. The specific results are presented in Table 2.
Types of fabric defects.
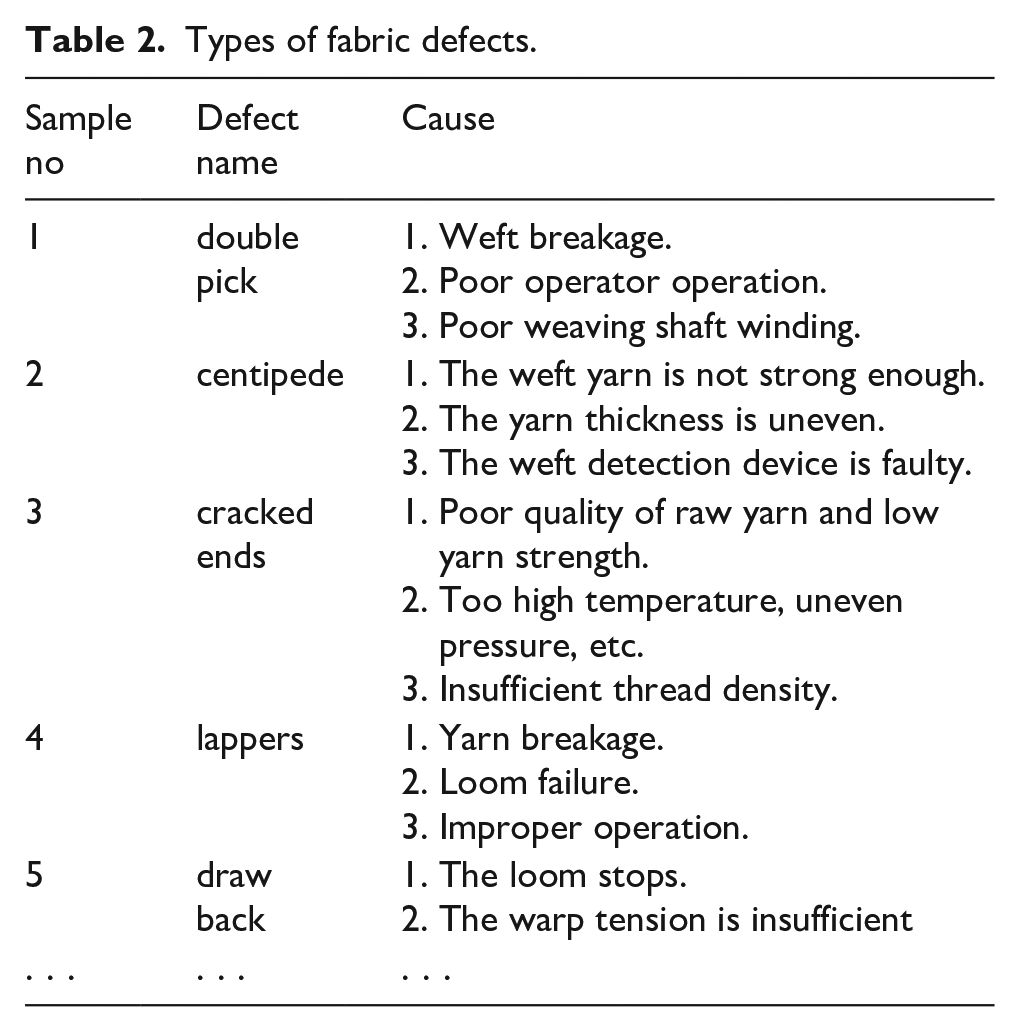
This study integrates the main types of defects produced in the weaving department29,30 and the fabric quality requirements provided by customers, selecting three types of defects—double pick, centipede, and cracked ends—as the primary evaluation indicators of fabric quality. Considering the loom production process, the main factors causing defects include the number and duration of loom stops, fabric type, and fabric density. Loom stops can be categorized into warp stops, weft stops, and machine failure stops. Factors such as loom equipment, loom type, warp and weft density, and fabric variety significantly impact loom stops. Research indicates that weaving machine adjustments and settings play a key role in defect control. By appropriately adjusting factors such as loom speed, fabric density, and the status of loom accessories, the occurrence of defects can be effectively reduced.31,32
Analysis of intelligent production process in weaving department
In response to the aforementioned weaving production problems, this paper designs a fabric quality prediction method utilizing OPC UA for real-time transmission of weaving data. By employing OPC UA technology to collect production data, this study can unify the data transmission specifications of the weaving department, address the problem of multi-source heterogeneity of weaving equipment data, and achieve real-time monitoring of the production process and weaving equipment. Subsequently, by combining deep learning technology for in-depth data analysis, this paper can predict the quality of future fabric production. This method enables enterprises to understand production dynamics in a timely manner and achieve advanced quality control, thereby assisting them in more effectively adjusting production processes and formulating superior process standards. The intelligent production process is illustrated in Figure 1.
Weaving department data collection: By adopting OPC UA technology, establish a weaving department data model to unify data transmission specifications and resolve the communication problem of multi-source heterogeneity in weaving equipment. Establish an OPC UA client to enable real-time data collection and storage of the weaving production process, providing data support for subsequent fabric quality prediction.
Fabric quality prediction: Based on the weaving department data collected via OPC UA, analyze and process the data using a quality prediction model to forecast the final quality of the fabric. Compare the prediction results with the customer-defined fabric quality indicators to determine qualification, and promptly identify fabrics that do not meet the quality requirements.
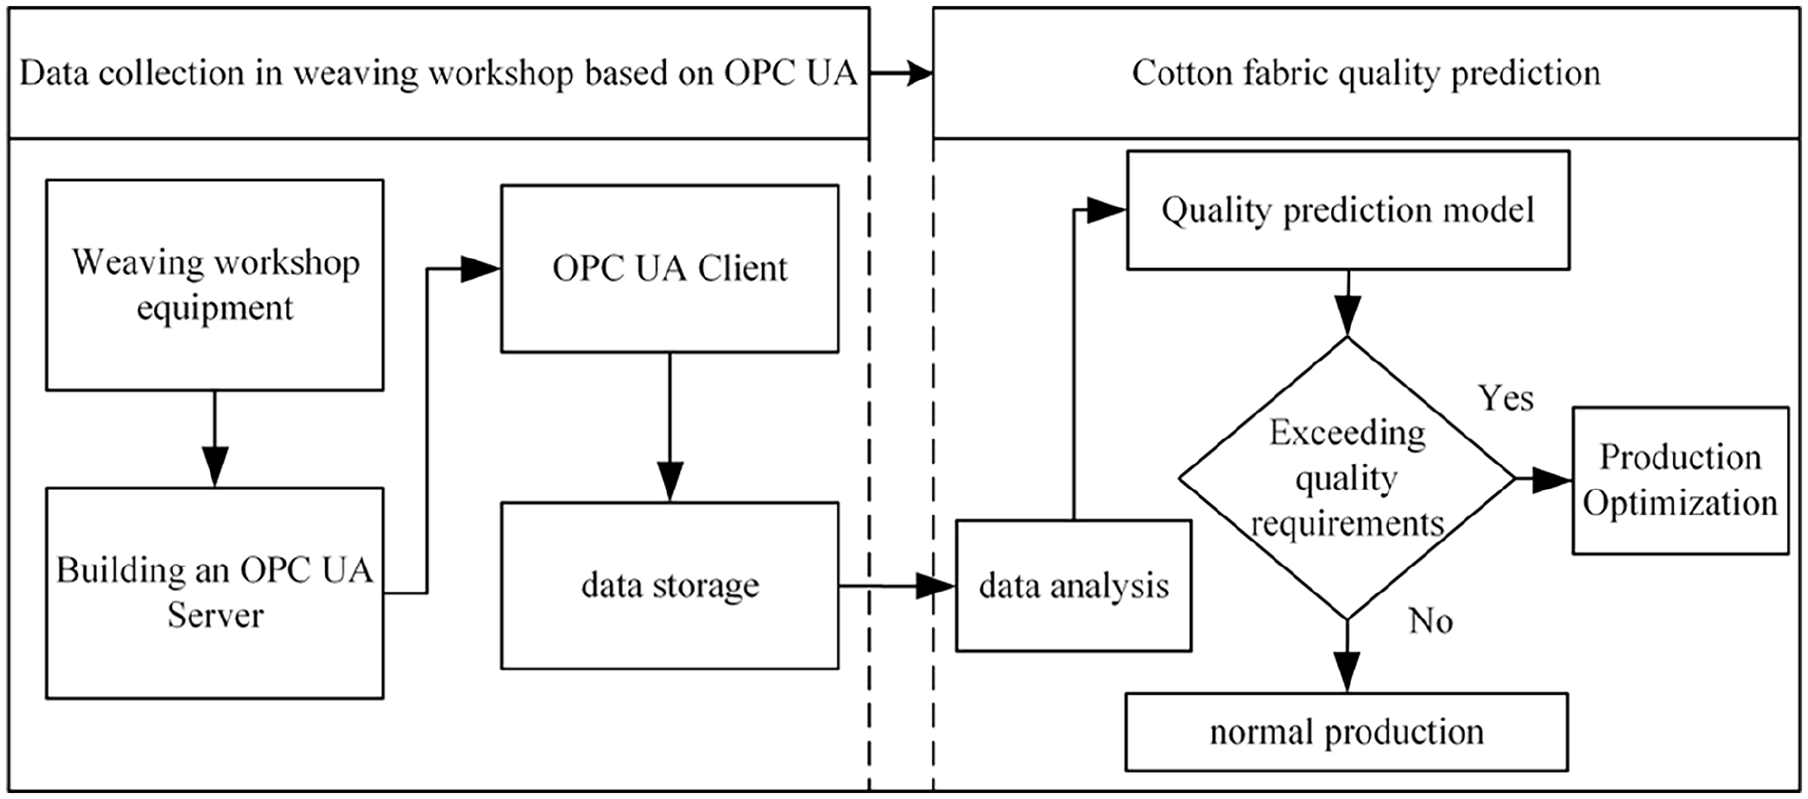
Data collection and fabric quality prediction process.
Design of data collection for weaving equipment
Design of information model based on OPC UA
As an open standard, OPC UA is widely utilized in industrial automation systems to facilitate data communication and exchange between devices. Its advantages include the ability to be developed and deployed across multiple operating systems and programing languages, strong standardization and interoperability, compatibility with existing communication protocols, and support for integration with other standard communication protocols. 33 Therefore, in the face of challenges such as inconsistent data exchange formats between different devices and the large number of devices in weaving production, utilizing the OPC UA protocol can establish a reliable weaving department Internet of Things. This protocol connects and manages various types of equipment in the digital department, providing data support for subsequent fabric quality prediction. The specific process is illustrated in Figure 2.
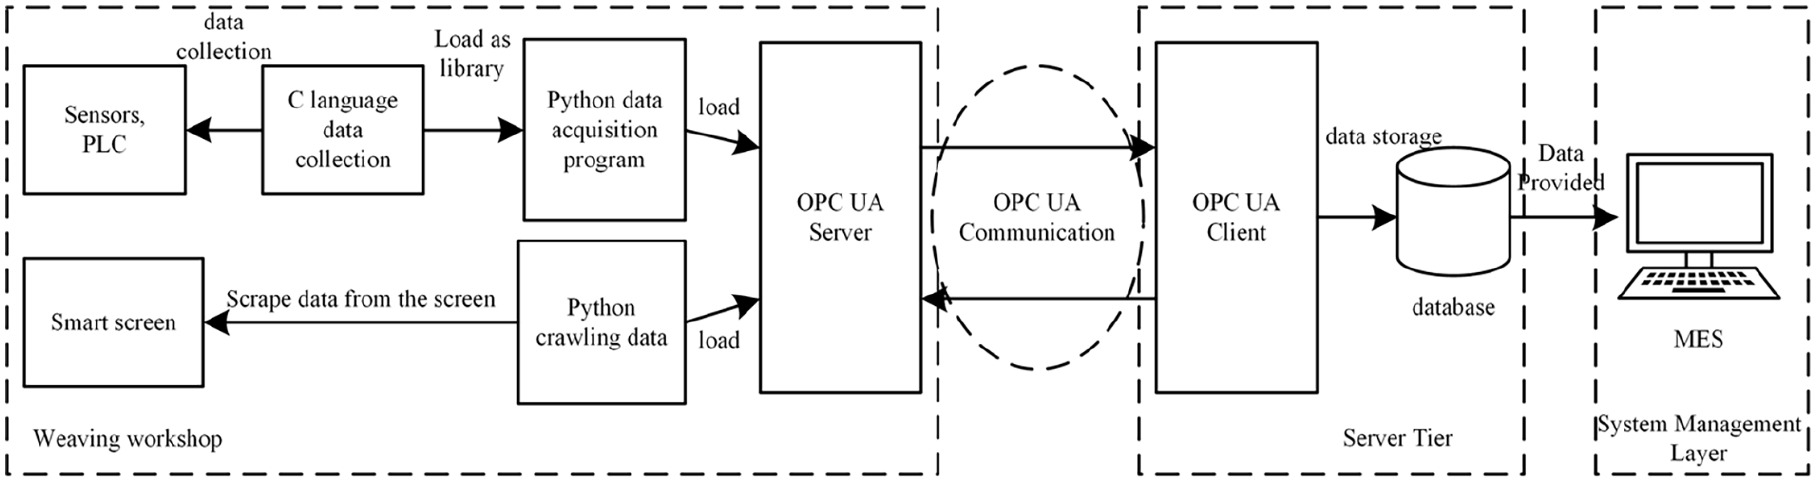
Flow chart of data collection for weaving equipment based on OPC UA.
The core concept of OPC UA is the node. 34 In OPC UA, objects, variables, and other entities are referred to as nodes. Each node has a unique identifier and a set of attributes describing its characteristics and behaviors. Nodes are the fundamental building blocks of information models and represent diverse entities such as devices, data, and methods. According to the data features defined by the OPC UA protocol, a data model based on OPC UA can be established and mapped to the information attributes of physical devices. Although there are many types of looms, they all share common data features, as shown in Table 3.
OPC UA information model general node properties.

In the fabric quality prediction model, relying solely on the basic data from the weaving equipment is insufficient. Equipment data analysis and calculation are also necessary to obtain additional information and provide richer data support for subsequent fabric quality prediction and enterprise management. The extended information is presented in Table 4. On this basis, the data in each attribute set is assigned a unique attribute code, allowing the OPC UA server to access this data. The OPC UA server contains group objects and item objects, each with four basic attributes: node ID, node class, browse name, and display name. Utilizing the unified data mapping function in the OPC UA protocol, data can be read and written.
Weaving equipment expansion node attributes.

Subsequently, by using the message template in OPC UA, each function and method node is associated to achieve object mapping. The mapping relationship between the OPC UA information model and the department equipment is illustrated in Figure 3. This mapping mechanism provides a reliable basis for efficient reading, writing, and accessing of data.
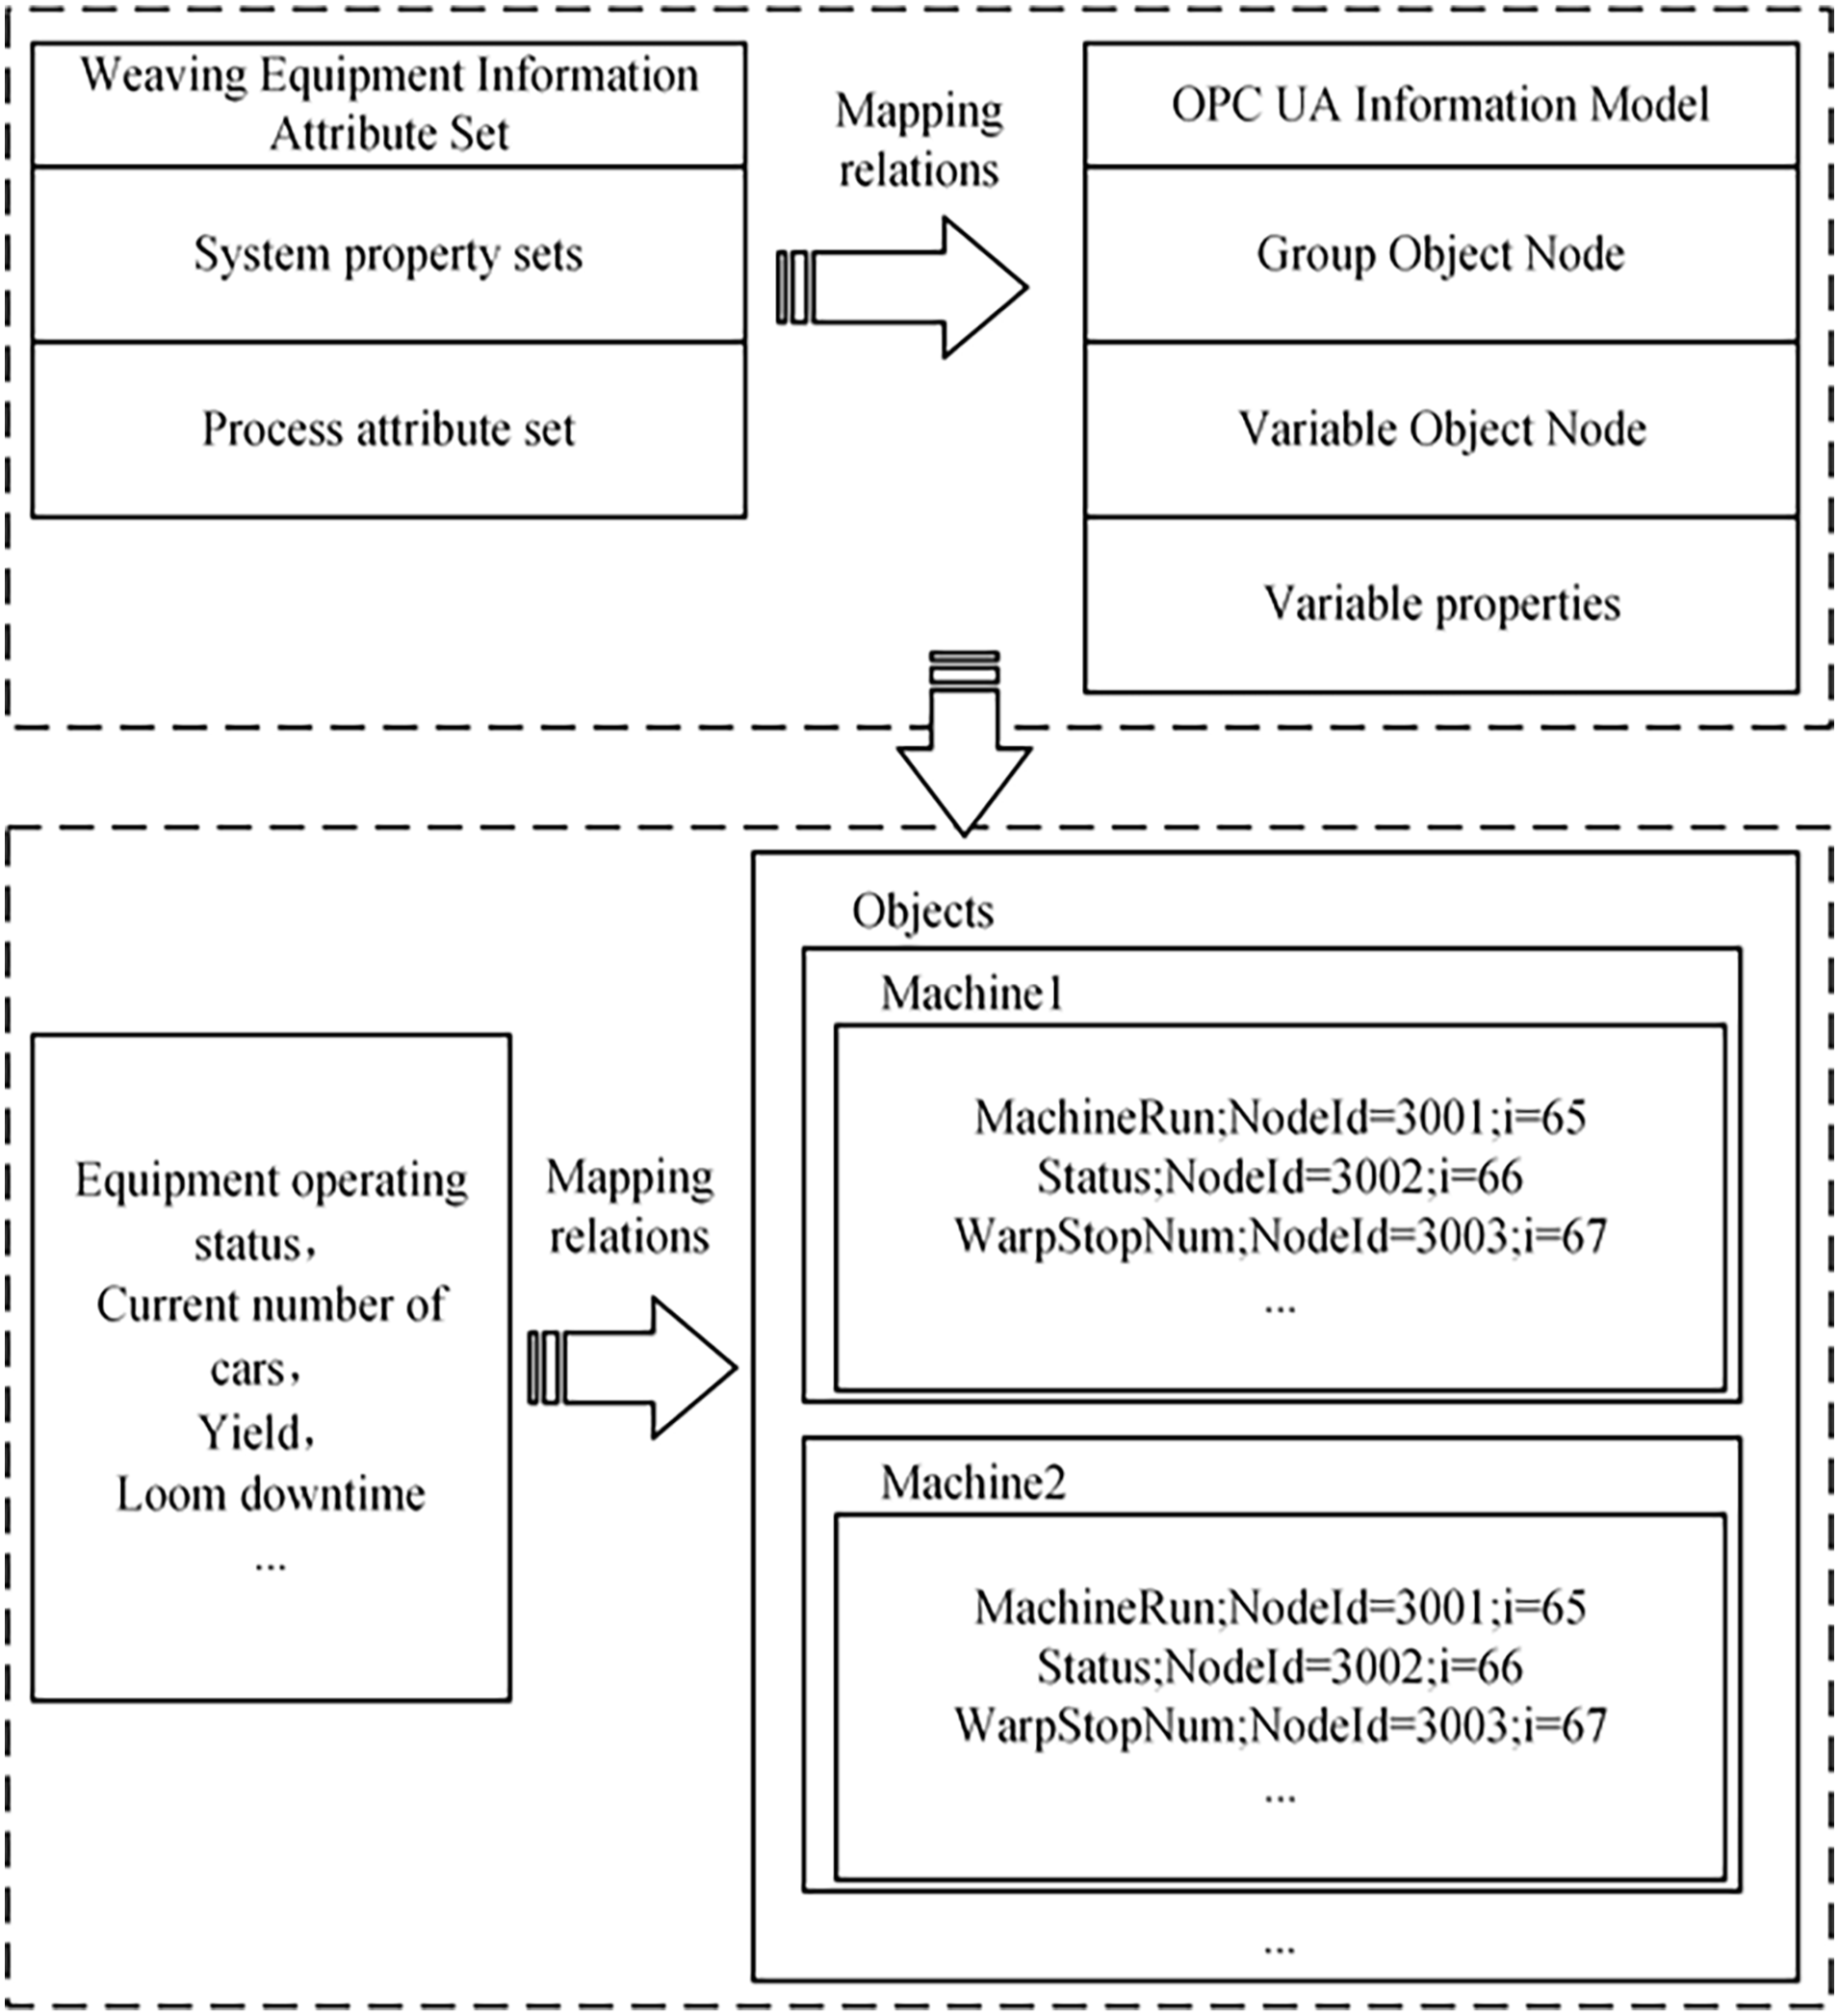
OPC UA weaving department information mapping diagram.
This study employs the method of writing XML files to construct the address space of weaving equipment and uses the XML model to achieve hierarchical organization of the address space. First, an object node of type “folder” is introduced to organize other nodes in the address space. Then, the object nodes are placed under the folder node to describe the various functions and properties of the equipment. Subsequently, all variables are added to the corresponding object nodes to form a complete set of equipment XML models. Finally, the constructed weaving equipment XML model is imported into the program module to establish the OPC UA server for the weaving department. The XML data model of the weaving equipment is illustrated in Figure 4. This method of constructing the XML model makes the address space structure of the equipment clearly visible, aiding in the management and maintenance of the weaving equipment. Additionally, the XML model has good scalability and readability, which facilitates subsequent configuration and modification.
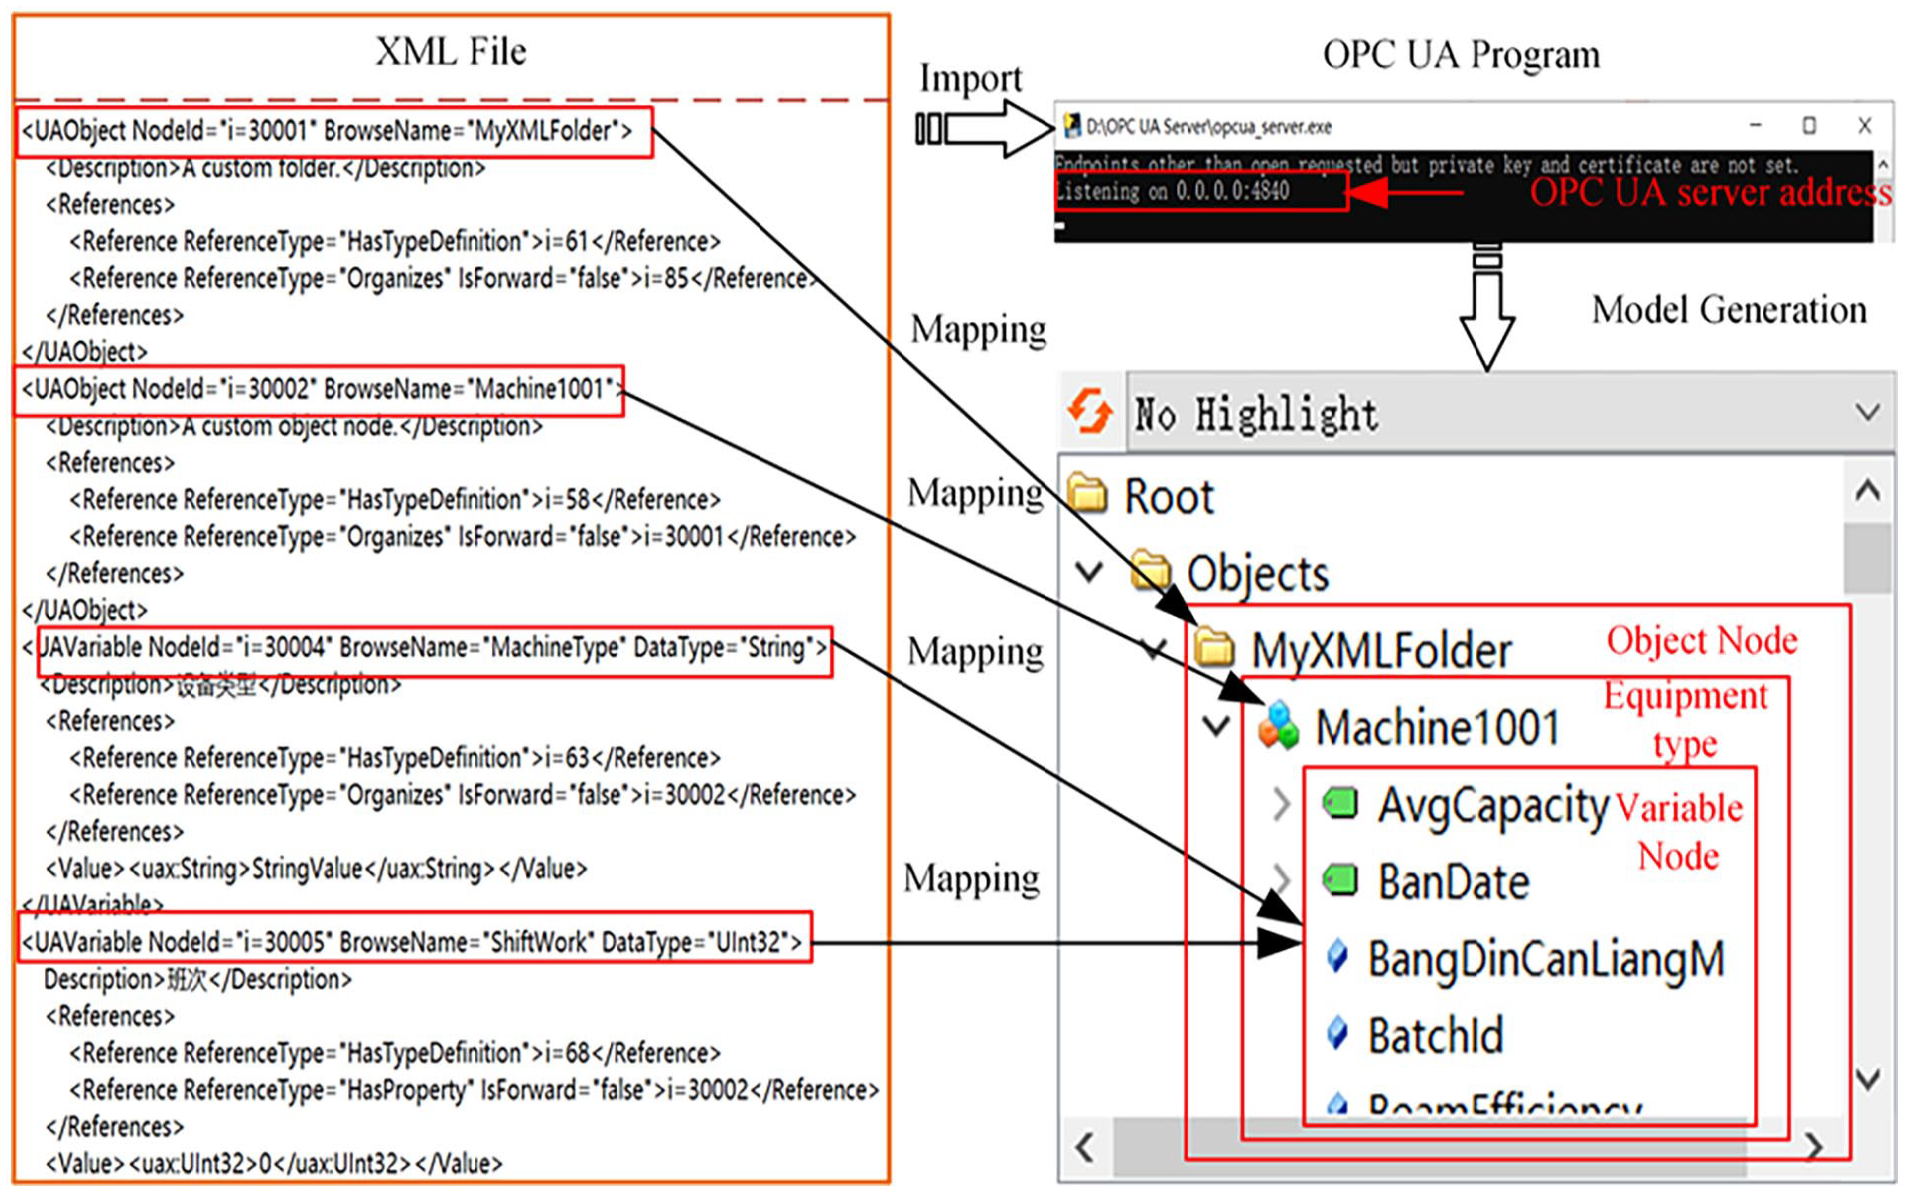
Establishing an XML model.
Database design based on OPC UA
In fabric quality prediction, data plays a vital role, 35 making its storage particularly important. In the weaving production process, to more accurately predict fabric quality, weaving data must be divided into real-time data and historical data and stored in a database. Real-time data can be used for monitoring weaving equipment status and predicting fabric quality. Historical data is used to train fabric quality prediction models and support quality problem tracing. Therefore, dividing weaving department equipment status information into real-time data and historical data can better meet different demand scenarios. The process of using weaving data is illustrated in Figure 5.

Weaving data usage process.
By analyzing the data characteristics and OPC UA data model generated by the weaving department, the necessary data tables to be created in the database are determined, including looms, shifts, product details, and cloth inspection data, as shown in Figure 6. The product details table records detailed information for each product, including product type, specification, quantity, etc., to help customers query and track the production status and related information of each product. The cloth inspection data table is used to record the quality data of the fabric, ensuring the traceability of fabric quality and the production process through this data.
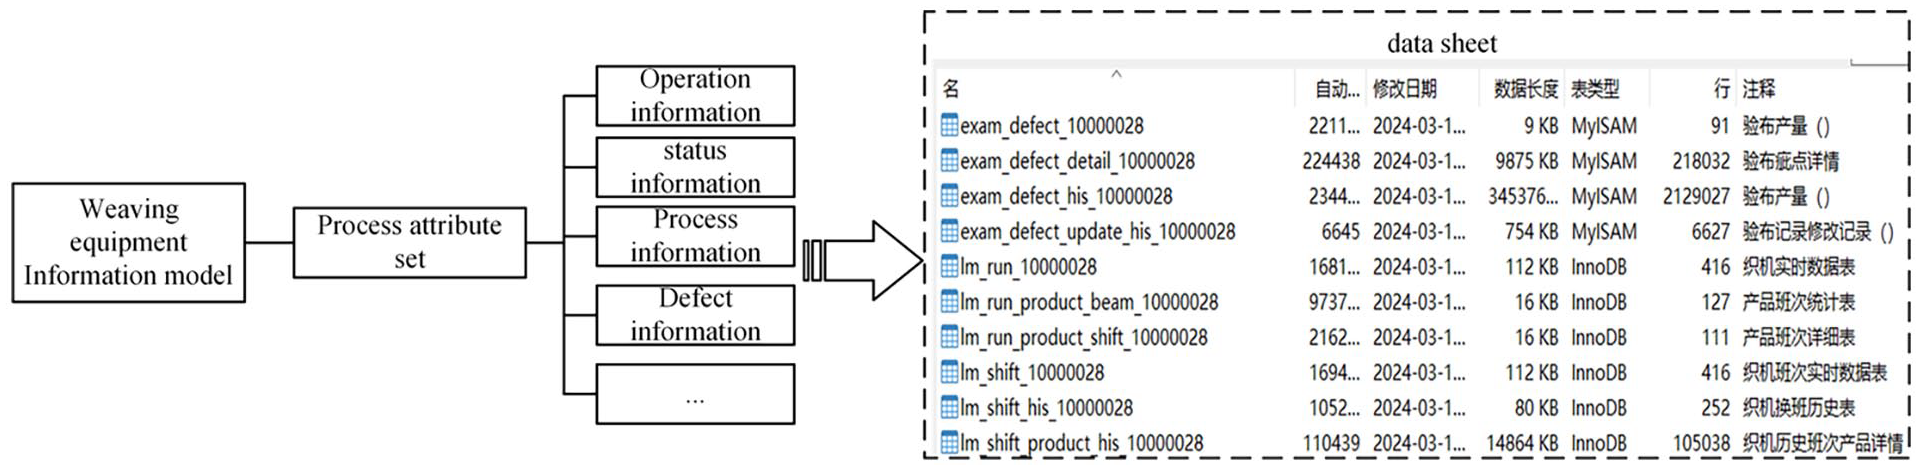
Weaving department data sheet.
Fabric quality prediction algorithm designalysis of weaving production problems
Standard BP neural network
In the weaving process, fabric quality undergoes continuous physical and chemical changes, making the entire weaving process extremely cumbersome. Therefore, fabric quality is difficult to express through a functional relationship. However, the BP neural network possesses good learning and self-regulation capabilities, making it an effective method for solving complex systems with multi-factor coupling. Consequently, it is applied to the problem of predicting fabric quality.
Neural network structure design: According to the previous analysis of the factors affecting the generation of defects in weaving, 13 factors—including the number of weft beats, rotation speed, weft density, warp density, warp yarn count, weft yarn count, weft yarn variety, number of warp and weft stops, warp and weft stop time, and other stop times—are selected as the input parameters of the fabric quality prediction model. According to defect classification, the defect types of double weft, hundred feet, broken warp, and the total number of defects are selected as the output parameters of the model. Due to the different orders of magnitude among the data in actual applications, it is necessary to use dimensionless weaving sample data for processing to eliminate differences in the degree of variation of each factor. The specific conversion formula is as follows:

Where:

In this formula:
2. BP neural network training process: The learning of the BP neural network adopts the forward propagation method. By training the collected samples, the prediction results of the model are obtained, and error analysis is performed. On this basis, the backpropagation method is adopted to calculate the gradient through the loss function, updating the network parameters. This process is iterated until the loss converges. The specific process is as follows:
Step 1: Initialization of network parameters. Randomly initialize the weights and biases of the neural network.
Step 2: Forward propagation. Input the obtained data features into the neural network.

Where:

Step 3: Calculate the loss. By comparing the output value Y of the neural network with the expected value O, the model loss error value is calculated. The formula is as follows:

Step 4: Update parameters. Use equation (6) to update the neural network weights and biases.

In the formula:
Optimizing BP neural network
In view of the complex fabric production environment and the poor generalization ability, slow convergence speed, and low prediction accuracy of the standard BP neural network model in predicting fabric quality, the K-means clustering algorithm and particle swarm optimization are used to enhance the neural network model.
1. K-means clustering algorithm (K-means): To improve prediction accuracy, K-means is used to classify the weaving samples and obtain a new sample set. The specific steps are as follows:
Step 1: Initialize the cluster center. Select K targets from the data set as the initial cluster centers of the entire set.
Step 2: Assign data points to clusters. Use the Euclidean distance formula to calculate the distance between the data point and each cluster center, and assign the data point to the corresponding cluster based on this distance. The formula is as follows:

Where:
Step 3: Update the cluster center. For each cluster, calculate the mean of all data points in each cluster and use the mean as the new cluster center. The formula is as follows:

Where:
Step 4: Repeat steps 2 and 3. Continue repeating steps 2 and 3 until the cluster centers no longer change significantly or the predetermined number of iterations is reached.
Step 5: Output the results. After the algorithm converges, each data point is assigned to a cluster, forming
Since the number of clusters affects the performance of the K-means model, the elbow method is used to determine the most appropriate number of clusters (K) for weaving data. The clustering effect is evaluated by the sum of squares of clustering errors. The calculation formula is as follows:

In the formula:
2. Particle Swarm Optimization (PSO): Particle Swarm Optimization is a swarm intelligence optimization algorithm that continuously adjusts particle positions and speeds by searching the solution space to pursue the global optimal solution. The specific steps are as follows:
Step 1: Initialize the particles. Each particle is assigned a position and speed.
Step 2: Initialize the individual and global optimal solutions.
Step 3: Update particle speed and position. Update the speed and position of each particle using the following formulas.


Sum of squared errors corresponding to different number of clusters.
Where:
Step 4: Update the individual and global optimal solutions. For each particle, update the individual and global historical optimal solutions based on the new position.
Step 5: Repeat the iteration. Repeat steps 3 and 4 until the termination condition is met.
Step 6: Output the results.
3. K-means-PSO-BP algorithm: In a BP neural network, the setting of weights and thresholds significantly impacts the performance of the prediction model. If the initial values are not selected properly, the BP network may easily encounter local extreme values during the learning stage, thus limiting its prediction performance. To optimize the initial weights and thresholds of the neural network, the input parameters are clustered using the K-means algorithm to obtain new feature representations. These new features are used to initialize the weights and thresholds of the neural network. Subsequently, the parameters of the neural network are continuously adjusted using the PSO algorithm to find the optimal combination of neural network weights and thresholds. Based on the above methodology, the specific improvement steps for the BP neural network are as follows:
Step 1: Data recoding. Select an appropriate number of clusters (K) and use the K-means algorithm to cluster the input data. Each sample is assigned to the nearest cluster, and the center of each cluster is calculated to obtain a new feature representation.
Step 2: Initialization of neural network weights and thresholds. The representation of the new features generated by K-means is assigned to the neural network to form new weights and thresholds.
Step 3: Calculate the fitness function. The fitness function quantifies the performance of individuals in the search space, evaluating the quality of the solution. The choice of fitness function directly affects the performance of the optimization algorithm and the efficiency of the search process. Therefore, the mean square error is used as the fitness of the particle in the optimization algorithm. That is:
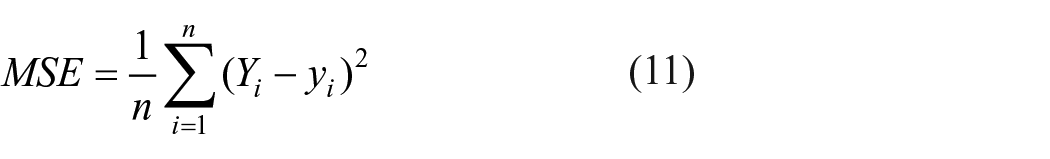
Where:

Where:

Step 4: Particle swarm optimization. Based on the above steps, equation (10) is used to iteratively update the position and velocity of the particles to find a better weight combination.
Step 5: End of particle swarm algorithm judgment. When the number of iterations reaches the maximum or the fitness function value stabilizes and no longer changes significantly, it is considered that the relatively optimal parameters have been found.
Step 6: Update neural network parameters. Apply the optimal weights obtained in Step 5 to the neural network. By continuously updating the weights and biases, the optimization of the neural network model is completed.
Based on the above steps, the entire K-means-PSO-BP neural network algorithm is developed, as shown in Figure 8.

K-means-PSO-BP algorithm flowchart.
Experience
OPC UA weaving equipment data collection verification
Using a weaving department in Zhejiang as an example, the weaving equipment model of the department is established as described in the previous article, and an OPC UA server is built. Based on the data model of the weaving equipment, unified real-time data collection of different types of weaving equipment is achieved. Once the OPC UA server of the weaving department is started, the real-time information of the equipment is stored in the address space, and the equipment information is accessed through the unified interface provided to the upper-level application. Using the OPC UA client program written in Python, the unified transmission of weaving equipment information is verified. The client program is tested to connect to the OPC UA server and read the data in the OPC UA address space of the weaving department. The specific operation is illustrated in Figure 9.

OPC UA data collection program.
Simultaneously, once the client obtains the weaving department equipment information, it is stored in the MySQL database in real time. For example, by checking the timestamp of the “update_time” field in the real-time production data table of the loom, it can be determined whether the OPC UA client has stored and updated the weaving equipment data, as shown in Figure 10. The update time clearly shows that the unified transmission of weaving department equipment data is achieved through OPC UA. This method resolves the issue of various types of weaving equipment and diverse data sources. Additionally, the data update time of each device is consistent, ensuring that the status of each device is reflected in a timely manner.
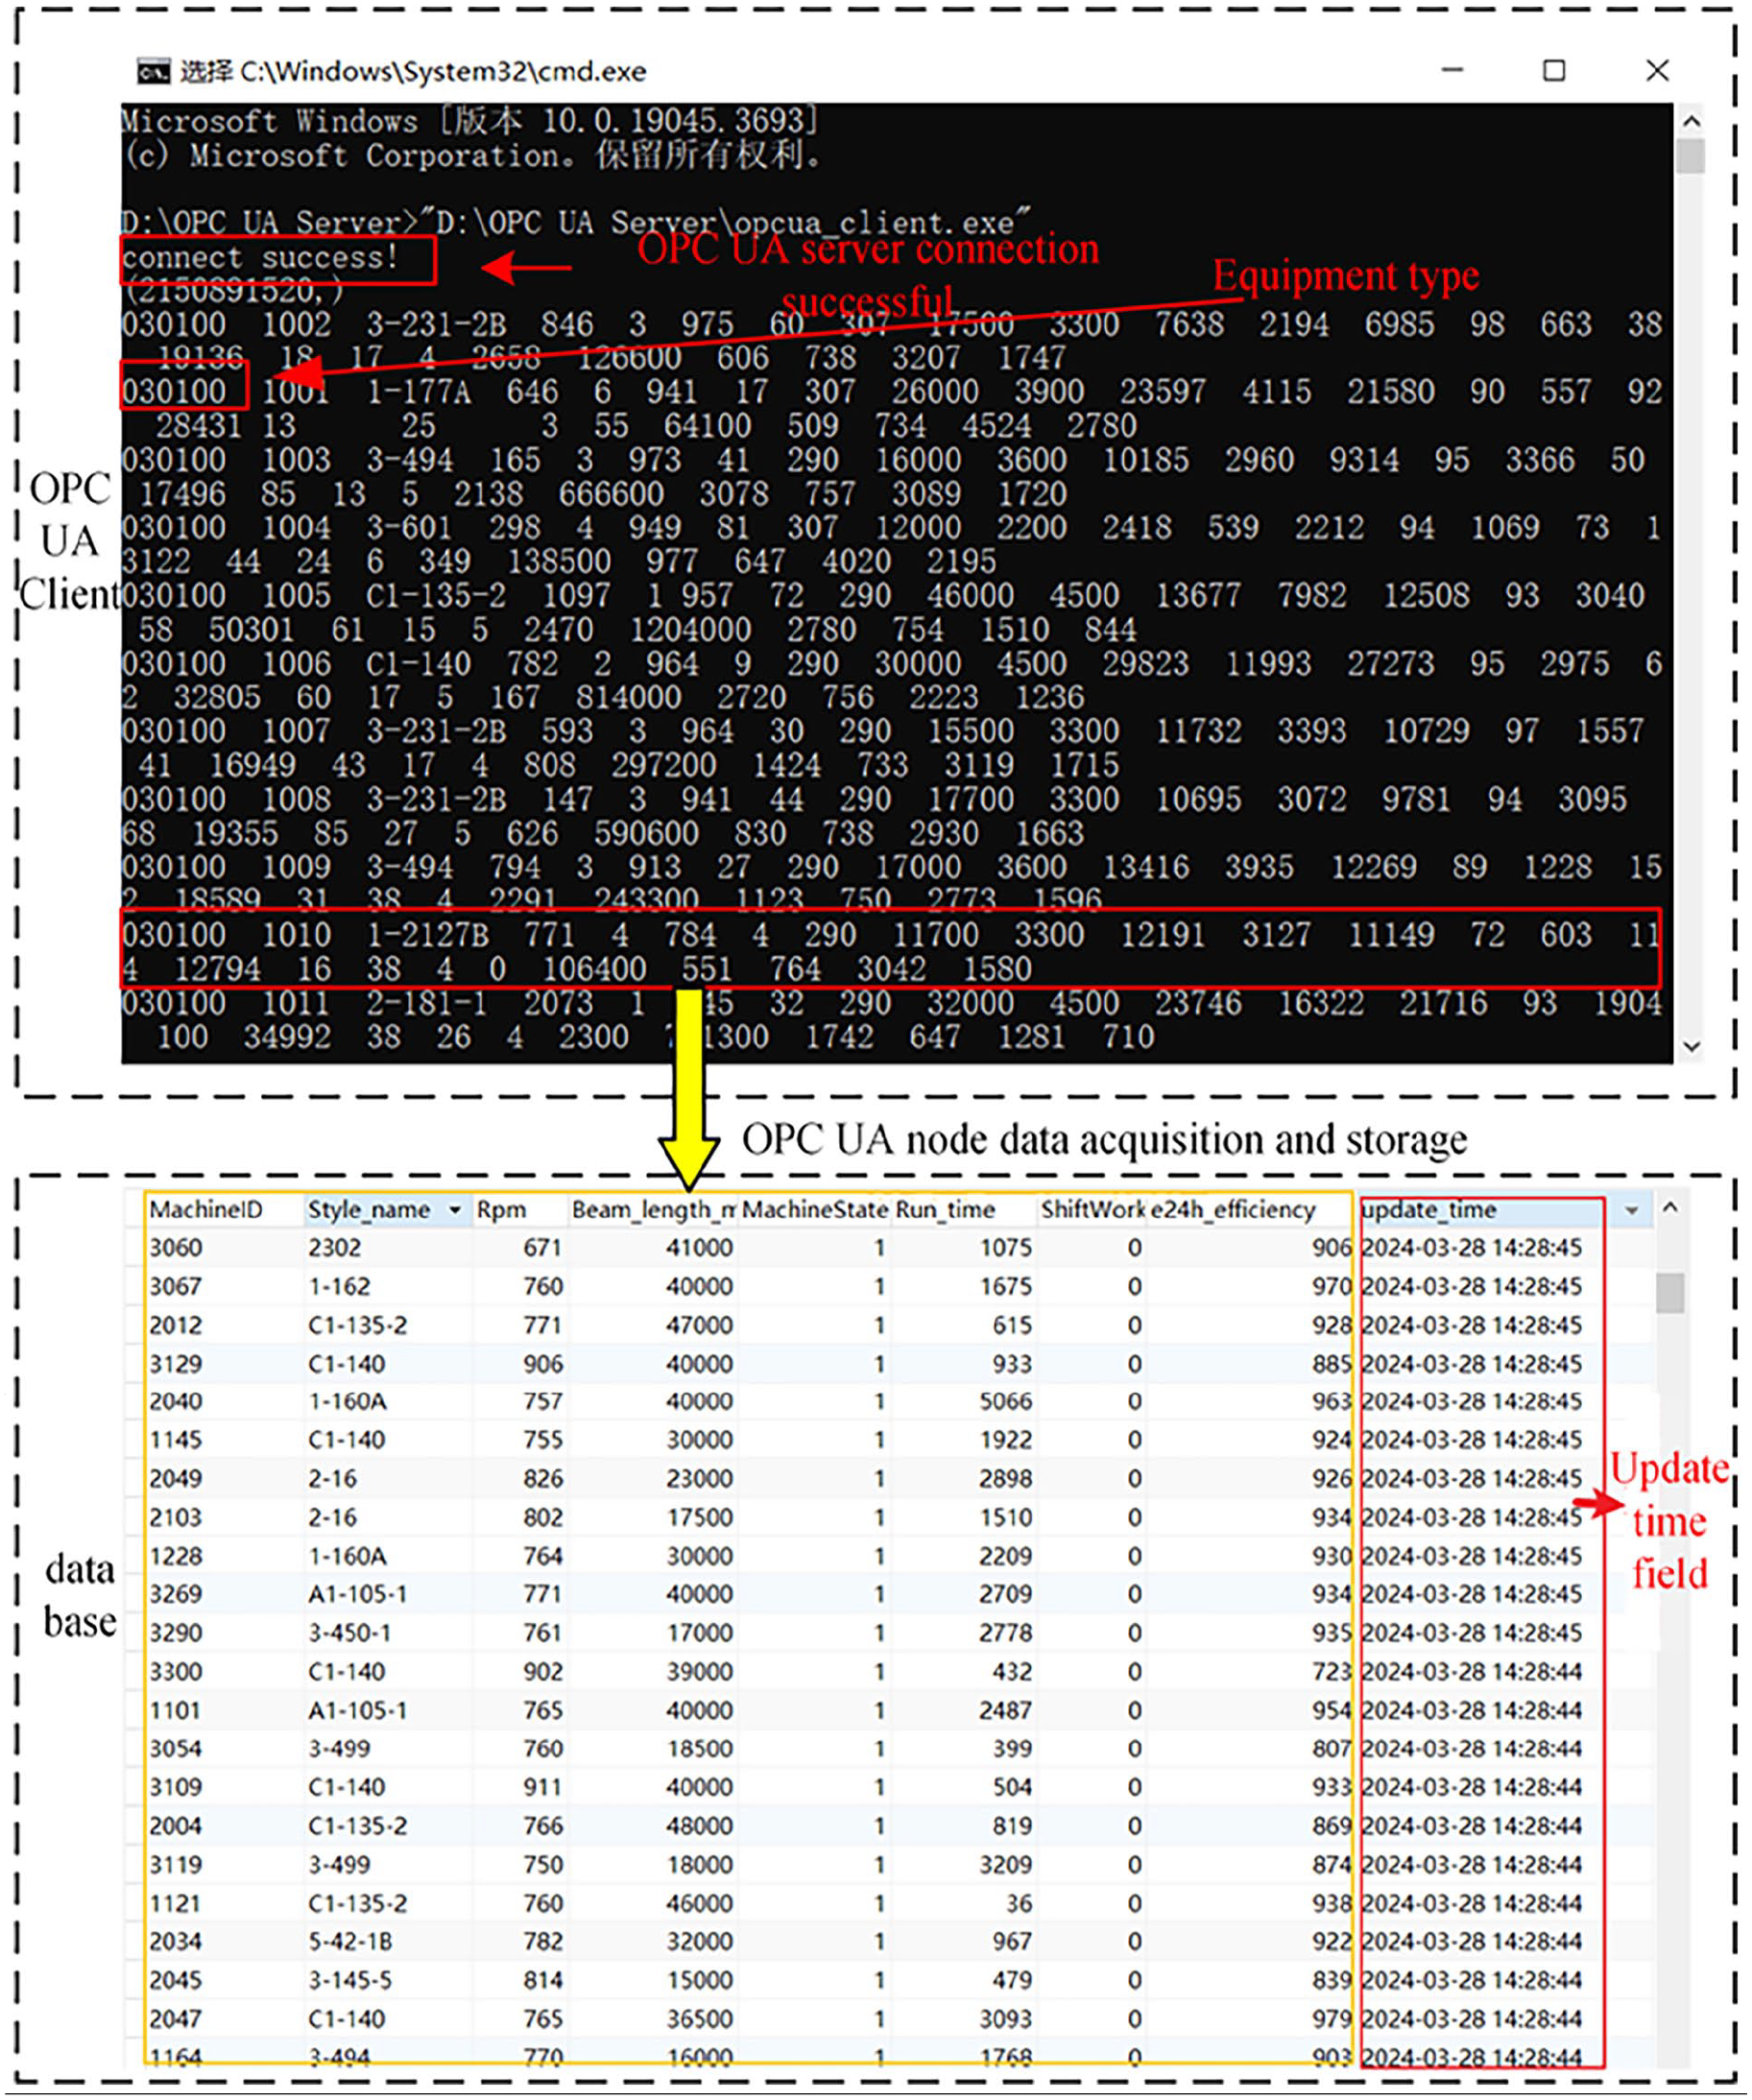
Read OPC UA address space data and store it.
K-means-PSO-BP algorithm verification
According to the 13 factors selected in the previous article, the input parameters of the model are the number of weft beats, rotation speed, weft density, warp density, warp yarn count, weft yarn count, weft yarn variety, number of warp and weft stops, warp and weft stop time, and other stop times, while double weft, hundred feet, broken warp, and the total number of defects are used as output parameters. The processed samples are divided into training and test sets in a ratio of 8:2. The comparison and integration of the prediction results and expected values of defects using the K-means-PSO-BP model are illustrated in Figure 11.

Comparison between K-means-PSO-BP prediction results and actual results: (a) double pick, (b) centipede, (c) cracked ends, and (d) defects total.
It can be clearly seen from Figure 12 that the predicted values of the optimized model proposed in this paper are very consistent with the true values. This demonstrates that the model has an excellent prediction effect on Double Pick, Centipede, Cracked Ends, and the Defects Total.

Comparison of BP prediction results: (a) double pick, (b) centipede, (c) cracked ends, and (d) defects total.
Additionally, to better compare the effect of the optimized model proposed in this paper, neural network prediction models using the BP algorithm and the particle swarm algorithm were constructed. The pre-processed data samples were input into these two models to predict the number of Double Pick, Centipede, Cracked Ends, and the Defects Total. The prediction results of the traditional neural network model are illustrated in Figure 12. It is evident that the traditional neural network has a large error in predicting the quality of cotton fabrics.
Simultaneously, the same data sample is predicted using the particle swarm optimization algorithm, and the results are illustrated in Figure 13. It can be observed that the network after particle swarm optimization has improved the accuracy of fabric quality prediction, but there remains a certain error.

Comparison of PSO-BP prediction results: (a) double pick, (b) centipede, (c) cracked ends, and (d) defects total.
Combining Figures 11 to 13, it is evident that the K-means-PSO-BP model proposed in this paper shows greater improvement and better prediction performance in predicting Double Pick, Centipede, Cracked Ends, and the Defects Total compared to the traditional BP neural network model and PSO-BP neural network model.
Based on the above comparative experimental results, to provide a more objective evaluation of the K-means-PSO-BP model, MSE (mean square error), MAE (mean absolute error), and RMSE (root mean square error) were used as model evaluation indicators to assess and compare the three fabric quality prediction models. The results are presented in Table 5.
Comparison of predictive model evaluations.
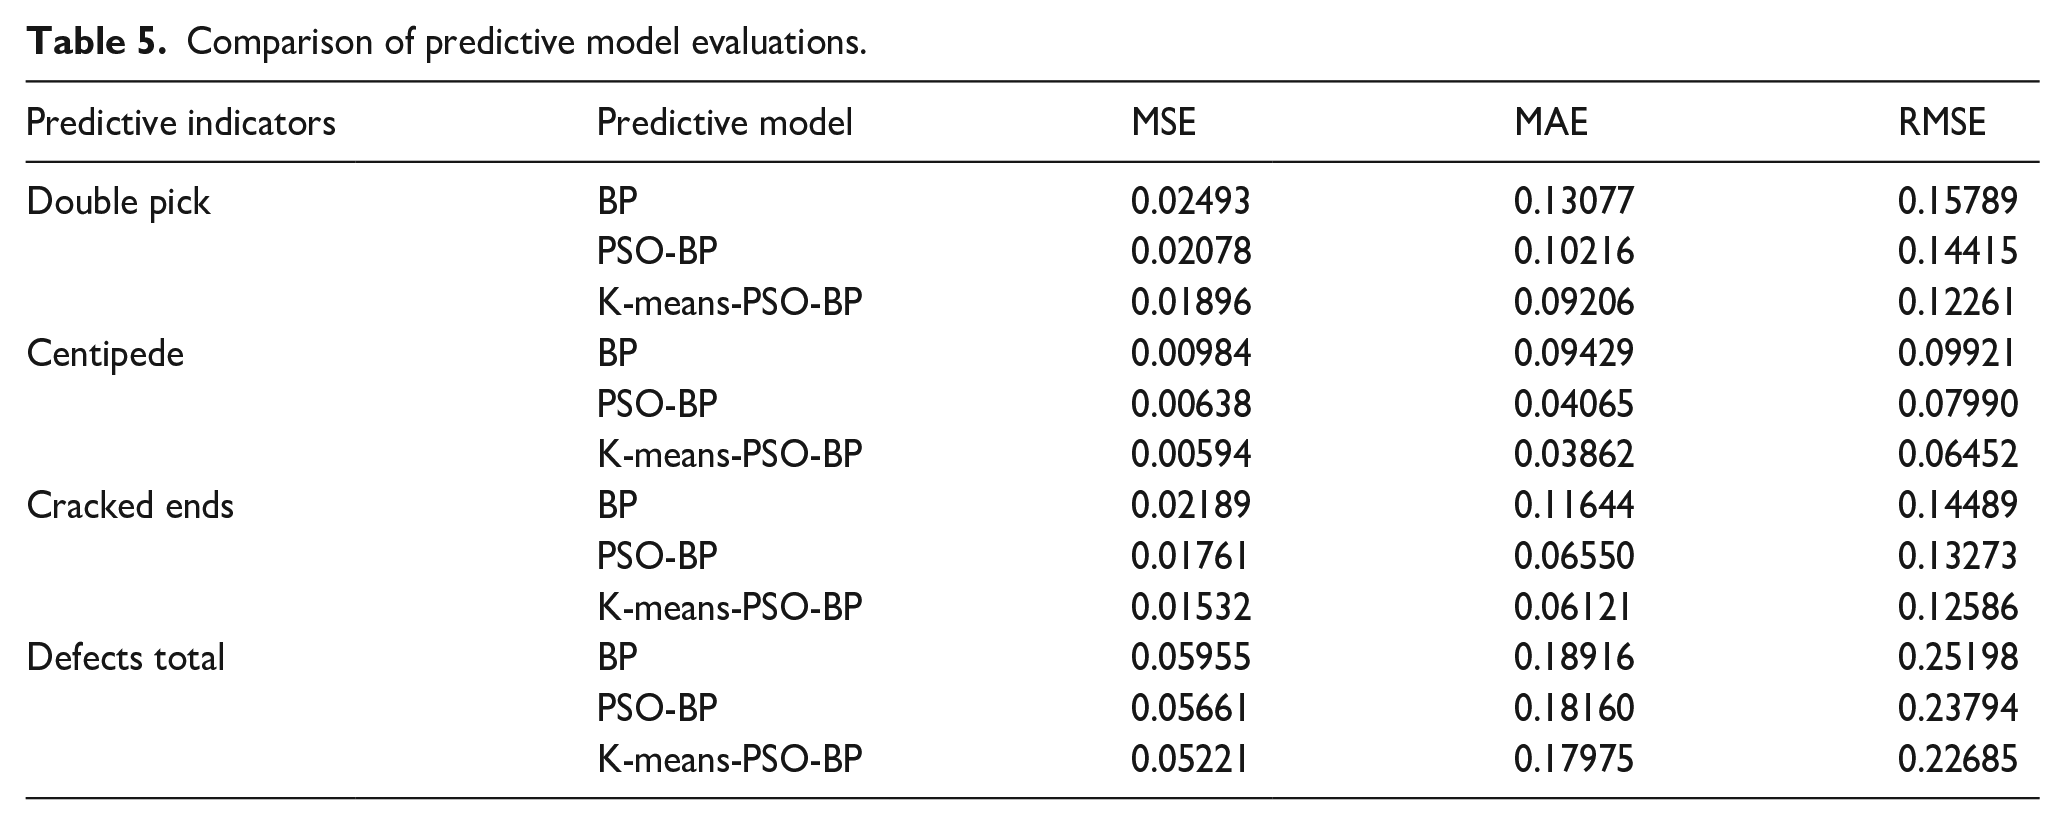
As shown in Table 5, the K-means-PSO-BP neural network prediction model excels in defect prediction. Specifically, in terms of double pick, centipede, cracked ends, and total number of defects, the mean square error values are 0.01896, 0.00594, 0.01532, and 0.05221, respectively; the mean absolute error values are 0.09206, 0.03862, 0.06121, and 0.17975, respectively; and the root mean square error values are 0.12261, 0.06452, 0.12586, and 0.22685, respectively. These values are significantly lower than those of the traditional BP neural network model and the PSO-BP neural network model. Therefore, considering the reduction of these error indicators, the K-means-PSO-BP neural network model shows better performance in fabric quality prediction compared to the traditional BP neural network and the PSO-BP neural network model, significantly improving the accuracy of fabric quality prediction.
Real-time prediction and verification of fabric quality
Taking actual fabric production as an example, in the process of loom production, the weaving equipment data obtained in real time by the OPC UA data model is used as the input value to import it into the fabric quality prediction model, and the total number of defects and the number of different types of defects that will eventually be generated when the loom produces fabric on the current weaving beam are predicted in real time. The operation of the real-time fabric quality prediction program is shown in Figure 14.

Prediction of fabric quality in weaving department.
When the loom completes the production of the current weaving beam, the equipment data and fabric quality prediction data are stored in a database. Subsequently, the produced fabric is sent to the fabric inspection machine for inspection, and the defect data detected by the fabric inspection machine is compared with the fabric quality prediction data generated during loom production. Through this process, the accuracy and precision of the fabric quality prediction model established in this paper, based on the K-means-PSO-BP algorithm, are evaluated and verified. To verify the accuracy of the fabric quality prediction model in this paper, 10 groups of data were randomly selected to compare the predicted results with the actual results. The specific results are presented in Table 6.
Partial fabric quality prediction results.

According to the data in Table 6, the real-time transmission of loom data using OPC UA combined with the K-means-BP-PSO algorithm for real-time prediction of fabric quality shows a high degree of accuracy and can accurately predict the type and number of defects that may occur in the fabric produced by a weaving beam.
Conclusion
This study focuses on the production of fabrics in a weaving department. Through an in-depth analysis of the fabric production process, the factors affecting fabric quality in weaving production are clarified. Addressing the issues of various types of weaving equipment, non-standard communication, and repeated development that affect the timeliness of fabric quality prediction, this paper establishes an intelligent production method based on OPC UA to solve the challenges of data collection and fabric quality prediction in the weaving department. The introduction of the OPC UA protocol specification effectively addresses the data transmission problem caused by the diversity and heterogeneity of equipment in the weaving department and standardizes the data transmission process. By analyzing 13 factors such as the number of weft beats, rotation speed, warp and weft density, and the number of stops as input features of the fabric prediction model, and taking the defect type and quantity as the output value, a fabric quality prediction model based on the K-means-PSO-BP neural network is proposed, demonstrating the excellent performance of the algorithm. Finally, the effectiveness of OPC UA in data transmission of weaving equipment is verified, and the real-time prediction of fabric quality is successfully achieved, providing technical support for improving fabric quality and department management in weaving production. Although the OPC UA protocol has shown significant effectiveness in addressing equipment diversity and heterogeneity, further optimizing data transmission speed and processing efficiency to meet the real-time data demands of large-scale weaving workshops remains a future research direction.
Footnotes
Declaration of conflicting interests
The author(s) disclosed receipt of the following financial support for the research, authorship, and/or publication of this article: This work is supported by the Research Project of the Zhejiang Provincial Department of Education (Y202455953), the Zhejiang Sci-Tech University Research Start-up Fund, China (No. 23242083-Y) and the Science and Technology Program of Zhejiang Province, China (No. 2022C01202, No. 2022C01065).
Funding
The author(s) received no financial support for the research, authorship, and/or publication of this article.