
Abstract
The mechanical properties of coated fabric demonstrate significant material nonlinearity. Presently, testing methods to determine the engineering constants of coated fabric include uniaxial loading and biaxial loading. However, the engineering constants obtained through these methods often differ. This paper presents experimental investigations into the uniaxial and biaxial mechanical properties of architectural coated fabric. Initially, the elastic modulus and Poisson effect of the coated fabric under uniaxial tension are determined using non-contact measurement techniques. Subsequently, the influence of different stress ratio combinations on the engineering constants of coated fabric is explored through biaxial tensile testing. Finally, biaxial shear tests are conducted on architectural coated fabric to examine the effects of prestress and shear stress amplitude on the shear modulus. The results indicate that the orthogonal linear elastic model under the plane stress framework provides a high fitting accuracy for the biaxial tensile test data of coated fabric, with a maximum fitted RSS of 0.0843. Additionally, the calculated elastic modulus depends on the selection of the stress ratio group. The elastic modulus derived from the biaxial tensile test is smaller than that obtained from the uniaxial tensile test. Furthermore, the shear modulus of the coated fabric shows a linear positive correlation with the initial pretension value and decreases as the shear stress amplitude increases.
Introduction
Coated fabric as structural material
As an important part of spatial structures, membrane structures have been widely used in construction, industry, military, aerospace, and other fields. As the core part of membrane structures, coated fabric can provide many advantages, such as low cost, short construction time, light weight, large span, detachable, and reusable,1–4 as shown in Figure 1. Gaining strength and stability by applying prestress and curvature to coated fabric, these structures tend to be a structurally efficient way of shaping and covering spaces. Coated fabric is however, from a mechanical point of view, relatively complex materials. Consisting from a structural layer of woven fibers, which is then coated by any number of plastic coatings and finishing layers, they exhibit a complex nonlinear response when loads are applied.5–8 In addition, the interwoven nature of the material results in a strong interaction between the two main directions where a tensile load in one direction not only causes an extension in said direction, but also leads to a contraction in the orthogonal direction. This effect is referred to as the crimp interchange.9–11 The resulting material behavior is thus not only highly nonlinear but its mechanical response also displays an important dependency on the ratio between the load applied in the warp direction and the load applied in the weft direction. To incorporate this dependency in the design of tensile fabric structures uniaxial and biaxial tensile tests are necessary to provide the designer with appropriate stress-strain data and/or material constants.

Coated fabric as membrane structural material. (a) Membrane structure, (b) architectural coating fabric, and (c) substrate of coating fabric.
Testing standards of material constants
Research on the mechanical properties of coated fabric started in the 1980s. German and Japanese scholars successively proposed test methods to determine the engineering constants of coated fabric, which have been adopted by industry organizations or standards.12–16 The rapid development of the membrane structure industry and the wide application of coated fabric have attracted the attention of many scholars. A large number of experiments and studies on various coated fabric has been carried out, and corresponding design and testing procedures have been prepared.17–20 Coated fabric is thin, and the through-thickness dimension is much smaller than the typical in-plane dimensions. Therefore, coated fabric is generally modeled using a plane stress framework. Scholars have demonstrated, through comparing off-axis tensile test data with theoretical results, that coated fabric can be treated as orthotropic and elastic materials if the loading is less than 20% of the ultimate tensile stress. 21 Therefore, orthotropic linear elastic (OLE) model under plane stress states is widely used in extensive standards14,15,22 and literatures,23,24 which includes engineering constants such as tensile modulus, shear modulus, and Poisson’s ratio.25,26 Various countries have also formulated corresponding measurement criteria for engineering constants.
At present, the measurement methods for elastic modulus and Poisson’s ratio vary significantly among different countries. The Japanese standard MSAJ/M-02-1995 recommends five characteristic stress ratios (i.e. 1:1, 1:2, 2:1, 1:0, and 0:1, where the stress ratios in this paper all refer to the warp stress: weft stress). However, it excludes the test curves with stress ratios of 1:0 and 0:1 when calculating the engineering constants.12–14 The Institut Technique du Bâtiment et des Travaux Publics provides a design guide (referred to as the French Recommendations hereafter) that applies to pre-stressed permanent membrane structures. 27 The French Recommendations define the warp and weft elastic modulus as the secant modulus between the unloading endpoint of the first cycle and the unloading start point of the fifth cycle at 2:1 and 1:2 stress ratios, respectively. However, the French Recommendations do not provide a method to determine Poisson’s ratio. The American Standard ASCE/SEI 55-10 is similar to MSAJ/M-02-1995. It is worth mentioning that the ASCE/SEI 55-10 only uses the stress ratio data of 1:1, 2:1, and 1:2. Instead of combining these stress ratios in a biaxial test, new specimens are used for each stress ratio. 28 China Technical Specification for Membrane Structures (CECS 158: 2015) adopts the loading scheme recommended by MSAJ, but the improvement is that the test results of five stress ratios are used in the calculation of engineering constants, which is more reasonable. 22
As a typical woven composite, the stress ratio of the membrane surface has a significant effect on the tensile properties of coated fabric. The stress ratio of membrane surface is affected by many factors, such as the properties of coated fabric, the structure form, and the initial prestress. 15 For most membrane structures with curved surfaces, the stress of the membrane surface is uneven, which means that the stress ratio of the membrane surface is uneven. And the stress ratio may be higher than the recommended stress ratio in the standard, which is confirmed by the calculation results of a shell membrane structure in Jörg Uhlemann. 29 Therefore, to comprehensively consider the influence of stress ratio, test data of multiple stress ratios are often used in the calculation of engineering constants. Such as, MSAJ/M-02-1995 and CECS 158: 2015 adopted five stress ratios of 1:1, 2:1, 1:2, 1:0 and 0:1, covering the five kinds of stress ratios that are prone to occur in membrane structure.12,22 Furthermore, in order to further describe the nonlinear mechanical behaviors such as damage and viscoelasticity of coated fabric, some complex constitutive models have also been proposed.30–32
Progress in material constants testing
To promote the progress of membrane structure standards, some scholars have also conducted some meaningful work. Bridgens et al. calculated the elastic constants based on the method provided by MSAJ/M-02-1995 and analyzed the effect of enforcing the reciprocal relationship on robustness and sensitivity. 33 Ambroziak carried out biaxial tensile tests on PVDF-coated fabric with different stress ratios in order to identify the mechanical properties of the coated fabric. Based on this, two sets of initial material parameters of the dense net model and the orthotropic model were specified. 34 Craenenbroeck et al. conducted a series of tests based on the method of measuring engineering constants proposed in EN17117-1:2018 and proposed a method to verify and evaluate the statistical properties of derived constants. 35 Uhlemann et al. carried out biaxial tensile tests on four PVC-coated fabric and investigated the possibility of providing tensile stiffness parameter tables for specific materials. 36 Yu et al. studied the mechanical properties of PVC-coated fabric at high temperatures and after exposure to high temperatures by uniaxial tensile test. It was found that the combined effect of high temperature and constant external force enhanced the stiffness of the material and reduced the impact toughness of the material. 37 Sun et al. conducted uniaxial tensile tests on polyester-coated fabric at 23°C, 70°C, 100°C, 150°C, 200°C, 230°C, and 250°C, respectively. The experimental results showed that the elastic modulus and ultimate tensile strength of polyester-coated fabric decreased with the increase in temperature. The elongation at break first increased and then decreased with increasing temperature. 38 Uhlemann et al. proposed a new method considering three different inspection characteristics (irreversible strain increment, total strain increment, and intensity of nonlinearity) correlated to the saturated state for load cycles. 23
There are three common methods to test the shear properties of coated fabric, namely: off-axis tensile test, biaxial shear test, and picture frame shear test. 5 The off-axis tensile test can be easily performed on a uniaxial test machine, but heterogeneous deformation and shear rate cannot be controlled accurately. The shear deformation in the picture frame test is applied by a square frame with each corner of the square freely rotated. The picture frame is then loaded in the diagonal direction. According to the kinematic analysis of the square frame, the shear stress and shear angle can be determined. However, the operation process of the picture frame shear test is complex, which often requires the use of biaxial tensile equipment to apply to prestress and then uniaxial tensile equipment to carry out shear loading. 39 The TensiNet design guide recommends that the biaxial tensile test should be carried out on off-axis 45° cruciform specimens to investigate the shear properties of coated fabric.15,40 Compared with the above two methods, biaxial shear can more accurately calculate the shear strain and shear stress on the membrane surface. 41 The shear behavior of coated fabric shows significant nonlinear characteristics which are highly tensile stress level related. This leads to the fact that the shear stiffness of coated fabric is usually empirically determined. Since an accurate estimation of the shear stiffness is required.
In the design and analysis of membrane structures, engineering constants such as tensile modulus, shear modulus, and Poisson’s ratio of architectural coated fabric are essential. Currently, the testing methods for determining these engineering constants in coated fabric include uniaxial and biaxial loading tests. However, the engineering constants obtained from these two testing methods often differ. Therefore, it is crucial to comprehensively compare the elastic modulus and Poisson’s ratio of coated fabric under both uniaxial and biaxial tests. Additionally, the biaxial shear test is a new method for evaluating the shear performance of coated fabric, allowing for precise calculation of shear strain and shear stress. However, research is still lacking on the impact of key factors, such as pre-stress values and shear stress amplitudes, on the shear performance of coated fabric. To address the aforementioned issues, this manuscript conducted a series of uniaxial tensile, biaxial tensile, and biaxial shear tests on coated fabric. The layout of the present paper is as follows. In section “Materials and methodology,” the test methods and materials used in this paper are presented. Section “Results and discussion” provides the analysis engineering constants of PVC-coated fabric and PTFE-coated fabric under uniaxial tensile tests, biaxial tensile tests, and shear tests. Finally, some conclusions are presented in section “Conclusions.”
Materials and methodology
Different types of coated fabric were used as the research objects, including one PTFE-coated fabric and one PVC-coated fabric. Among them, PTFE-coated fabric is a type of coated fabric coated with a continuous polymer layer on the surface of a glass fiber fabric substrate. PVC-coated fabric is a type of coated fabric coated with a polymer continuous layer on the surface of a polyester fabric substrate. According to CECS 158: 2015, 22 the basic parameters of two test-coated fabric were measured, as shown in Table 1. Figure 2 shows the microscopic structure of the studied coated fabric by the supporting system of the Zeiss Smartzoom Digital Optical Microscope. The coated fabric is composed of two orthogonal yarn families, the so-called warp and weft. It is worth mentioning that the mechanical behaviors of coated fabric are mainly governed by the underlying woven structure, especially the mechanical properties of yarns. Xu et al. conducted tensile tests on the component materials of coated fabric, including internal yarns, and developed a microscopic finite element model based on their structural geometric dimensions. 42 This model can effectively predict the uniaxial and biaxial tensile behaviors of coated fabric and provides an intuitive understanding of how the component materials and microstructure influence their macroscopic mechanical properties.
Specification of the studied coated fabric.


Microscopic images of the coated fabric. (a) PTFE-coated fabric and (b) PVC-coated fabric.
Uniaxial tensile tests
According to CECS 158:2015, 22 the strip specimen was selected for the uniaxial tensile test. The width of the specimen was 50 mm, the length was 300 mm, and the clamp length was 200 mm. Additionally, speckles were arranged in the area of 50 × 50 mm in the center of the specimen to perform digital image correlation (abbreviated as DIC) measurements. The uniaxial tensile test equipment and dimensions of the specimen are shown in Figure 3. Uniaxial cyclic tensile tests were carried out on the warp and weft specimens of coated fabric to obtain the tensile modulus and Poisson’s ratio. Since the working prestress of coated fabric is generally less than 25% of the uniaxial ultimate tensile strength (abbreviated as UTS), the upper limit of the stress amplitude is set at 25% UTS, the lower limit is set at 0, the number of cycles is 5, and the loading rate is 30 N/s, as shown in Figure 4. The test was carried out at room temperature. Note that the load-displacement curve of the specimen was recorded by the uniaxial tensile testing machine, and the strain change in the speckle region was captured by DIC measurement. Each test group was effectively repeated three times.
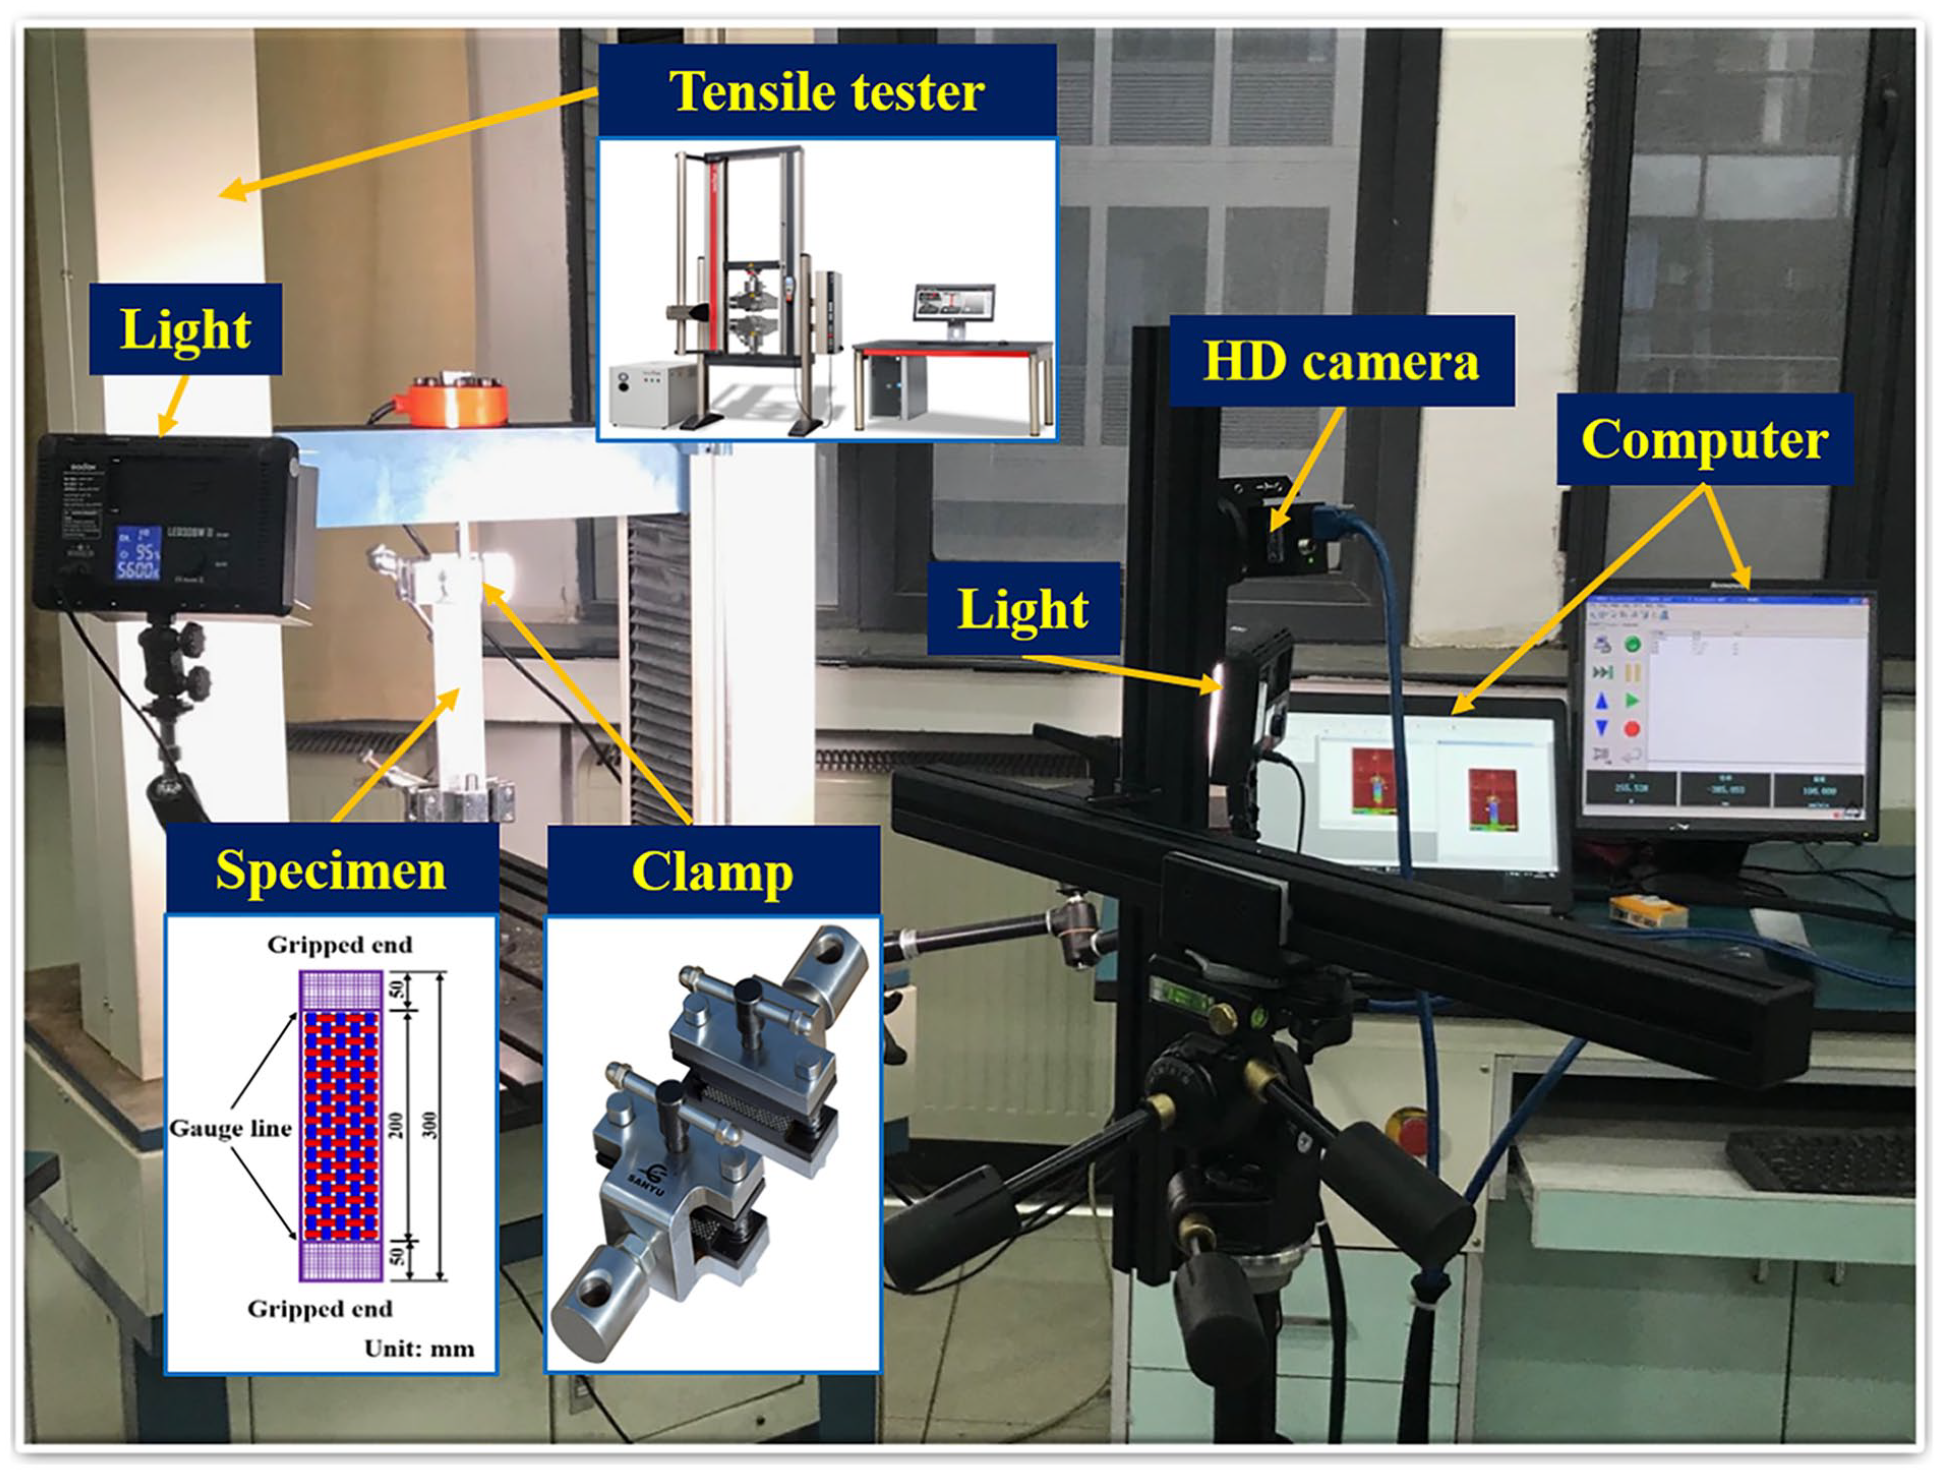
Uniaxial tensile equipment and specimen size (unit: mm).

Loading spectrum of uniaxial cyclic test.
Biaxial tensile tests
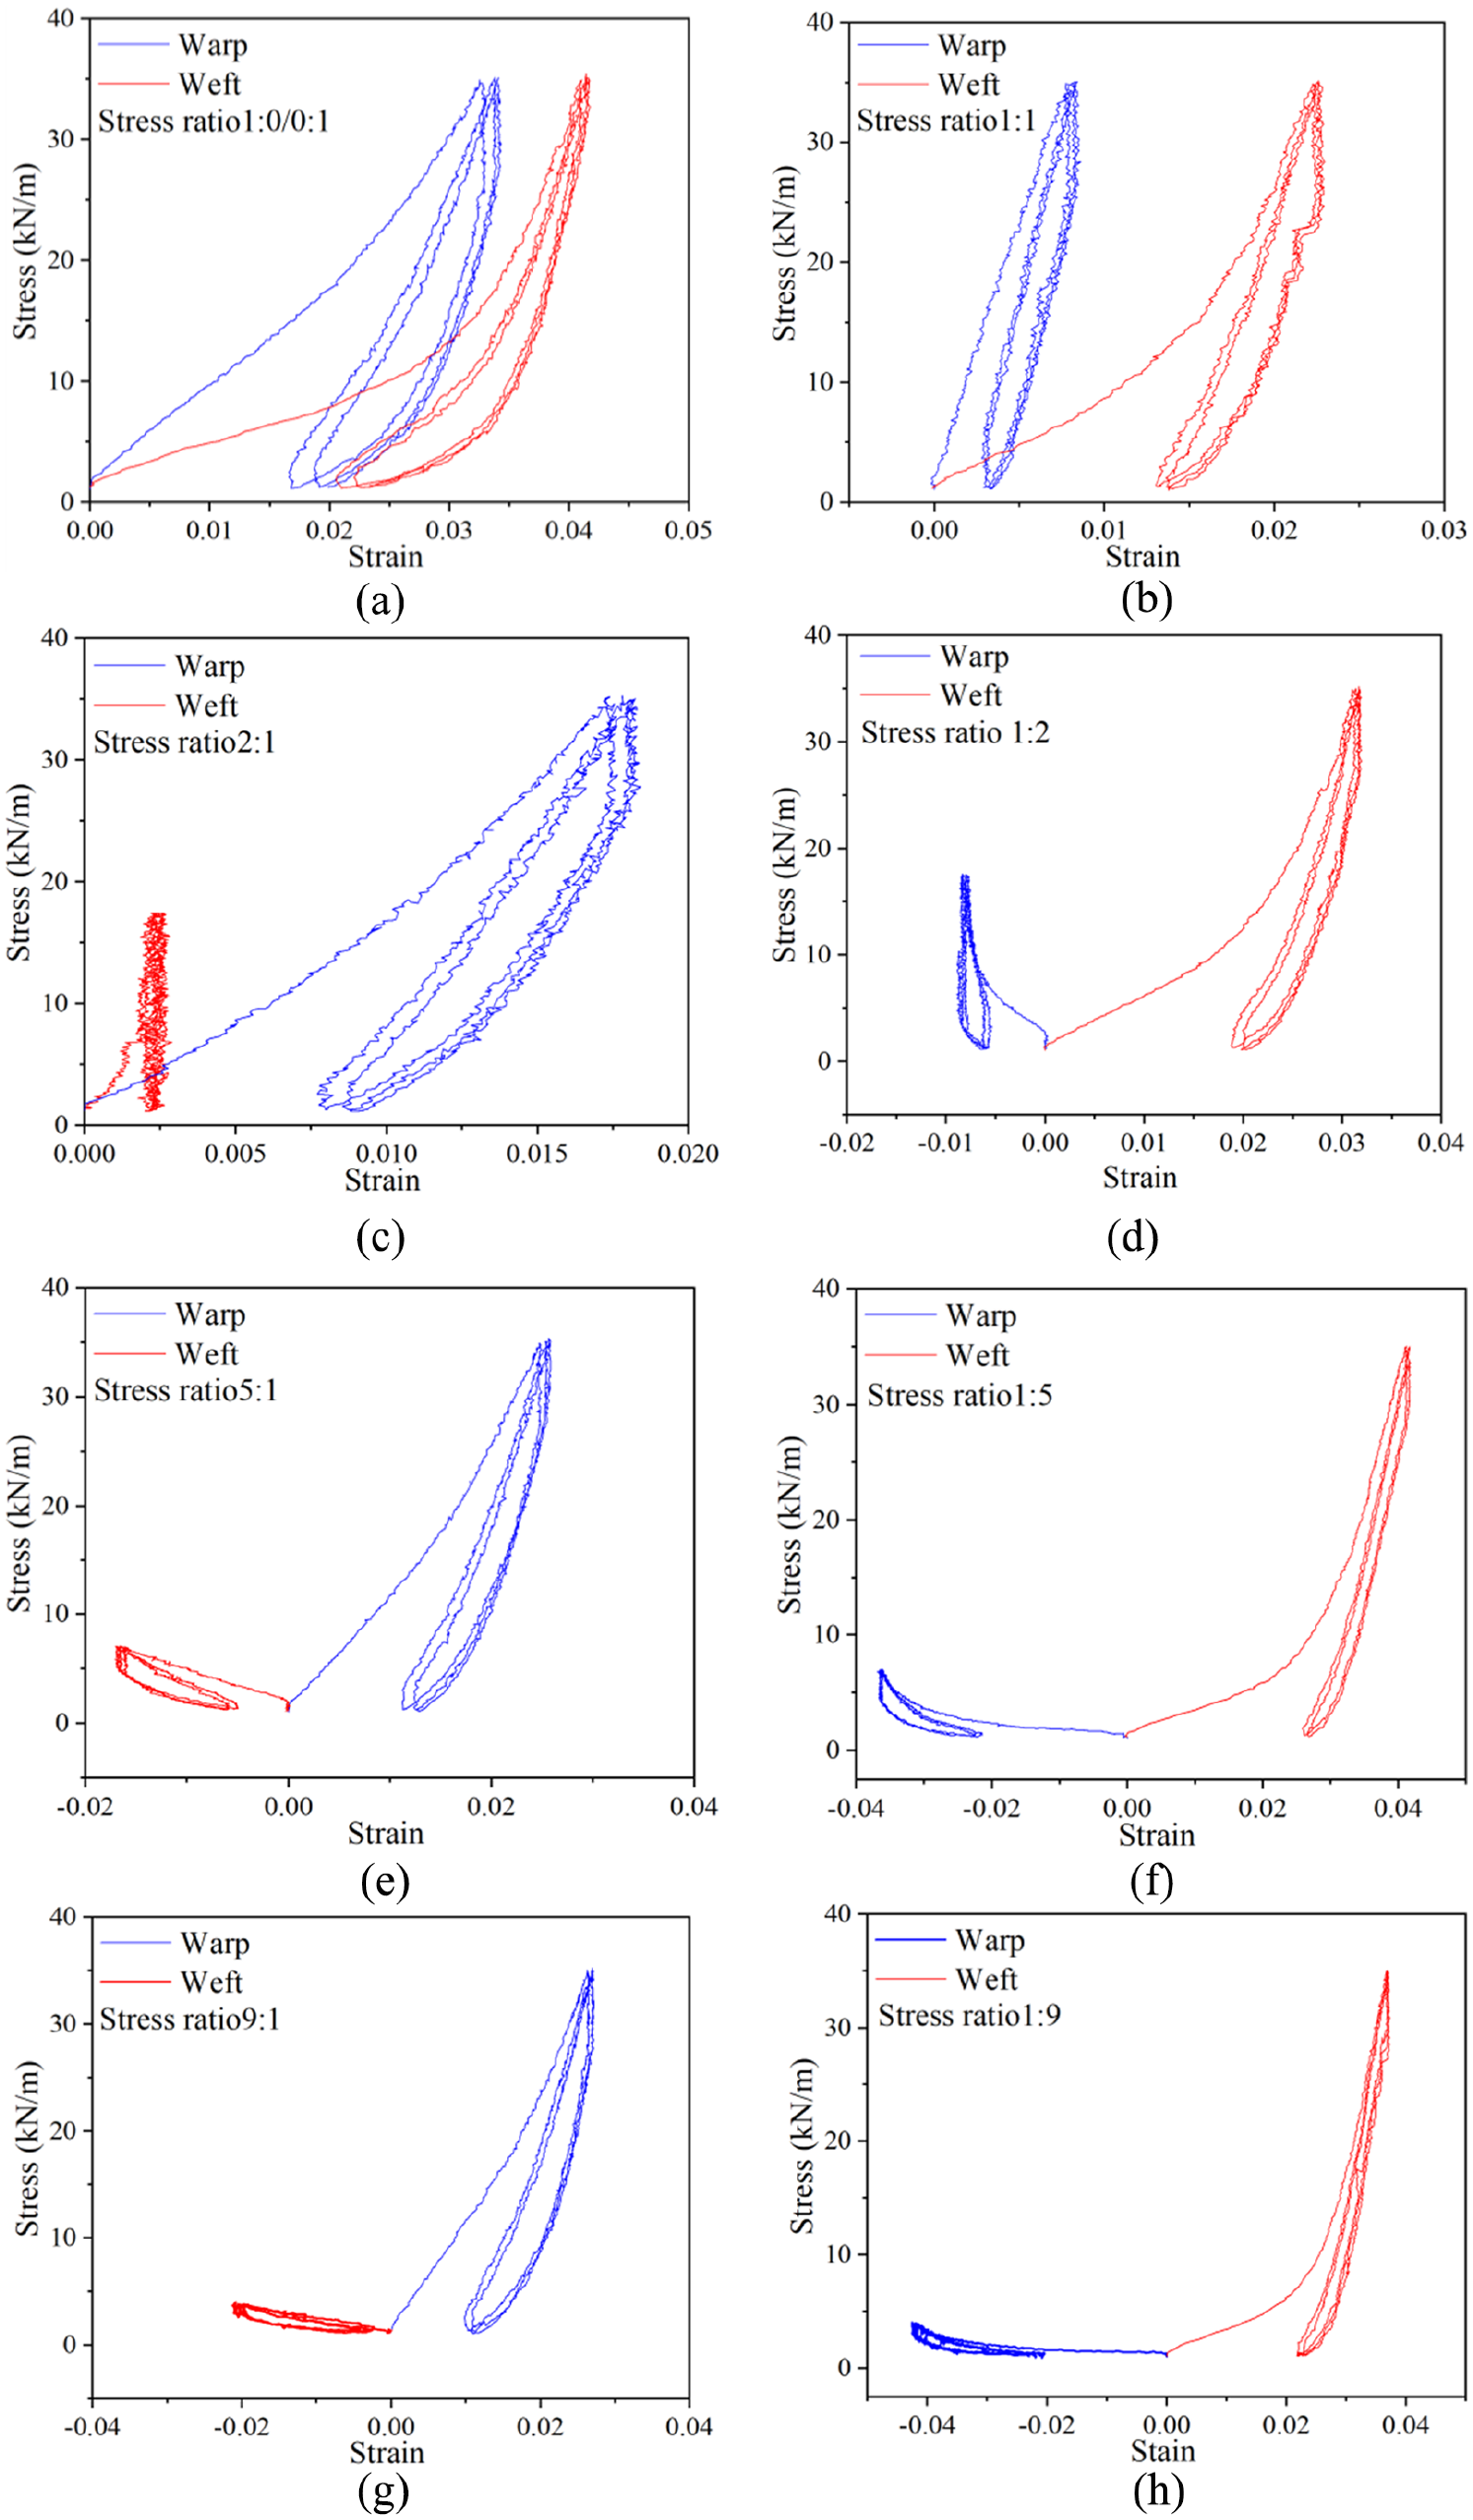
The biaxial loading test adopted the biaxial tensile testing machine independently developed by the Space Structure Research Center of Shanghai Jiao Tong University, which can achieve biaxial loading with different stress ratios and tensile rates, as shown in Figure 5(a). A cruciform specimen was adopted for the biaxial tensile test. The specimens are sampled symmetrically along the warp and weft directions of the coated fabric, with the effective center part measuring 160 × 160 mm, and the length of the loading arm was 225 mm. To ensure proper transfer of the tensile load to the center part, uniform slits were cut at intervals of 40 mm along the cantilever direction. Each corner between the arms is smoothly transitioned with a circular arch with a radius of 20 mm to avoid stress concentration. The clamp region of the specimen measured 50 × 160 mm. The end of the clamp region was formed by thermal bonding and welding to form a sleeve, and PE rods with a diameter of 12 mm were embedded for clamping. The specimen dimensions are illustrated in Figure 5(b). The biaxial tensile testing machine adopts force-controlled loading, and the displacement of measuring points of the specimen is recorded by a displacement meter. The distribution of measuring points of the displacement meter is shown in Figure 5(b). The loading rate of the biaxial tensile tests was 10 kN/m/min. In general, the stress ratio on the membrane surface of a membrane structure needs to be controlled within a small range to prevent adverse phenomena such as wrinkles or relaxation. However, in reality, due to factors such as the surface form of membrane structures, load randomness, and differences in warp and weft performance of coated fabric, stresses are not uniform over a membrane surface in most load cases, with high stress ratios often manifesting on the membrane surface. Hence, nine stress ratios (1:1, 1:2, 2:1, 1:0, 0:1, 5:1, 1:5, 9:1, and 1:9) were considered in the biaxial tensile test, and the test loading spectra are shown in Figures 6 and 7.

Biaxial tensile equipment and specimen size (unit: mm). (a) Biaxial tensile machine and (b) geometric dimensions of cruciform specimens.

The stress ratio in the biaxial tensile test.

Loading spectrum of the biaxial cyclic tensile test under different stress ratios. (a) Stress ratio of 1:1, (b) stress ratio of 1:0, (c) stress ratio of 0:1, (d) stress ratio of 2:1, (e) stress ratio of 1:2, (f) stress ratio of 5:1, (g) stress ratio of 1:5, (h) stress ratio of 9:1, and (i) stress ratio of 1:9.
Biaxial shear tests
The specimen size of the biaxial shear test is consistent with that of the biaxial tensile test. It is worth noting that the specimens in the biaxial shear test are no longer sampled symmetrically along the warp and weft directions of the coated fabric, but in the direction of 45° off the axis. Three shear stress ranges (i.e. ±1, ±1.5, and ±2 kN/m) and three prestressed stresses (i.e. 4, 6, and 8 kN/m) were considered. The loading spectrum of the biaxial shear test is shown in Figure 8. The loading rate of the biaxial shear test was 10 kN/m/min. To ensure the constant initial loading state of the cruciform specimen, the initial prestress value was set as 1.25 kN/m, and the data collection frequency was 1 Hz. The test was carried out at room temperature, and the load-displacement curve of the specimen was recorded during the test.

Loading spectrum of biaxial shear test.
Results and discussion
Since the thickness of the coated fabric is usually less than 1 mm and the thickness of the coated fabric is not uniform, the unit of stress of coated fabric is generally kN/m or N/mm rather than MPa. This is also reflected in the standards pertaining to membrane structure.12,15 Taking the shape of the specimen before deformation as the reference configuration, the engineering stress and strain of the coated fabric are calculated as:
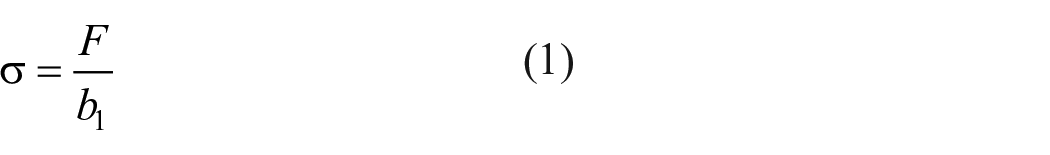
Where
Uniaxial tensile
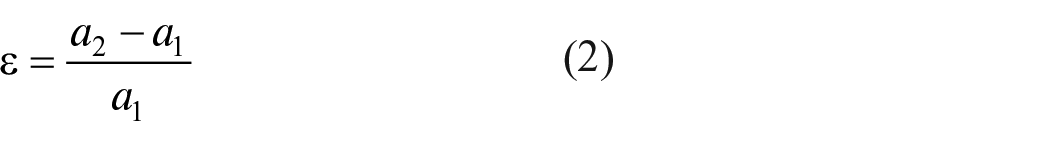
The uniaxial cyclic tensile stress-strain curves of the coated fabric are depicted in Figure 9. The mechanical behavior of coated fabric exhibits significant nonlinearity under uniaxial load. The material’s nonlinearity arises from two key factors: (a) the inherent nonlinearity of the material itself, as observed in polyester (with glass behaving linearly elastic), and (b) the nonlinearity caused by the crimp of the woven yarns, which results in nearly strain-free geometrical elongation during decrimping under tensile stress. Additionally, the warp and weft yarns interact biaxially, leading to the phenomenon of crimp interchange.5,7,8 As the yarns in one direction straighten under tensile stress, they induce stronger crimping in the orthogonal direction. This crimp interchange is particularly evident under uniaxial stress, where large contractions perpendicular to the applied stress are observed. These substantial transverse strains are characteristic of woven fabrics, especially in glass fiber fabrics, where transverse strains can be up to twice the longitudinal strains. 29
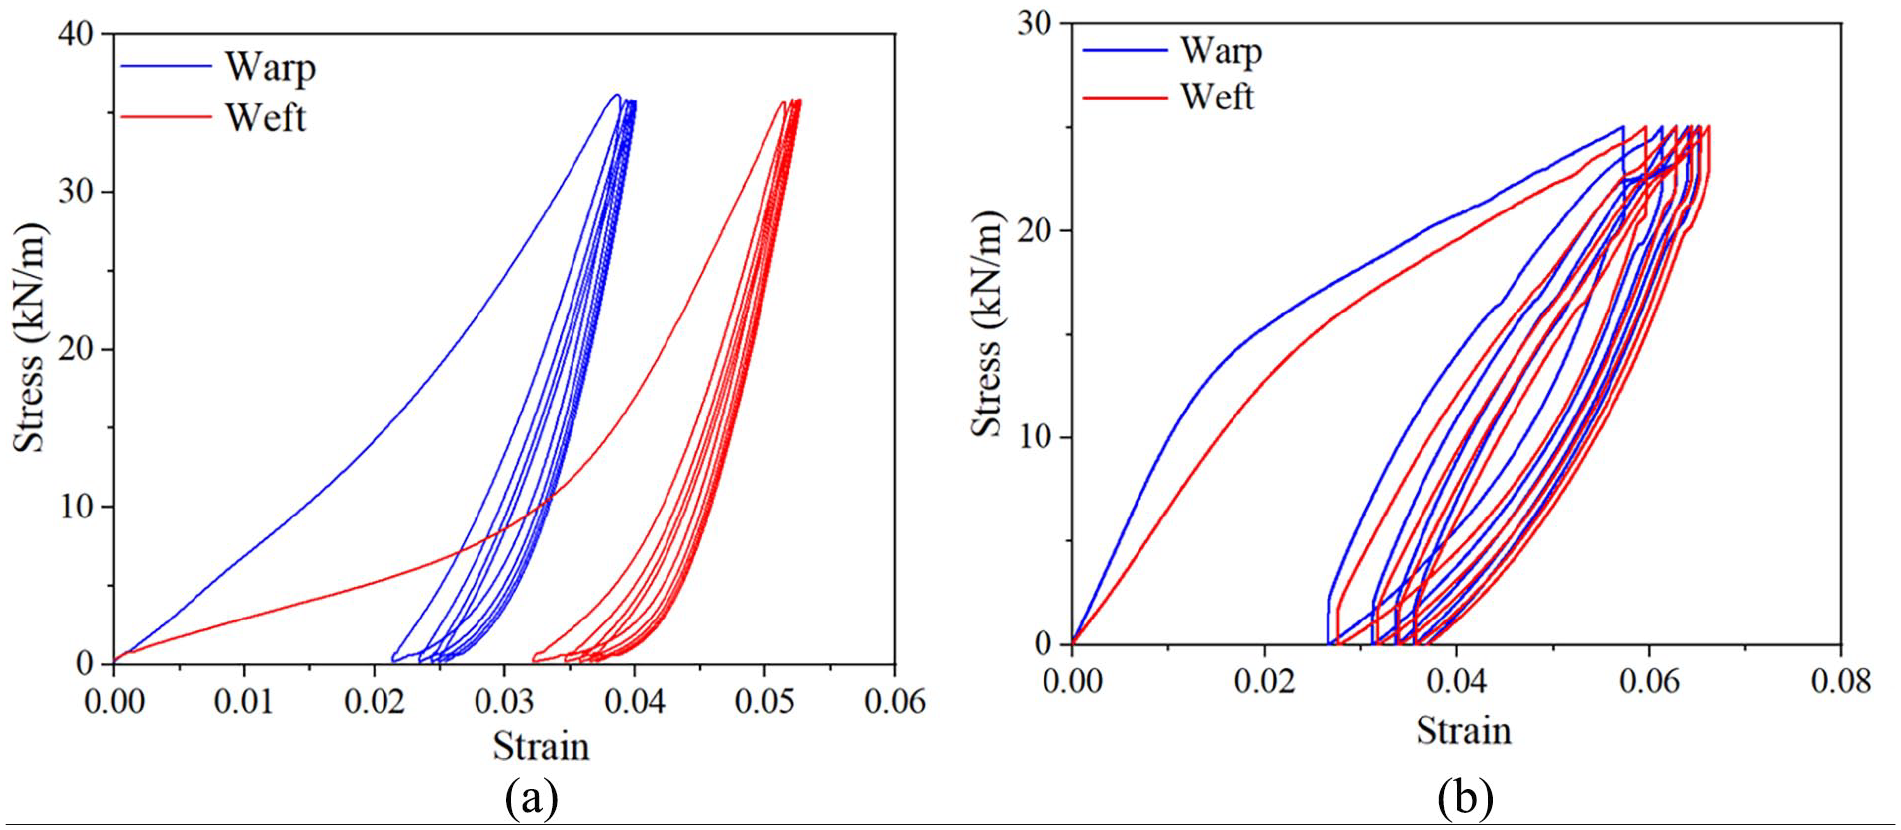
Uniaxial cyclic tensile stress-strain curves. (a) PTFE-coated fabric and (b) PVC-coated fabric.
As shown in Figure 10, the rising stage in the uniaxial cyclic tensile stress-strain curve was observed, and residual deformation was artificially eliminated. The yarn structure changed after loading, resulting in a significant reduction in the yarn’s crimp degree. Consequently, the nonlinearity of the stress-strain curve was weakened. This also explains the need for multiple cycles of tensioning and unloading in the construction process of the membrane structure. Furthermore, as the number of cycles increases, the linearity of the stress-strain curve gradually improves, although the rate of change gradually slows down. After unloading in the first load cycle, a considerable permanent strain is observed, primarily due to the straightening of the yarns. Once straightened, the yarns do not fully recover their initial crimp due to friction between them. In subsequent load cycles, additional permanent strains occur, but the magnitude of incremental strain progressively decreases. Concurrently, the stress-strain relationship tends to become increasingly linear with the number of load cycles. The slope of the stress-strain curves initially increases with the first few load cycles, but this trend diminishes as the load cycles continue. Ultimately, the stress-strain behavior approaches an elastic response.

Uniaxial tensile stress-strain curves after different the number of cycles. (a) PTFE-coated fabric (warp), (b) PTFE-coated fabric (weft), (c) PVC-coated fabric (warp), and (d) PVC-coated fabric (weft).
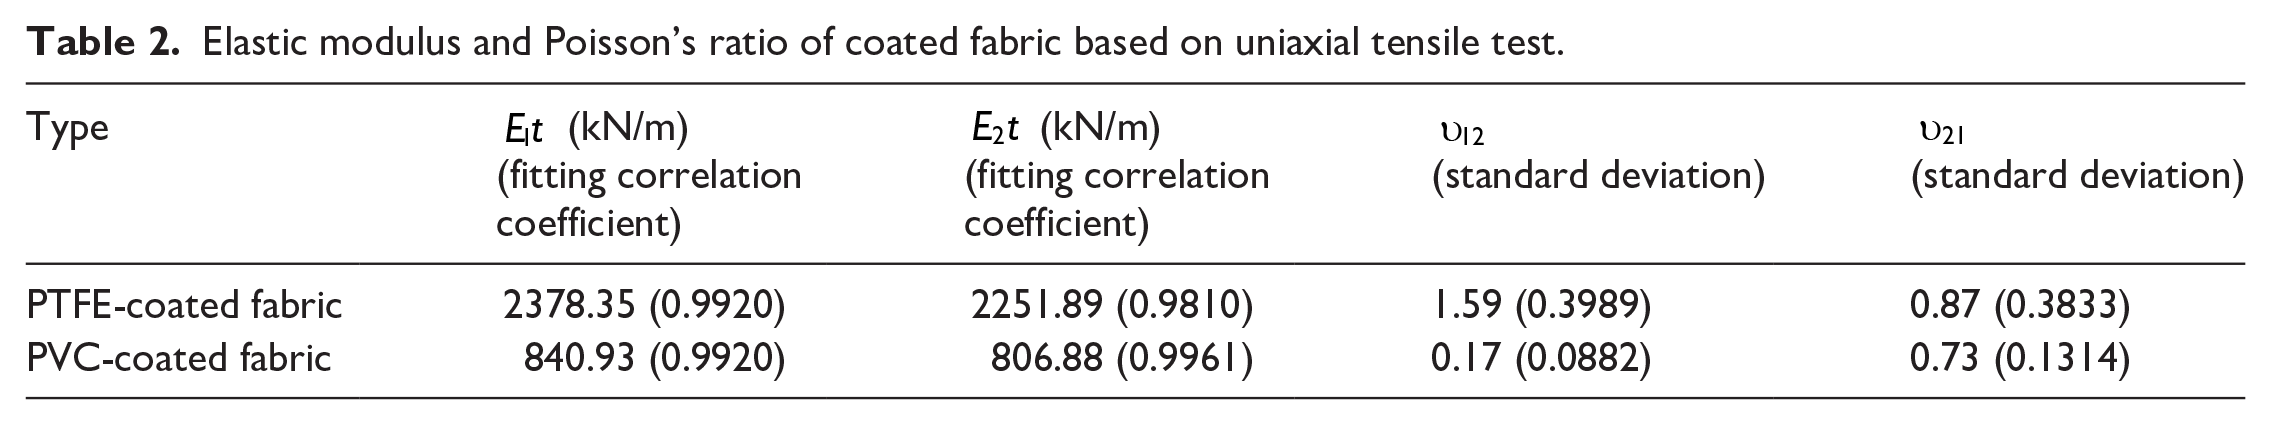
The stress-strain curve of the coated fabric during the initial tensile process is evidently nonlinear. Utilizing a constant elastic modulus to depict the stress-strain curve in the initial tensile process will result in significant errors. Considering that the nonlinearity of the coated fabric is substantially diminished after cyclic tensile testing, the uniaxial tensile elastic modulus of the coated fabric can be determined by linearly fitting the stress-strain curve following cyclic tension. The fifth tensile stress-strain curve of the two coated fabric are subjected to linear fitting, and the fitting results are presented in Table 2.
Elastic modulus and Poisson’s ratio of coated fabric based on uniaxial tensile test.
It is difficult to measure the transverse deformation of the specimen by displacement meter during the uniaxial tensile test, hence the transverse deformation was measured by DIC, and the Poisson’s ratio was calculated based on the measured results. In this paper, the speckle deformation analysis was performed by 2D DIC software Ncorr V1.2, which is an open-source software based on the MATLAB platform. As shown in Figure 11, the speckled area was located in the center of the rectangular specimen with a size of 50 × 50 mm. Ten evenly distributed points on the center line were selected as the transverse strain extraction points. It should be noted that stress concentration may occur at the edge of the specimen, so the measurement points were selected far away from the edge of the specimen. Taking PTFE-coated fabric as an example, the DIC test results are shown in Figure 12.

Schematic diagram of DIC measurement area and specimen deformation.

DIC results of PTFE-coated fabric. (a) Y direction displacement (unit:mm) and (b) X direction displacement (unit:mm).
Previous studies have shown that the Poisson’s ratio of the coated fabric is not constant during uniaxial tension. 43 The variation curves of Poisson’s ratio in the warp and weft directions of coated fabric with increasing axial tensile strain, as shown in Figures 13 and 14. It can be seen that the Poisson’s ratio of coated fabric decreases with increasing uniaxial tensile strain. Therefore, the average Poisson’s ratio provided in this paper serves as a direct reference, as shown in Table 2.

The curves of Poisson’s ratio versus axial strain for PTFE-coated fabric. (a)

The curves of Poisson’s ratio versus axial strain for PVC-coated fabric. (a)
Biaxial tensile
Biaxial cyclic tensile stress-strain curves of the coated fabric under different stress ratios are shown in Figures 15 and 16. It is evident from the figures that the coated fabric exhibits significant nonlinearity under biaxial tensile load. Furthermore, the mechanical properties of the coated fabric are significantly influenced by the stress ratio. This is primarily due to the varying degrees of crimp for warp and weft yarns inside the coated fabric, resulting in differences in the macroscopic mechanical behavior of the coated fabric under different stress levels. In the biaxial tensile cycle curve of the 1:1 stress ratio, it is notable that the warp direction strain is significantly less than the weft direction strain under the same tensile load, indirectly indicating that the crimp degree of the weft yarns in the internal structure of the coated fabric is generally higher than that of the warp yarns. Comparing the stress-strain curves of the 1:0/0:1 stress ratio and the 1:1 stress ratio reveals that the strain under biaxial loading is considerably smaller than that under uniaxial loading. This phenomenon occurs because the internal yarns are constrained to each other under biaxial tensile load. As the biaxial tensile process progresses, yarns with a large load gradually straighten from a crimped state, while yarns in the other direction become more crimped. When the strain generated by the applied tensile load is less than the compressive strain generated by the crimped yarn, the yarn in this direction experiences compression. Therefore, when the loads applied in the warp and weft directions are not equal (i.e. the stress ratio is not equal to 1:1), compressive strain (negative strain) is likely to occur in the direction with a small applied load, leading to the formation of wrinkles in the coated fabric.
Biaxial cyclic tensile stress-strain curves of PTFE-coated fabric under different stress ratios. (a) Stress ratio of 1:0/0:1, (b) stress ratio of 1:1, (c) stress ratio of 2:1, (d) stress ratio of 1:2, (e) stress ratio of 5:1, (f) stress ratio of 1:5, (g) stress ratio of 9:1, and (h) stress ratio of 1:9.

Biaxial cyclic tensile stress-strain curves of PVC-coated fabric under different stress ratios. (a) Stress ratio of 1:0/0:1, (b) stress ratio of 1:1, (c) stress ratio of 2:1, (d) stress ratio of 1:2, (e) stress ratio of 5:1, (f) stress ratio of 1:5, (g) stress ratio of 9:1, and (h) stress ratio of 1:9.
The substrate of PTFE-coated fabric is linear elastic glass fiber, thus the nonlinearity of the macroscopic tensile properties of PTFE-coated fabric mainly stems from the crimp interchange between yarns. As observed in Figure 15, when the weft direction stress exceeds the warp direction stress (i.e. stress ratios of 1:2, 1:5, and 1:9), the stress-strain curve in the low-stress region exhibits significant nonlinearity, transitioning into linearity after reaching a certain stress level. It’s noteworthy that the slopes of the linear stage are relatively similar. Conversely, when the warp direction stress surpasses the weft direction stress (i.e. stress ratios of 2:1, 5:1, and 9:1), the nonlinearity of the stress-strain curve is notably diminished during initial tensile loading. This phenomenon primarily arises from the stretching of the warp yarn, which increases the crimp degree of weft yarns. However, since the weft yarn remains crimped due to the lower load, the stress-strain curve of the coated fabric remains linear. Therefore, when utilizing PTFE-coated fabric, it is advisable to prioritize the warp direction as the main force-bearing direction, ensuring that the warp direction stress exceeds the weft direction stress. Under these conditions, the performance of the coated fabric closely aligns with the elasticity assumption outlined in the specifications.
The substrate of PVC-coated fabric consists of elastoplastic polyester fiber with a significant strain-strengthening stage, resulting in a notable disparity between the macroscopic stress-strain curve of PVC-coated fabric and PTFE-coated fabric. The nonlinearity of PVC-coated fabric is attributed not only to changes in internal yarn structure but also to the material nonlinearity of fibers. As depicted in Figure 16, the stress-strain curve of PVC-coated fabric during initial tensile loading exhibits nonlinearity and a pronounced turning point. It is evident that the stress-strain curves for stress ratios of 1:0 and 0:1 are closely aligned. This phenomenon is also observed in the uniaxial tensile stress-strain curves of PVC-coated fabric. The primary reason for this similarity is the yarn pretension technique (Precontraint®),44,45 which reduces differences in the geometric structure of the two-direction yarn of PVC-coated fabric. However, when the stress ratio is 1:1, the mechanical properties of PVC-coated fabric in the warp and weft directions exhibit significant disparities, indicating that the interaction between the two directions of yarn during biaxial loading significantly impacts the tensile properties of the coated fabric, even if the initial mesostructure of the yarn in the warp and weft directions is similar. Additionally, it is observed that when the stress ratio is 5:1, there is still no compressive strain in the weft direction of the coated fabric, whereas compressive strain occurs in the warp direction when the stress ratio is 1:2. This indirectly suggests that when the warp direction stress exceeds the weft direction stress, PVC-coated fabric is less prone to compressive strain. Therefore, when utilizing PVC-coated fabric, it is also imperative to prioritize the warp direction of the coated fabric as the main force-bearing direction to mitigate wrinkles and relaxation on the membrane surface.
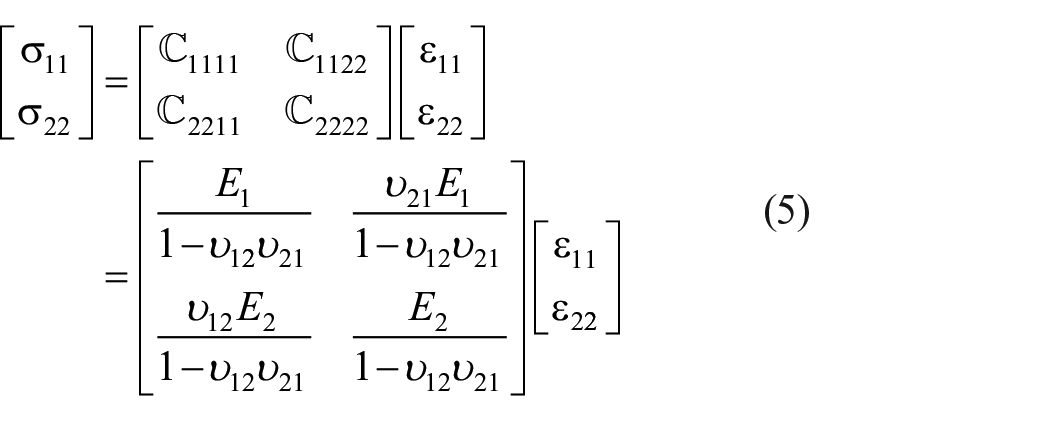
The linear elastic constitutive model based on the assumption of small deformation can be expressed as:

Where

The least square method is widely used in the calculation of engineering constants of coated fabric. Considering the normal stresses (
To satisfy the symmetry of the stiffness matrix, the warp and weft elastic moduli and Poisson’s ratio need to satisfy equation (6). The constraint is used to solve the engineering constant of coated fabric in the CECS 158: 2015 and MSAJ/M-02:1995. However, Bridgens et al. 33 considered that stiffness matrix symmetry is an energy conservation requirement, which applies to homogeneous materials. As a typical multiphase composite material, the friction and slip between the components of the coated fabric will consume part of the energy during the tensile process. Identifying the engineering constants of coated fabric by biaxial tensile data is the best fit for the test data since it is not necessary to strictly enforce this constraint. Moreover, Bridgens et al. 33 found that this constraint has little effect on the final calculation results of the engineering constants of coated fabric. Therefore, this constraint is also not considered in the process of solving engineering constants of coated fabric in this paper.

The residual objective function needs to be defined to solve the engineering constant with the least square method. Considering the biaxial tensile tests conducted in this paper are under force loading, and the strain is the response quantity. Therefore, the residual objective function with strain as the variable is established, which is as follows:

Where

The linear elastic constitutive model cannot adequately capture the nonlinear behavior due to the significant nonlinearity of the stress-strain curve of the coated fabric during the initial tension. Therefore, the third tension curve in the cyclic loading process is selected to obtain the engineering constants of coated fabric. The nonlinearity of the curve at this stage is significantly weakened, which is closer to the linear elastic constitutive model. The engineering constants of coated fabric obtained based on this stage apply to the structural analysis of membrane structures. Moreover, considering that the mechanical properties of coated fabric are significantly affected by stress ratio, the test data under multiple stress ratios are selected to solve the engineering constants of coated fabric. Four extra stress ratios (5:1, 1:5, 9:1, and 1:9) are considered to study the influence of the stress ratios on the engineering constants of coated fabric.
The elastic modulus and Poisson’s ratio of coated fabric were determined by MATLAB program. Table 3 shows elastic modulus and Poisson’s ratio in warp and weft directions obtained for the two coated fabric considering the combination of different stress ratios. It can be found that the elastic modulus of PTFE-coated fabric is significantly higher than that of PVC-coated fabric. The Poisson’s ratio of PTFE-coated fabric is higher than 0.5, while the Poisson’s ratio of PVC-coated fabric is between 0.1 and 0.4. It indicates that there is a significant interaction between warp and weft yarns during the tensile process of PTFE-coated fabric, which is also the reason for the occurrence of negative strain under some stress ratios in the biaxial tensile. For isotropic materials, Poisson’s ratio should be less than 0.5, while for composites, especially woven composites, it is common for Poisson’s ratio to exceed 0.5 or even 1.
Elastic modulus and Poisson’s ratio of the coated fabric under different stress ratio combinations.

By comparing the calculation results of engineering constants under 5, 7, and 9 groups of stress ratios, it is found that the warp elastic modulus of coated fabric decreases gradually with the increase of the types of stress ratios considered. The weft elastic modulus remains unchanged after the first significant decrease. Poisson’s ratios of the warp and weft directions increase significantly. Besides, it can be observed that the more types of stress ratios are considered, the obtained elastic moduli of warp and weft directions are closer, but the cumulative error of fitting increases. This phenomenon is inconsistent with the orthotropic mechanical characteristics of coated fabric. This also means that it is not the optimal scheme to solve the engineering constants of coated fabric by considering as many stress ratios as possible.
Taking the stress ratio recommended by the standard as an example, it can be observed that the elastic modulus calculated based on the biaxial tensile test is smaller than that based on the uniaxial tensile test. The maximum deviations of elastic modulus in warp and weft directions are 4.89 and 33.43% respectively. The Poisson’s ratio calculated based on the biaxial tensile test is significantly lower than that of the uniaxial tensile test. This phenomenon is mainly affected by the coupling effect of biaxial tension. There is no transverse constraint in the uniaxial tensile state of coated fabric. However, both directions are constrained in the biaxial tensile state of coated fabric, which limits the transverse deformation to some extent. Since membrane structures are mostly in a biaxial tensile state, Poisson’s ratio calculated based on biaxial tensile test data is more reasonable.
Figures 17 and 18 illustrate the comparison between the predicted results of the OLE model and the test data. As the variety of stress ratios considered increases, the prediction accuracy of the OLE model decreases, particularly noticeable with a stress ratio of 1:1. For the stress ratio test data not considered in the calculation process, the final prediction accuracy substantially diminishes. For example, when examining five stress ratios (i.e. 1:1, 2:1, 1:2, 1:0, and 0:1), the resulting OLE model demonstrates higher prediction accuracy for stress-strain curves with ratios of 1:1, 2:1, 1:2, 1:0, and 0:1, while accuracy declines for ratios such as 5:1, 1:5, 9:1, and 1:9. In determining the engineering constants of coated fabric, the overall prediction accuracy decreases with an increase in the variety of selected stress ratios. Therefore, when determining the engineering constants of coated fabric, the stress ratio should be chosen in conjunction with the potential stress ratio range of the designed membrane structure. While standard procedures may provide guidelines, the selection of stress ratios in solving the elastic constants of coated fabric should consider the specific form of the membrane structure and the properties of the coated fabric to avoid compromising prediction accuracy.

Comparison between prediction results of the OLE model and test data for PTFE-coated fabric. (a) Stress ratio of 1:1, (b) stress ratio of 2:1, (c) stress ratio of 1:2, (d) stress ratio of 1:0/0:1, (e) stress ratio of 5:1, (f) stress ratio of 1:5, (g) stress ratio of 9:1, and (h) stress ratio of 1:9.

Comparison between prediction results of the OLE model and test data for PVC-coated fabric. (a) Stress ratio of 1:1, (b) stress ratio of 2:1, (c) stress ratio of 1:2, (d) stress ratio of 1:0/0:1, (e) stress ratio of 5:1, (f) stress ratio of 1:5, (g) stress ratio of 9:1, and (h) stress ratio of 1:9.
Shear behavior
Chen et al. proposed a calculation method for the shear modulus of coated fabric based on the biaxial shear test.39–41 In this method, the coated fabric is subjected to coupled shear-tension loads, and the normal stress can be kept constant. The direction of change of shear stress on the membrane surface in actual engineering also changed with the load carried. Therefore, the positive and negative alternating shear loading can comprehensively reflect the deformation of coated fabric in two shear directions. The deformation diagrams of the core area of the specimen in the biaxial shear test are given in Figure 19, where the dashed line and the solid lines are the initial state and the state after deformation respectively. The symbols in the figure are defined as follows,
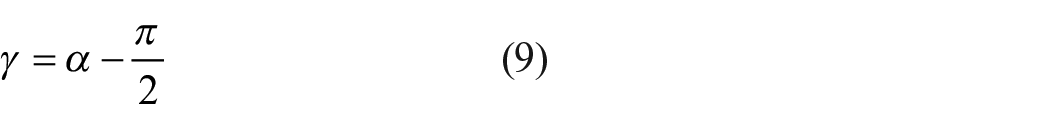
According to the geometric relation, the angle

The strains in the X-axis and Y-axis directions are introduced into equation (4), and

Therefore, the shear strain can be expressed as:


Schematic diagram of the biaxial shear test specimen and shear deformation. (a) Schematic diagram of a cross-shaped specimen 45° off-axis and (b) deformation diagram of the core area.
The schematic diagram of the stress state in the core area of the biaxial shear test is given in Figure 20. The symbols in the figure are defined as follows,
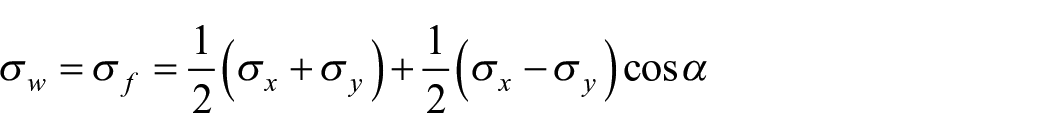

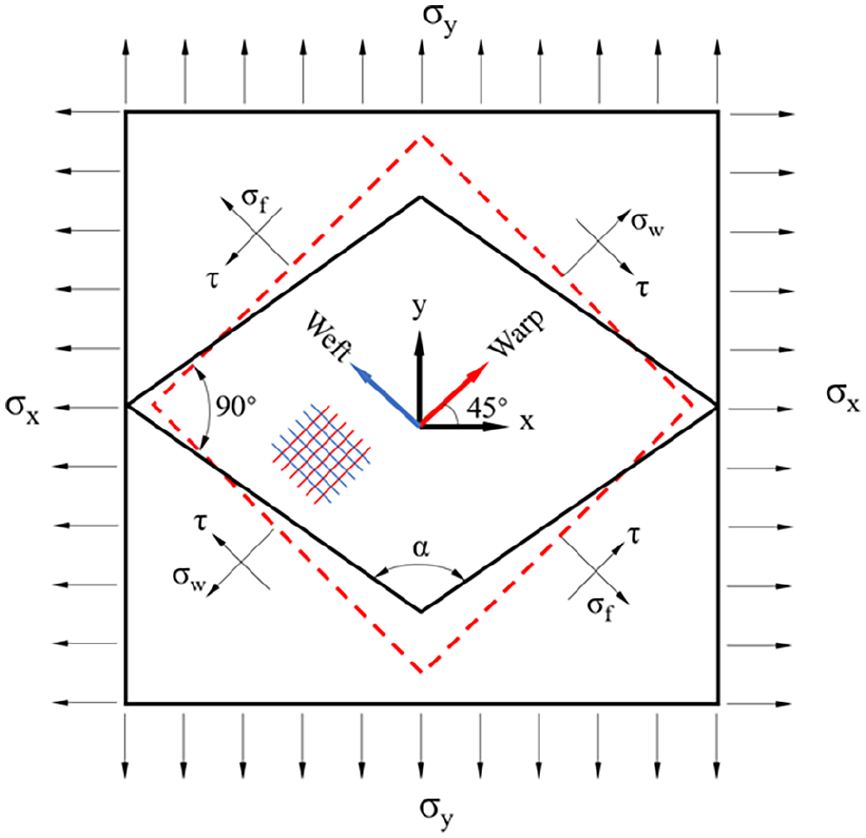
Schematic diagram of stress state in the core area of biaxial shear test.
When the shear strain γ is small and α is close to 90°, equation (13) can be simplified as follows:


To keep a single variable in the biaxial shear test process, the biaxial shear loading spectrum shown in Figure 8 was formulated according to equation (14). The normal stress on the membrane surface remained constant, while the shear stress was cyclically loaded with a constant amplitude of positive and negative. For example, when the prestress is 8 kN/m and the shear stress amplitude is 2 kN/m, set the upper and lower limits of the stress amplitude in X and Y directions to 10 kN/m and 6 kN/m respectively, as shown in Figure 8. The changes of normal stress and shear stress in the center part of the specimen can be calculated according to equation (14), as shown in Figure 21.

Time history curves of normal stress and shear stress in the biaxial shear test.
Figure 22 illustrates the shear stress-shear strain curve of the coated fabric under a prestress of 4 kN/m and a shear stress amplitude of 2 kN/m. The coated fabric exhibits a significant nonlinear response to shear stress. However, as the shear stress gradually increases from 0 to the maximum value for the second time, the shear stress-shear strain curve becomes nearly linear. Consequently, the last two stable shear cycle curves are typically chosen for analyzing the shear behavior of the coated fabric. When the shear stress is reduced to 0, the residual strain varies with the number of cycles. This behavior is akin to the tensile curves observed during uniaxial and biaxial loading, primarily attributed to the delayed recovery of yarn crimping during the unloading stage. Additionally, it is evident that the hysteresis curve of PTFE-coated fabric under reciprocating shear stress is more pronounced than that of PVC-coated fabric, indicating the superior shear energy dissipation properties of PTFE-coated fabric.

Shear stress-shear strain curve (prestress 4 kN/m, shear stress amplitude 2 kN/m). (a) PTFE-coated fabric and (b) PVC-coated fabric.
The stable shear stress-shear strain curve can only be obtained after the coated fabric undergoes initial loading. For shear performance analysis of the coated fabric, the third hysteresis curve under different shear stress amplitudes was extracted, as shown in Figure 23. The shear stress-strain curve of PTFE-coated fabric is significantly affected by the shear stress amplitude, while the curve alignment of PVC-coated fabric is higher under different shear stress amplitudes. Figure 24,illustrates the clear influence of prestress on the shear stress-shear strain curve of the coated fabric. Since the stiffness of coated fabric primarily arises from prestressing, it’s essential to investigate the impact of prestress value on the shear stiffness of the coated fabric.

Shear stress-strain curves of coated fabric under different stress amplitudes. (a) PTFE-coated fabric and (b) PVC-coated fabric.

Shear stress-strain curves of coated fabric under different prestress. (a) PTFE-coated fabric and (b) PVC-coated fabric.
Considering the difference between the shear stress-shear strain curves under positive and negative shear stress, the shear moduli for each loading process are calculated separately. Figure 25 illustrates the shear modulus obtained by fitting the loading section of both positive and negative shear stress with the least square method. Here, G+ represents the shear modulus during positive shear stress loading, while G− represents the shear modulus during negative shear stress loading.

Schematic diagram of shear modulus.
Tables 4 and 5 present the fitting results and fitting errors of the shear modulus for the tested coated fabric. The R2 values are all close to 1, indicating that the shear stress-shear strain curve of the surface at this stage is close to linear, and the constant shear modulus can better represent the shear properties. Given the difficulty in determining whether the shear stress is positive or negative in actual membrane structures, the method of calculating the average value of the shear modulus is used to comprehensively evaluate the shear properties. It is noted that the shear modulus ranges between 5 and 30 kN/m, significantly lower than the tensile modulus. This is also a typical mechanical characteristic of woven fabrics.
Shear modulus of PTFE-coated fabric under different prestress and shear stress amplitude (unit: kN/m).

Shear modulus of PVC-coated fabric under different prestress and shear stress amplitude (unit: kN/m).

Figure 26(a) illustrates the variation curves of shear modulus under different prestresses (stress amplitude is ±2.0 kN/m). The shear modulus of the coated fabric increases linearly with increasing prestress. This is attributed to the fact that prestress indirectly enhances the frictional interaction between warp and weft yarns. As the coated fabric primarily resists shear deformation through the friction between the yarns in two directions, the increase in prestress enhances the shear modulus. Figure 26(b) displays the variation curves of shear modulus under different shear stress amplitudes (with a prestress of 4 kN/m). It can be observed that the shear modulus decreases with increasing shear stress amplitude.

Variation curves of shear modulus. (a) Different prestress (shear stress amplitude is equal to 2.0 kN/m) and (b) Different shear stress amplitudes (prestress is equal to 4 kN/m).
The area of the hysteresis curve represents the enclosed area between stress and strain during cyclic loading, serving as an essential indicator of energy consumption in materials, as depicted in Figure 25. The variation curves of shear hysteresis loop area under different prestresses are presented in Figure 27. As the prestress increases, the shear hysteresis loop area gradually decreases, indicating a reduction in the shear energy dissipation capacity with increasing membrane surface prestress. This reduction can be attributed to the increase in shear stiffness with rising prestress, leading to decreased material deformation under the same stress.

Variation curves of shear hysteresis loop area under different prestress (shear stress amplitude is equal to 2.0 kN/m).
There are several methods available to measure the shear modulus of coated fabric, with the biaxial shear test being the most suitable because it aligns with the shear state of membrane structures. However, the shear response observed in this test is nonlinear. The coated fabric resists in-plane shear deformation through interactions between warp and weft yarns and between yarn and coating. The intricate interplay between these component materials results in the nonlinear macro shear response of the coated fabric. Moreover, when designing and analyzing membrane structures, factors such as prestress and shear stress amplitude should be carefully considered in selecting the shear modulus to ensure an accurate representation of the coated fabric’s shear resistance.
Conclusions
The uniaxial tensile, biaxial tensile, and biaxial shear tests were conducted on the coated fabric. The experimental campaign aimed to determine the uniaxial tensile elastic modulus and Poisson’s ratio of the coated fabric. Additionally, the study investigated the selection scheme of stress ratio in solving membrane engineering constants. Furthermore, it analyzed the influence of prestress value and shear stress amplitude on shear modulus. The following conclusions can be drawn:
(1) Architectural coated fabric exhibits nonlinearity under monotonic cyclic uniaxial and biaxial tensile loading. Significant irreversible strain is observed in the first few load cycles but decreases rapidly. The rate of change in global slope and the nonlinearity of the stress-strain curves, that is, the stiffness, progressively decrease. Similarly, the shear stress-shear strain hysteresis curve demonstrates significant nonlinearity. The shear stiffness of coated fabric increases with rising prestress.
(2) The orthogonal linear elastic model under the plane stress framework has high fitting accuracy for the biaxial tensile test data of coated fabric, with a maximum fitted RSS of 0.0843. Additionally, the calculation results of the elastic modulus are dependent on the selection of the stress ratio group. The warp elastic modulus decreases gradually as the number of stress ratios considered increases, while the weft elastic modulus remains unchanged after an initial significant decrease.
(3) The elastic modulus calculated based on the biaxial tensile test is smaller than that based on the uniaxial tensile test. The maximum deviations of elastic modulus in the warp and weft directions are 4.89% and 33.43% respectively. Additionally, the Poisson’s ratio calculated based on the biaxial tensile test is significantly lower than that obtained from the uniaxial tensile test. As a result, the biaxial tensile test data is recommended for design, with the selection of stress ratio based on the form of the membrane structure and the mechanical properties of the coated fabric.
(4) Moreover, the material model used in the described research is a commonly encountered material model in various guidelines and normative documents, it provides an important starting point. Future investigation should expand upon this and could, for instance, investigate the sensitivity of various material types and considering the inherent complex characteristics of coated fabric such as viscoelasticity, dependence on loading history, etc.
Footnotes
Data availability
Some or all data, models, or codes generated or used during the study are available from the corresponding author by request (for research and teaching).
Declaration of conflicting interests
The author(s) declared no potential conflicts of interest with respect to the research, authorship, and/or publication of this article.
Funding
The author(s) disclosed receipt of the following financial support for the research, authorship, and/or publication of this article: This work was supported by the National Natural Science Foundation of China (No. 52308222, 52278229), China Postdoctoral Science Foundation (No. 2023M733775), Key Laboratory of Engineering Structure Performance Evolution and Control of Ministry of Education (No. 2019KF-3).