
Abstract
In the textile industry, distinguishing between wool and cashmere can be a challenging task. Extensive research based on the microscopic images of the two has achieved very good results. However, the microscopic slide preparation process required for this approach is time-consuming and labor-intensive, limiting its practical application. To address this challenge, this paper proposes a new method that integrates artificial neural networks and hyperspectral imaging technology. The novelty of this approach lies in the fact that it does not require sample preparation, and is more simple, fast, and nondestructive. Firstly, a total of 225 wool samples and 160 cashmere samples were selected from the acquired hyperspectral images. The spectral curves (range 900–2500 nm) of these samples were extracted using the Region of Interest (ROI) tool in the ENVI software, and their characteristics were analyzed. Subsequently, due to the similarities and strong correlation between their spectral curves, Principal Component Analysis (PCA) was employed to reduce the dimensionality of the data. A single-layer neural network and a multi-layer neural network were developed using the LR (Logistic Regression) and MLP (Multilayer Perceptron) models, respectively, with a training-to-validation set ratio of 7:3. The model trained with LR achieved an accuracy of 90.3% on the training set and 81.0% on the validation set, suggesting underfitting. The MLP model performed best with five principal components, attaining a training set accuracy of 94.1% and a validation set accuracy of 92.2%. Precision, recall, and F1-score were used to evaluate the two models, and comparison of the classification performance of the two models revealed that the MLP significantly outperformed the LR model. Therefore, the application of hyperspectral imaging technology enables rapid and non-destructive identification of wool and cashmere.
Keywords
Introduction
Wool and cashmere have similar morphology, making it challenging to distinguish between them.1–3 This phenomenon creates an opportunity for unscrupulous merchants to mix wool into cashmere products for their financial gain, which undermines fair competition and harms consumer interests. For the rights of consumers, various methods have been employed to identify wool and cashmere, including cytological, 4 chemical, 5 physical,6,7 optical,8–11 and DNA 12 analysis. Each method has its own advantages and limitations. Cytological and physical methods are more accurate, but they require complex operations and depend on the expertise of personnel. Chemical methods and DNA analysis typically involve dissolving samples in chemical solvents, which can be harmful to the environment due to the production of waste liquids. Therefore, it is crucial to develop an efficient, accurate, and environmentally friendly method for identifying wool and cashmere.
In recent years, digital image processing and computer vision technologies have emerged as the main methods for identifying wool and cashmere.13–15 These advanced techniques enable the analysis of texture and morphology features, promoting automated recognition and enhancing both efficiency and accuracy. Consequently, they have gained significant attention and become the primary research focus in the field. Xing et al. 16 presented a novel digital analysis method that combines the fractal algorithm, parallel-line algorithm, and K-means clustering algorithm. Zang et al. 17 proposed a method for identifying wool and cashmere fibers by using multi-focus image fusion and convolutional neural networks. This approach was particularly effective in recognizing overlapping fibers. Lu et al. 18 introduced a new recognition method based on the Speed Up Robust Features (SURF) of fiber images. The author extracted SURF from the fiber images and employed a support vector machine for supervised learning. This method leveraged the unique characteristics of the fiber images to achieve identification. Yildiz 19 developed an objective, rapid, and cost-effective method to separate wool fibers from mohair fibers. The method employed a texture analysis-based identification approach, utilizing machine learning and deep learning techniques to achieve very high accuracy. Researches have indicated that computer vision technology holds potential for distinguishing between wool and cashmere. However, the current implementation of this technology necessitates the use of microscopic images for testing, which poses challenges in terms of reducing the overall testing time.
In contrast, infrared spectroscopy offers a more convenient and straightforward approach to distinguish wool and cashmere.1,20–23 It achieves this by comparing and analyzing their respective infrared spectral peaks. Notably, this technique also requires less testing time. Sun et al. 24 introduced a novel approach for determining the pure cashmere content, which integrates near-infrared (NIR) spectroscopy with chemometrics and other mathematical methods. This method involved subtracting the water’s spectral contribution from the original spectra and applying multiplicative scatter correction (MSC) preprocessing to enhance the predictive performance of partial least squares regression. Chen et al. 25 investigated the viability of cashmere identification using near-infrared (NIR) spectroscopy in conjunction with classification modeling and feature selection. The author employed a model-building strategy that combines principal component analysis (PCA) with the Relief algorithm.
Hyperspectral imaging technology26–29 is a specialized form of infrared spectroscopy that allows for the acquisition of richer spectral information from samples while simultaneously capturing their spatial image information. It is an efficient and non-contact detection technique. 30 Currently, in the field of wool and cashmere identification research, scholars have mainly focused on the fields of computer vision technologies and infrared spectroscopy, yielding abundant results. However, there has been limited research on utilizing hyperspectral imaging technology for the identification of wool and cashmere, indicating significant research potential in this area.
This paper aims to explore the possibility of achieving efficient identification of wool and cashmere using Artificial Neural Networks (ANN)31–33 and hyperspectral imaging technology. We captured reflectance hyperspectral images of wool and cashmere and analyzed the spectral differences between them. Next, we conducted PCA dimensionality reduction on the raw data and investigated the classification performance of both a logistic regression model and a multi-layer perceptron model. These models represent single-layer and multi-layer neural networks, respectively. Based on the results, we developed a wool and cashmere identification method using hyperspectral imaging technology. This research is of utmost importance as it contributes to the efficient identification of wool and cashmere and safeguards consumer rights.
Materials and experiment
Sample preparation
For the experiment, a total of 77 samples comprising wool and cashmere fibers were collected, encompassing yarns and fabrics. The samples used in this study were provided by the Quality Inspection Institute of Zhejiang Light Industry, located in Hangzhou, China. To further ensure the accuracy of sample categorization, the morphologies of the samples were observed by scanning electron microscopy (SEM, Vltra55, Carl Zeiss SMT Pte Ltd). Prior to testing, the samples were sputtered with gold to enhance conductivity.
Under the scanning electron microscope, wool fibers typically exhibit a rough and irregular appearance due to their complex structure. As shown in Figure 1, they have a relatively thick diameter, ranging widely from 20 to 200 μm. The surface of wool fibers is characterized by scale-like structures arranged in an overlapping manner, which gives them a rough texture. In contrast, cashmere fibers are finer and smoother, with a diameter typically ranging from 15 to 25 μm. They have fewer or smaller scales on their surface, resulting in a relatively smooth texture. Specifically, there were 45 samples of wool and 32 samples of cashmere.

Microscopic morphology of the cashmere fiber: (a) and wool fiber (b).
Acquisition and processing of hyperspectral images
Hyperspectral images of 77 wool and cashmere samples were obtained using a short-wave infrared hyperspectral imaging system (JiangSu Dualix Spectral Image Technology Co. Ltd, China). The system, as shown in Figure 2, operated on the principles of transmission grating push-broom imaging, comprises a short-wave infrared hyperspectral camera (Image-λ-N25E-HS), a high-performance InGaAs detector, a dome light source (400 W), an electrically controlled mobile platform, and Spec View data acquisition with control software. The hyperspectral imaging system covers a spectral range of 1000–2500 nm with a resolution of 10 nm, and a total of 288 spectral bands were collected in the images.

Hyperspectral imaging system.
To ensure system stability, the light source was preheated for 10–15 min before capturing the images. Afterward, the exposure time parameters of the camera were determined using a standard reflective whiteboard. The camera’s focus was then adjusted by controlling the movement of the sample stage to align the camera’s aperture with the sample. Once the exposure time, camera focus, light source intensity, and other parameters were properly calibrated, hyperspectral images were captured for each sample. This approach ensured a more comprehensive representation of the sample’s spectral characteristics.
To mitigate the impact of uneven light source intensity distribution on the data obtained by the hyperspectral imaging system, this study utilized a black-white calibration method for preprocessing. The white image was acquired by scanning a standard reflective whiteboard, while the black image was captured by covering the camera’s lens. Following the acquisition, correction was performed using equation (1).

In the equation,
The images acquired from the short-wave infrared hyperspectral imaging system consist of 288 spectral bands in the spectral dimension, covering a wavelength range of 1000–2500 nm in the spectral dimension. This means that each pixel in the hyperspectral image contains 288 feature values, which represent the spectral data of that pixel in the spatial dimension. However, the initial and final spectral bands of the hyperspectral image are subject to significant noise and do not accurately reflect the spectral characteristics of the samples. For this study, we excluded the first 10 and last 10 spectral bands, and focused our analysis on the remaining 268 spectral bands.
Spectral data analysis and classification models
In this study, we employed the ENVI software to extract spectral curves from the original hyperspectral images. Next, we conducted principal component analysis (PCA) on the data using the Python programing environment. Additionally, we implemented neural network models with single-layer and multi-layer structures to classify wool and cashmere.
PCA, 34 which stands for Principal Component Analysis, is a widely used technique for reducing the dimensionality of data. It enables the mapping of high-dimensional data to a lower-dimensional space while preserving the essential information. This, in turn, facilitates data visualization and allows for intuitive observation of data distribution, pattern recognition, and identification of cluster structures. In the context of this study, we employed PCA to map the data to a two-dimensional space and demonstrated the feasibility of identifying wool and cashmere spectral data by plotting scatter plots based on their distributions.
This study adopted the small-batch training method considering the characteristics of our dataset. Based on a 7:3 split of the training and validation sets, we used five samples as a small batch for parameter updates, which fully utilized the dataset. The training and validation ratio of 7:3 not only ensures that most samples are fully trained, but also allows enough samples to be used for validation, which is more in line with our data size.
To establish a classification discriminant model for binary classification of wool and cashmere, we employed Logistic Regression (LR)35,36 and Multilayer Perceptron(MLP) algorithms. 37 LR estimates the probability of the output variable based on the linear combination of input variables, and uses a logistic function (Sigmoid function) to transform the linear output into probability. It has only one neuron, which receives the weighted sum of input features and passes it through an activation function. In this study, it is considered as a single-layer neural network. MLP is composed of multiple layers, each containing multiple neurons. These layers include an input layer, hidden layers, and an output layer. In the MLP, each neuron receives inputs from the previous layer and applies a non-linear transformation to the weighted sum of those inputs. This transformation is accomplished using an activation function (ReLU function in this paper).
The optimal model parameters were determined based on the characteristics of the model parameters and data properties. Finally, the performance of the models were evaluated using the validation set.
Results and discussion
Spectral data analysis of hyperspectral images
Extraction of average spectral curves and spectral feature analysis
Hyperspectral imaging technology was initially applied to the field of geographic remote sensing, and hyperspectral remote sensing is the frontier of current remote sensing technology. With the continuous advancement of remote sensing technology, more and more researchers have realized that hyperspectral imaging technology can be efficiently and non-destructively applied to the detection field, including agriculture, food, and medicine, because it can simultaneously collect the image and spectral information of the sample. Therefore, the data structure of the hyperspectral images we acquire is consistent with the data structure of hyperspectral images in geographic remote sensing. ENVI is the specialized software used to process and extract geographic remote sensing image data and is effective in extracting features from fiber spectral images. The original fiber image and hyperspectral image and their spectral line in the ENVI were shown in Figure 3, using the wool sample.

Original fiber image (a), hyperspectral image (b), spectral line (c), and ROI in the image (d).
In this study, we used the regions of interest (ROI) tool in ENVI software to extract spectral information from samples, as shown in Figure 3(d). The main role of the ROI tool is image cropping, data extraction and data analysis. It can select specific areas from a large range of images as research objects, accurately extract data within areas of interest, and reduce unnecessary calculations and storage.
For each image, 10 regions of interest (ROIs) were randomly chosen to extract the average spectral curves. This resulted in a total of 385 spectral curves, with each curve representing a sample for subsequent analysis and model training. Among these samples, 225 were labeled as wool, while 160 were labeled as cashmere. Figure 4(a) shows the stacked plot of the original spectral curves. As we can see from the figure, when all the wool and cashmere spectral data were stacked together, the difference between them is very slight.

Stacked plot of the original spectral curves (a) and average spectral curve of wool and cashmere (b).
In some computer vision studies, the datasets tend to be larger because they use microscopic images of wool and cashmere for modeling, which can be readily obtained from existing databases or by capturing multiple morphological microscopic images from the same sample. However, for our research, we need to acquire hyperspectral images of entire fabric samples or yarn bundles, and obtaining such a large number of fabric or yarn samples within a short time frame is challenging for us. Our research utilizes the spectral information contained in hyperspectral images, and therefore, from a spectral perspective, we believe that our sample size serves as a meaningful basis for our study. In future research, we will collect more textile samples containing wool and cashmere, and compare the results to our current research after updating our models.
The average spectra of wool and cashmere were calculated separately, as shown in Figure 4(b). The infrared spectra of wool and cashmere are remarkably similar, with nearly similar peak positions and intensities. The slight deviations can be attributed to minor differences in their material composition and chemical structures. In this experiment, both wool and cashmere exhibit six prominent absorption peaks at 1139, 1460, 1688, and 1906 nm. The absorption peak at 1139 nm is caused by the vibration of carbon-hydrogen (C-H) bonds in fatty acids or other organic compounds present in wool and cashmere. The absorption at 1460 and 1688 nm is primarily caused by the presence of sulfur-containing amino acids in wool and cashmere. The absorption at 1906 nm is mainly attributed to the combination frequency absorption of O-H vibrations in water. The absorption peaks at 2030, 2130, and 2285 nm are mainly due to the combination frequency absorption of amide bonds and N-H vibrations in proteins, as well as the stretching and bending vibrations of methyl and methylene groups in proteins and amino compounds. Since wool and cashmere share almost identical chemical functional groups that exhibit similar absorption characteristics in the near-infrared range, their spectral shapes appear similar. Therefore, it is challenging to differentiate cashmere from wool directly based on the spectral profile.
Principal component analysis of spectral data
Principal Component Analysis (PCA)38–41 is a valuable tool for identifying the most important components in spectral curves and extracting valuable information from the data. By revealing underlying patterns and structures, it aids in determining the key wavelengths or spectral regions that contribute the most to the overall variance. This, in turn, enhances the separability of wool and cashmere spectra. Furthermore, PCA plays a crucial role in reducing the dimensionality of the data, allowing for easier visual analysis and mitigating the challenges posed by the “curse of dimensionality” phenomenon encountered in classification algorithms.
After extracting the average spectral curves, a PCA transformation was applied, as shown in Figure 5. The cumulative explained variance ratio of the first two principal components accounted for 97.7% of the variance, while the cumulative explained variance ratio of the first six principal components reached 99.6%. These principal components effectively capture the majority of the information contained in the original spectral data. As the number of principal components exceeds 6, the cumulative explained variance ratio stabilizes. Consequently, for dimensionality reduction in this study, two to six principal components were retained and used as input data for subsequent identification models.

Cumulative explained variance ratio of the first 10 principal components.
In order to better understand the spectral differences between wool and cashmere, Figure 6 depicts the scatter plot of the first two principal components resulting from PCA. The spectral information of wool and cashmere was transformed into new variables and distributed in a two-dimensional space. Upon visual inspection, it is apparent that wool and cashmere exhibit clustering and partial separability in this space. However, due to their similar spectral characteristics, many sample points overlap, resulting in significant cross-distribution and posing challenges for effective differentiation between the two categories. As PCA is an unsupervised dimensionality reduction technique, it does not effectively utilize classification information. Therefore, a supervised data modeling approach is required to learn and fit the spectral classification data, enabling accurate identification of categories.

Scatter plot of the first two principal components.
Qualitative spectral identification model for wool and cashmere
Logistic regression model
Logistic Regression (LR)42–45 is a widely employed classification algorithm specifically designed for binary classification tasks, as shown in Figure 7. In this particular model, the input variables consist of the features extracted from the spectral curves, while the target variable corresponds to the labels denoting wool and cashmere. The LR model produces an output in the form of a probability value, indicating the likelihood of a sample belonging to either wool or cashmere.

Structure of the logistic regression model.
Where, X1, X2, . . . Xn represent the data of each training set spectral curve after PCA processing. σ(z) represents the sigmoid function, and y_pre is the final output result. It represents the probability of belonging to wool and cashmere. The formula of the sigmoid function is as equation (2).

The data input into the classifier each time was a feature of each cashmere or wool fiber. In this study, we employed the PCA algorithm to reduce the dimensionality of the original data to two to six dimensions. Using a sample of wool as an example, the data passed into the model is shown in Table 1. The reduced data were then utilized as input for a LR model. The Logistic Regression model consists of several components: Input layer, Linear combination, Activation function, Output layer, Loss function and Optimization algorithm. The Input layer receives the input features, which are the training samples after PCA dimensionality reduction. The Linear combination performs a weighted sum of the input features, assigning each feature a corresponding weight. The Activation function, which in this study is specifically the sigmoid function, is applied to the result of the linear combination. This non-linear mapping function transforms the output into a probability value ranging from 0 to 1. The Output layer produces the probability values for classification. The chosen Loss function is the cross-entropy loss, which quantifies the discrepancy between probability distributions. Finally, the Optimization algorithm adjusts the weights and biases of the model to minimize the loss function. In this study, we utilized the Adam optimizer. During the training process of the model, the optimization algorithm was utilized to search for the optimal linear combination that minimizes the loss function.
The reduced data after PCA.
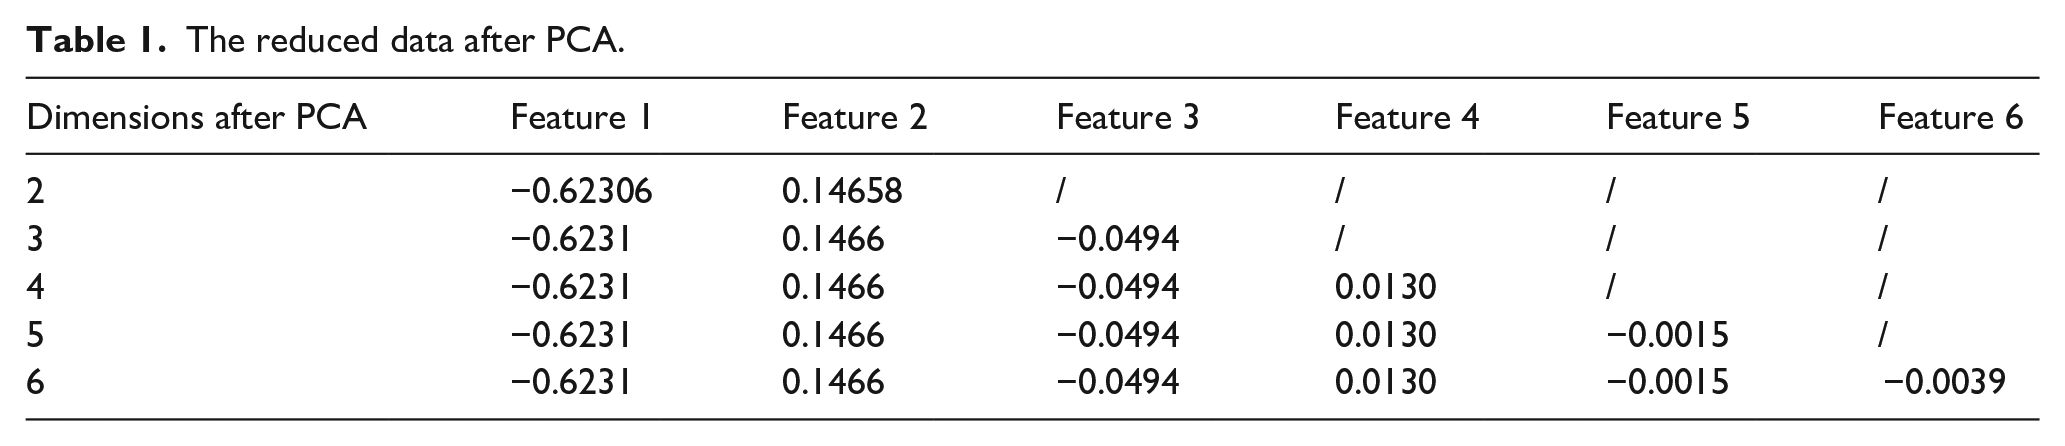
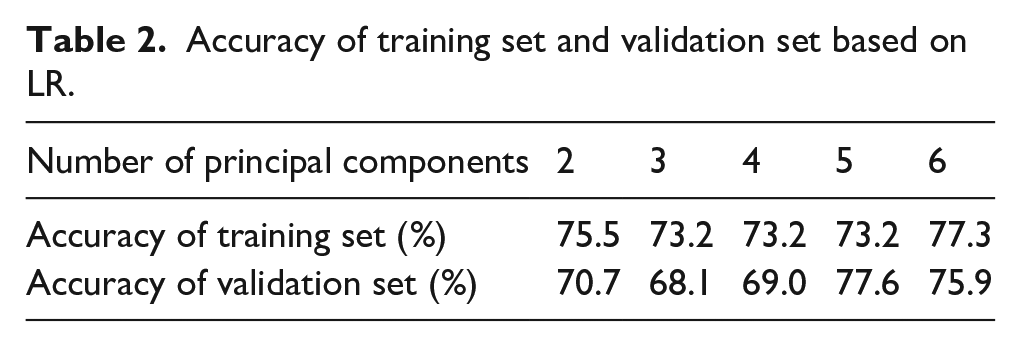
The training and validation sets were divided in a 7:3 ratio, and the classification model was constructed using spectral data of dimensions two to six as input features. The model parameters were optimized to obtain the final model. Table 2 shows the accuracy of training set and validation set after the model training. Retaining six principal components results in a relatively high accuracy. Nevertheless, the accuracy on the training set is only 77.3%, while on the validation set, it is 75.9%. Specifically, when retaining five principal components, the model’s accuracy decreases to 73.2% on the training set. However, it shows an increase to 77.6% on the validation set, surpassing the accuracy achieved on the training set. The phenomenon of the validation set achieving higher accuracy than the test set indicates that, despite parameter optimization, the model fails to effectively predict the true outcomes of unknown data, revealing its insufficient fitting capability. The primary reason for this subpar performance is attributed to the limitation of the Logistic Regression model used in this study, which solely performs linear computations on the input features. Previous research has demonstrated that wool and cashmere spectral data exhibit high similarity and strong linear correlation. Despite applying PCA, there remains a significant overlap of samples. Consequently, this limitation in performing linear calculations hampers the model’s capacity to accurately fit the data. To summarize, the model does not exhibit overfitting; however, its fitting performance remains unsatisfactory.
Accuracy of training set and validation set based on LR.
In order to delve deeper into the role of Logistic Regression models in discriminating between wool and cashmere, further research is necessary. We continued to conduct PCA on the data to explore higher dimensions. After optimizing the model, we observe that increasing the dimensionality led to improved accuracy. At a dimensionality of 25, the cumulative explained variance ratio is calculated to be 99.9%. Here, the model’s accuracy on the training set is 88.5%, which drops to 80.2% on the validation set. This phenomenon indicates that the model is overfitting, as its performance on the validation set is significantly lower than that on the training set. It can be inferred that the improvement in the model’s performance at this point is not due to the increase in dimensionality. Previous research has shown that at a dimensionality of 6, the cumulative contribution rate reaches 99.6% and then stabilizes. The marginal increase of only 0.3% in the cumulative explained variance ratio from dimensionality 6 to 25 cannot account for a substantial change in the model’s performance.
Upon examining the performance on both the training and validation sets, a notable discrepancy in accuracy is observed, indicating the presence of overfitting. Moreover, as the dimensionality increases, this discrepancy widens even further. Figure 8 shows the accuracy of training set and validation set in higher dimensionality. At the dimensionality of 40, the model achieved an accuracy of 90.3% on the training set and 81.0% on the validation set, achieving the highest. As the dimensionality increases, starting from 15 principal components, the model’s accuracy on the training set also increases. It can be observed that when the dimensionality reaches 45, the model after optimized achieves 89.6% accuracy on the training set, while the discrepancy with the validation set expands to 13.7%. This discrepancy is considerably higher than the 8.3% observed at dimensionality 25. This study reveals that although increasing the dimensionality enhances the model’s accuracy, it primarily stems from the model overfitting to the training set. Consequently, this leads to significantly poorer performance on the validation set.
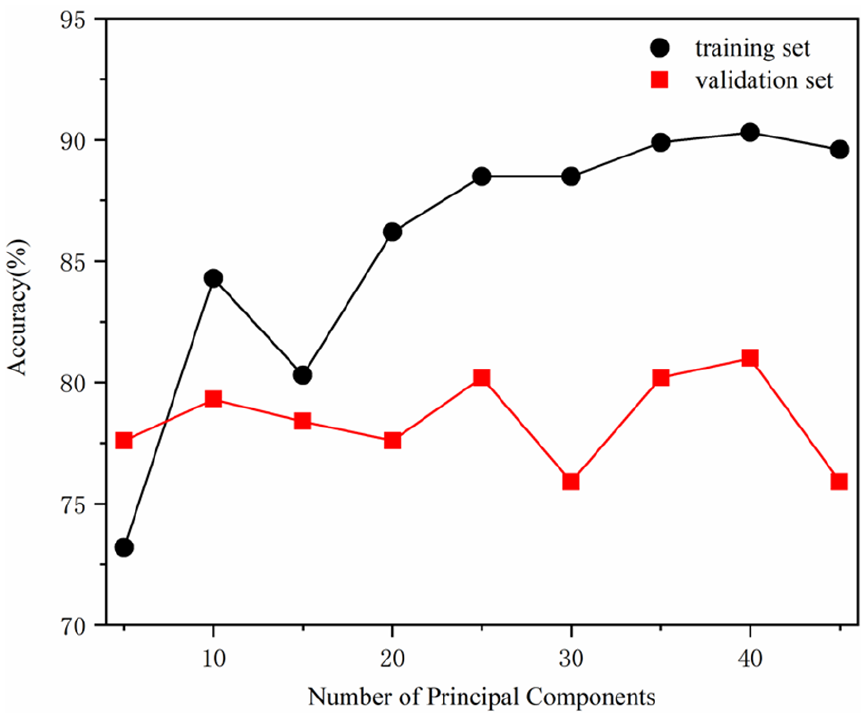
Accuracy of the LR model in higher dimensionality.
In summary, the LR model demonstrates underfitting when the number of principal components is low, and overfitting when the number of principal components is high. As a result, the classification model constructed with LR is not capable of effectively distinguishing between wool and cashmere.
Multilayer perceptron model
The Multilayer Perceptron (MLP)46–49 is a commonly used artificial neural network model for solving classification and regression problems. The MLP is known for its strong capability in handling nonlinear problems. In this paper, the training process of a model begins with the preparation of the training dataset and its corresponding labels. Once the dataset is ready, the next step involves determining the structure of the MLP, which includes specifying the number of neurons in the input layer, hidden layers, and output layer. The structure of the MLP in this paper is shown in Figure 9, to initiate the model, random initial values are assigned to the weights of each connection and the biases of each neuron. Subsequently, the input data is propagated through the network to perform forward propagation, thereby computing the output of each neuron. This is achieved by applying a weighted sum to the inputs and their corresponding weights, followed by the activation function. The backpropagation algorithm is then utilized to compute the gradients of the weights and biases with respect to the loss function, which has been previously defined. These gradients are employed to minimize the loss function and update the weights and biases of the model using the Adam optimization algorithm.

Structure of the multilayer perceptron model.
In this paper, we selected the ReLU function as the activation function for the input and hidden layers, and the sigmoid function as the activation function for the output layer. The ReLU function enables non-linear output of features after linear transformations in the input layer, which distinguishes Multilayer Perceptron model from Logistic Regression model. This distinction is particularly advantageous in addressing the classification problem of wool and cashmere in this study. The formula of the sigmoid function is as equation (3).

Where, x represent the data of each training set spectral curve after PCA processing. If x is positive, ReLU(x) = x. If x is negative, ReLU(x) = 0.
The input of both these models is the spectral data after PCA, and the output is the probability of belonging to wool and cashmere. In this paper, if the probability exceeds or equals 0.5, the sample is classified as cashmere; otherwise, it is classified as wool.
In the construction of the model for this study, we explored a range of options for the number of hidden layers, setting it between 1 and 5, and we also considered different numbers of neurons in each layer, ranging from 1 to 10. To optimize the model parameters, we utilized spectral data with two to six principal components as the input layer. The accuracy of training set obtained from the five models are presented in Figure 10. Notably, the best model performance was achieved when the number of principal components is set to 5. This model exhibits an accuracy of 94.1% on the training set and 92.2% on the validation set, demonstrating robust performance without overfitting. It is evident that the combination of MLP model and PCA achieves good performance in discriminating between wool and cashmere.

Accuracy of training set based on MLP.
Model comparison
After comparing the performance of two models for discriminating between wool and cashmere, we observed that the MLP model surpasses the logistic regression model in terms of accuracy and generalization. Figure 11 shows the accuracy of training set, validation set, and overall set of the LR model and MLP model when they perform at their best after parameter optimization. Among all the models, the MLP model with five principal components perform best, achieving an accuracy rates of 94.1% and 92.2% on the training set and validation set. Due to the high correlation present in the hyperspectral data of wool and cashmere, even after applying dimensionality reduction, the Logistic Regression model shows poor performance. In contrast, the MLP model, using the ReLU function with its nonlinear characteristics, effectively captures and amplifies the spectral features of wool and cashmere. As a result, when confront with the binary classification problem of distinguishing between wool and cashmere based on hyperspectral data, the MLP model outperforms LR model.
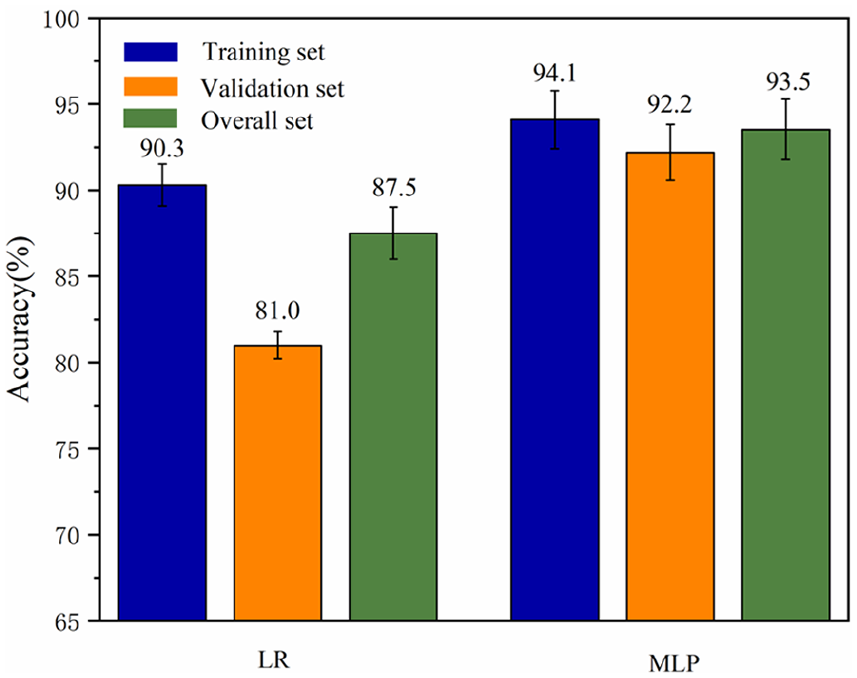
Accuracy of training set, validation set, and overall set.
Due to the imbalance in the number of various samples, using only the accuracy metric has limitations. Therefore, this paper selected the precision (P), recall (R), and F1-score to evaluate the classification performance of the discrimination model on the validation set.
Precision is a measure of the predicted results, indicating the ability of the final predicted values obtained after processing the original dataset to reflect the actual situation. Recall shows the proportion of positive samples that are correctly predicted, with the target being the original positive samples. The F1-score has a measuring role in the classification model, which is the harmonic mean of precision and recall, with a range of 0–1. The formulas for calculating precision, recall, and F1-score are as equations (4)–(6).


Where: TP are the cashmere samples that the model predicted as cashmere; FP are the wool samples that the model predicted as cashmere; FN are the cashmere samples that the model predicted as wool.
The precision, recall, and F1-score of the LR and MLP models are calculated separately, as shown in Table 3.
The precision, recall, and F1-score of the two model on the validation set.
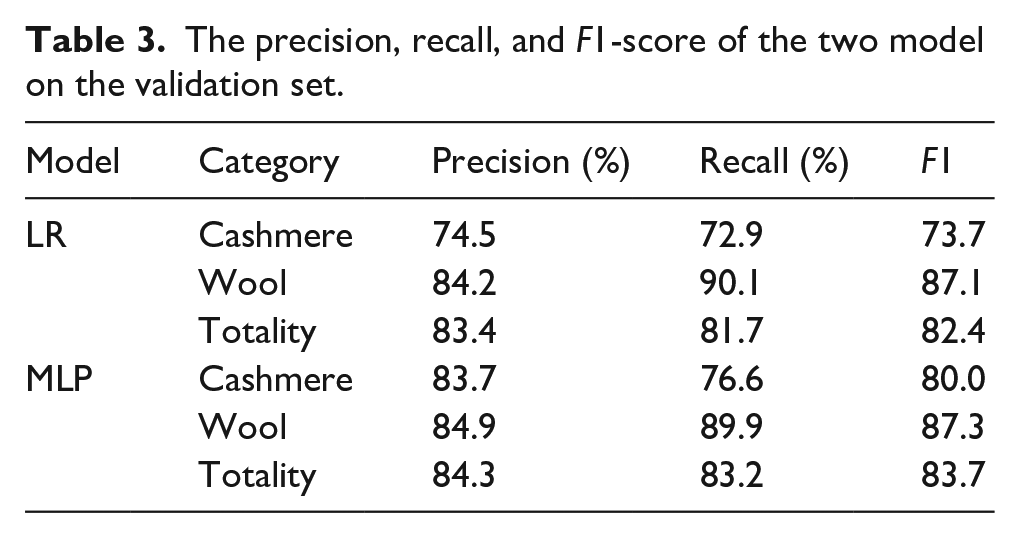
Based on the established LR model and MLP model, it can be seen that the various indicators of the MLP model are all higher than the LR model, especially the precision, recall, and F1-score of the cashmere samples. This indicates that the MLP model is more capable of identifying cashmere samples. While the overall precision, recall, and F1-score of the MLP model reached 84.3%, 83.2%, and 83.7% respectively. This indicated that the model established in this study has an overall good performance.
Conclusions
The paper presents a preliminary study on the feasibility of using ANN and hyperspectral techniques to differentiate between wool and cashmere fibers. The study focuses on discussing the impact of single-layer and multi-layer neural network structures on the classification performance. The spectral curves of wool and cashmere in the ROI were analyzed, revealing a high degree of similarity in peak positions and absorption intensities. Principal Component Analysis (PCA) was utilized to effectively reduce the dimensionality of the spectra, enabling data visualization in a lower-dimensional space. The two-dimensional visualization results exhibited distinct clustering patterns for wool and cashmere, although there was some overlap indicating a significant correlation in their spectral characteristics. Subsequently, logistic regression (LR) and multi-layer perceptron (MLP) models were constructed to build artificial neural networks with single-layer and multi-layer structures, respectively. The models utilized data of different dimensions as inputs to obtain a discriminative model. The study revealed that the LR model was unsuitable for effectively classifying the hyperspectral data of wool and cashmere. It exhibited insufficient fitting capability at low PCA dimensions and significant overfitting issues at high PCA dimensions. On the other hand, the MLP model demonstrated superior performance with classification accuracies of 94.1% and 92.2% on the training and validation sets, respectively. Meanwhile, the comparison of the precision, recall, and F1-score indicators between the two models also indicates that MLP can better discriminate cashmere samples compared to LR. The combination of hyperspectral imaging technology and the MLP model enables swift and efficient classification of wool and cashmere, significantly reducing the detection process. As deep learning techniques continue to rapidly evolve, we plan to investigate more advanced neural network algorithms, such as Convolutional Neural Networks (GNN), Recurrent Neural Networks (RNN), and Generative Adversarial Networks (GAN), and attempt to implement them as part of the future work and continuation of this project. This will further enhance the accuracy and capabilities of the identification system.
Footnotes
Author contributions
Yingjie Qiu and Xiaoke Jin designed the experiments; Yingjie Qiu, Xu Huang Feng and Huifang Zhang conducted the experiments; Yingjie Qiu, Lingda Shao and Wei Tian analyzed the data; Yingjie Qiu wrote the paper. All authors discussed the results and contributed to the improvement of the final text of the paper. All authors have read and agreed to the published version of the manuscript.
Data availability statement
Not applicable.
Declaration of conflicting interests
The author(s) declared no potential conflicts of interest with respect to the research, authorship, and/or publication of this article.
Funding
The author(s) disclosed receipt of the following financial support for the research, authorship, and/or publication of this article: This research was funded by the Basic Public Welfare Research Program of Zhejiang Province (LGC22E030001), the Eyas Program Incubation Project of Zhejiang Provincial Administration for Market Regulation (CY2022224), the General Scientific Research Project of Department of Education of Zhejiang Province (Y202250774), and the Eyas Program Incubation Project of Zhejiang Provincial Administration for Market Regulation (CY2023324).