
Abstract
Intrinsic viscosity is a critical evaluation indicator for polymer quality during the aggregation process. Accurate prediction of intrinsic viscosity is essential for the online monitoring and control of polymer quality. The aggregation process is a typical industrial production mode influenced by production continuity and varying sensor spatial locations. The data from this production process exhibits characteristics such as parameter redundancy, long time sequences, and time delays. Existing methods struggle to accurately match data features, resulting in poor prediction accuracy. To address these issues, we propose a three-stage method for predicting polymer intrinsic viscosity. Firstly, we introduce a key feature extraction method based on the maximum information coefficient and an approximate Markov blanket model to address the redundancy in aggregation process data parameters. Secondly, we propose a time delay analysis method based on cross-correlation to estimate time delay relationships and match time delay features in the aggregation process. Finally, we develop an improved information prediction model for long-term sequence prediction, utilizing locally sensitive hash attention to replace ProbSparse self-attention. This ensures the prediction effect remains effective as the sequence length increases. The results demonstrate that our proposed method reduces feature redundancy, calculates delay times similar to simulation results, and offers significant advantages in prediction accuracy compared to other time series prediction models under different sequence lengths.
Introduction
The polymerization process of polyester fibers is the initial step in their production, where the synthesized polymer is directly processed to form the fibers. Intrinsic viscosity is a crucial quality indicator of polymers, 1 reflecting their fluidity. Significant fluctuations in intrinsic viscosity can lead to fiber breakage during spinning and winding processes, causing material waste and severely affecting the quality of polyester fiber products while reducing production efficiency. Methods for determining the intrinsic viscosity of polymers are categorized into direct and indirect methods. The direct measurement method involves sampling the polymer and sending it to the laboratory for analysis. 2 This method cannot be measured online and has a time delay. 3 In actual production, factories typically use indirect measurement methods to infer the intrinsic viscosity of polymers by detecting the outlet pressure of polymer delivery pumps. This approach only provides a range of intrinsic viscosity values and cannot accurately detect specific values. Currently, these methods cannot preemptively address the issue of polymer intrinsic viscosity fluctuations, highlighting the urgent need for a reliable polymer intrinsic viscosity prediction method.
The process flow diagram of the aggregation process, shown in Figure 1, includes stages such as terephthalic acid (TPA) feed and slurry ratio, esterification reaction, oligomer transport and additive injection, pre-condensation reaction, final polycondensation reaction, and other processes. 4 During the polymerization process, a significant amount of sensor data is collected, but only certain process parameters affect the intrinsic viscosity of the polymer, necessitating feature extraction. 5 Unlike other production industries, the polymerization process requires a specific residence time for the fluid to move through the pipeline. Adjusting process parameters does not immediately trigger chemical reactions; the fluid still requires a certain residence time to react upon entering the reactor, leading to a characteristic time delay in the aggregation process. The intrinsic viscosity of polymers produced during the polymerization process is not constant. To maintain long-term stability of polymer intrinsic viscosity, it is essential to achieve long-term prediction of this property. The polymerization process is typical of industrial production with a long production cycle and complex process flow. The production operation data exhibits long sequence and time series characteristics, with numerous parameters affecting intrinsic viscosity, often with coupling relationships between them. These characteristics present significant challenges for predicting intrinsic viscosity.

Aggregation process flowchart.
There are two main methods for predicting the intrinsic viscosity of polymers: mechanistic modeling and data-driven modeling.6–9 Mechanistic modeling involves analyzing physical and chemical reactions, such as reaction kinetics, energy conservation laws, and mass conservation equations in actual processes,10–12 to construct a series of differential and algebraic equations that form a mechanistic model. The reliability and interpretability of mechanistic modeling are high, as it directly reflects the inherent relationships between process variables. However, due to the complexity of processes in the chemical industry, it is difficult to obtain accurate mechanistic equations. In existing mechanistic modeling, complex factors such as strong nonlinearity, multivariable coupling, and transient response are often simplified.13,14 Simplified models struggle to accurately reflect the true state of complex processes. Additionally, even when mechanistic models are constructed using complex differential and algebraic equations, the challenging solving process, slow convergence speed, and low generalization significantly limit their application and promotion.15–19 To address the limitations of mechanistic modeling in capturing complex features such as multivariable coupling, nonlinearity, and dynamics, some studies20,21 have analyzed and extracted data characteristics in process industries to improve the performance of quality prediction. For example, Yuan et al. 22 proposed a time-aware dynamic imputation and interval auxiliary network with an attention mechanism to address the heterogeneous nature of time information modeling in data sequences and the issue of missing values. Data-driven modeling does not require the analysis of complex physicochemical reactions during the aggregation process. Instead, only process parameters closely related to key quality indicators need to be selected as inputs to the model. 23 By analyzing the characteristics of the data itself, commonly used modeling methods are selected to establish a mapping based on the relationship between process variables and quality indicators. Finally, the established model is regularly trained and calibrated based on newly obtained data. Data-driven modeling can fit the relationship between process variables and quality indicators in various complex environments. Therefore, data-driven modeling methods are more suitable for predicting the intrinsic viscosity of polymers.
Although the aforementioned data-driven modeling methods effectively address complex factors such as strong coupling and dynamics in process industry data, modeling time delay and long-term prediction of intrinsic viscosity in polymerization processes remain significant challenges. Therefore, we propose a three-stage prediction model for polymer intrinsic viscosity using long sequence time series data. The main contributions of this paper can be summarized as follows:
(1) To address feature redundancy, we propose a feature extraction method based on the maximum information coefficient (MIC) and approximate Markov blanket, which effectively filters features.
(2) To handle time delay characteristics, a time delay analysis method was designed to address the delay time between various process parameters and between process parameters and polymer intrinsic viscosity during the polymerization process, achieving data feature matching.
(3) To manage long sequence time series characteristics, we innovatively employ position-sensitive hash attention in the Informer model to replace ProbSparse self-attention for predicting polymer intrinsic viscosity, thereby achieving long-term prediction of intrinsic viscosity.
The remainder of the paper is organized as follows. Section “Related work” reviews related work on time delay and long sequence time series prediction. Section “Proposed method” proposes a three-stage model for predicting polymer intrinsic viscosity using long sequence time series data. Section “Experiments” presents practical case studies and verifies the superiority of the proposed method. Section “Conclusion” discusses the research conclusions and future work.
Related work
This article focuses on predicting polymer intrinsic viscosity, considering the characteristics of time lag and long sequence time series. It proposes a time lag estimation method and a polymer intrinsic viscosity prediction method. The following sections introduce the existing related work in two areas: time delay analysis and time series prediction.
Time delay is a common issue in many fields. Existing methods primarily estimate the impact relationship of time delay based on correlation and mutual information, among other techniques. Many scholars have conducted in-depth research on this topic. Bai and Zhao 24 proposed a transformer-based multivariable and multi-step prediction method for detecting delays in certain chemical faults. The transformer predicts changes in the next process variable, using iterative prediction for multi-step changes in the process variable. Li et al. 25 proposed a new method for extracting dynamic time delay and reconstructing multivariate data to address dynamic time delay, improving the Attention-LSTM prediction model. This method adaptively adjusts the time position and span of multivariate data based on dynamic time delay to suit input/output pairing in Attention-LSTM networks. Yao 26 proposed a data-driven industrial quality predictor with variable time delay estimation to resolve the time delay between process variables and quality variables. Zhang et al. 27 used Time Delay High Correlation Analysis to calculate the time delay correlation coefficient between each pair of stations, thereby quantifying the potential time delay effect of pollutant concentration time series between each pair of stations at different time scales. The above time delay analysis methods, due to their engineering problem characteristics, can only analyze the time delay relationship between process variables and variables or between process variables and target variables, but cannot balance both. Therefore, we propose a time delay analysis method based on cross-correlation to address these shortcomings.
For the increasing demand for sequence length, the main challenge in long sequence time series prediction is to improve predictive ability, a topic extensively studied by many scholars. The Transformer model, proposed by Vaswani et al. 28 in 2017, uses an attention mechanism as the backbone structure, enabling parallel processing and temporal feature extraction for long sequence time series data input. Child et al. 29 introduced the Sparse Transformer, which incorporates self-attention through decomposition and trains hundreds of layers of dense attention networks via sparse matrix decomposition, theoretically solving the problem of predicting ultra-long sequences. Mo et al. 30 combined individual gate convolutional units with local context information at each time step and utilized the Transformer network encoder layer as the main prediction network, achieving good results in temporal data prediction. Despite the success of these Transformer-based models in predicting long sequence time series, their high computational complexity and low efficiency make them unsuitable for long process industrial scenarios. The following works provide better approaches for predicting the intrinsic viscosity of long sequence time series polymers. Wu et al. 31 designed a new decomposition architecture with an autocorrelation mechanism called the autotransformer, which can gradually decompose complex long sequence time series. Experiments show that this method outperforms the Transformer in long sequence time series prediction. Kitaev et al. 32 replaced the dot product attention in the Transformer with locally sensitive hash attention, achieving a sequence length of 64k, significantly longer than the common 512. However, the output prediction results are sequential, with subsequent outputs relying on previous time steps, leading to slow inference. Zhou et al. 33 proposed the Informer model for long sequence time series prediction of power transformer temperature, using a parallel generative decoder mechanism to output all prediction results for long sequence time series at once. However, this method has limitations on the length of the prediction sequence. Considering the advantages and disadvantages of the aforementioned methods, we propose a locally sensitive hash attention-Informer model based on time delay analysis (TDA-LSHA-Informer) for predicting intrinsic viscosity. This method balances time complexity, prediction sequence length, and prediction speed.
Proposed method
The polymerization process in the chemical industry exhibits three key characteristics: (1) Redundancy in characteristic quantities: to ensure production safety, numerous sensors are installed on the production line, but only the parameters from certain sensors affect the intrinsic viscosity of the polymer. (2) Time delay: adjusting process parameters in the polymerization process requires a period before a chemical reaction occurs in the subsequent process. (3) Long sequence time series prediction: the intrinsic viscosity of polymers fluctuates during production rather than remaining constant. Ensuring the long-term stability of polymer intrinsic viscosity necessitates predicting its value over a future period. Considering these characteristics, we propose a three-stage polymer intrinsic viscosity prediction model, as illustrated in Figure 2. First, the paper introduces a correlation analysis method based on feature sorting using the MIC as the metric and a redundancy analysis method based on approximate Markov blankets. Finally, the TDA-LSHA-Informer model is employed to predict the intrinsic viscosity of polymers.

Schematic diagram of three-stage polymer intrinsic viscosity prediction method.
Feature selection method
To ensure the production safety of the polymerization process, numerous sensors are placed on the production line. Most of the data from these sensors are independent of the quality of polymer products. Inputting all this irrelevant redundant data into the model would negatively affect its prediction accuracy. Therefore, it is essential to perform feature filtering on the data in advance.
The MIC measures the mutual information between features, capturing both linear and nonlinear relationships, as well as non-functional relationships between two variables. The approximate Markov blanket method is an efficient approximation of the Markov blanket, significantly enhancing the speed of feature selection and search strategies while maintaining effectiveness. We propose a correlation analysis method based on feature sorting and a redundancy analysis method based on approximate Markov blankets, using the MIC as the measurement standard, and selecting features for the polyester fiber polymerization process based on the criteria of maximum correlation and minimum redundancy.
The feature correlation calculation method based on the MIC primarily involves mutual information and grid partitioning. The formula for calculating the MIC is as follows:
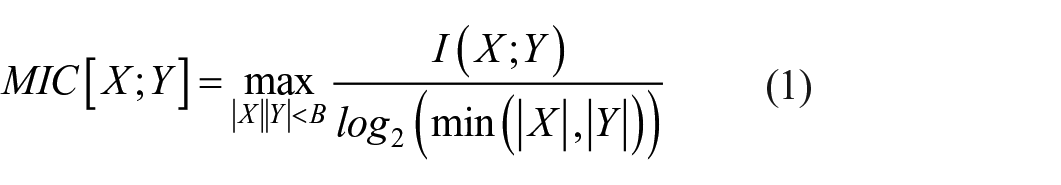
In the equation, I(X; Y) represents the mutual information values of variables X = {
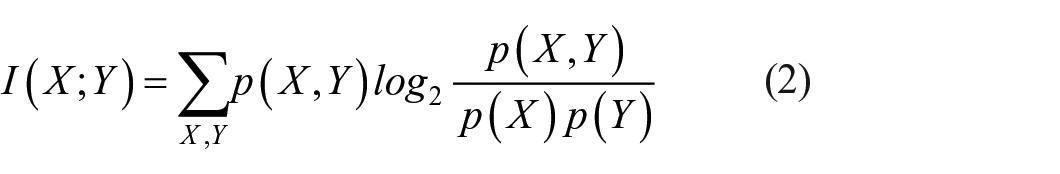
In the equation, p(X, Y) represents the joint probability density of variables X and Y, and p(X) and p(Y) represent the edge probability density of variables X and Y.
In response to the redundancy characteristics of the polyester fiber polymerization process dataset, we use the approximate Markov blanket method to remove redundant features from the feature set. The conditions for the approximate Markov blanket of j are as follows:
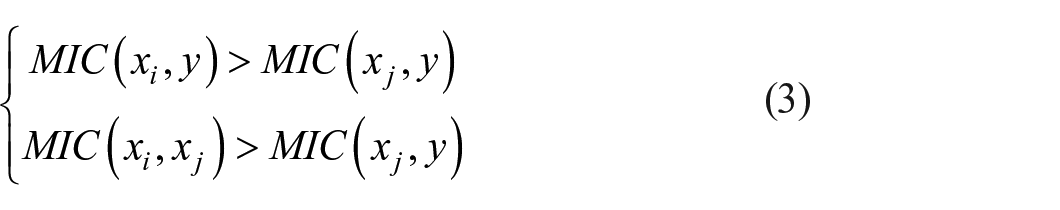
In the equation, MIC(
Time delay analysis method
The time taken by a fluid to traverse a continuously flowing pipeline and container is called residence time. Due to factors such as residence time and fluid velocity, data measured at the same time point often reflect different logistics or media states, adversely affecting further analysis and processing. When adjusting parameters such as temperature and pressure, immediate adjustments to the expected values are not possible, requiring a certain waiting period. For instance, if the target temperature is 300°C and the current temperature is 200°C, it will take some time to reach the specified temperature. Additionally, since the polymerization process involves chemical reactions, sufficient reaction time must be allowed for the material. Consequently, after adjusting the process parameters, a waiting period is necessary before the characteristic viscosity changes. This issue must be considered in data modeling. It is essential to calculate the delay time between each parameter, align them, and input them into the prediction model.
Therefore, we propose a method for estimating time delay to measure the delay between various process parameters and intrinsic viscosity. It is important to note that the time delay considered in this study is caused by process dwell time, which differs from delays caused by measurement components, measurement processes, control components, or execution components in control systems.
Assuming there are m types of sensor data X = [

where | | represents the absolute value symbol

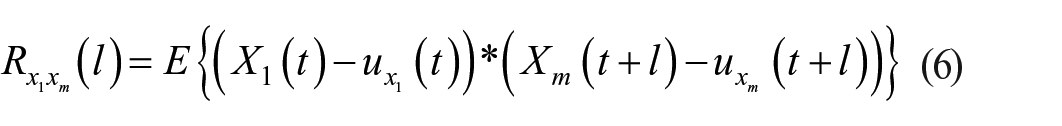


where
Long sequence time-series predicting method
The current mainstream approach to predicting the intrinsic viscosity of polymers involves using time series prediction with extensive production history data. However, most existing methods focus on short-term sequence prediction. To ensure the stability of polymer intrinsic viscosity, it is necessary to predict long-term intrinsic viscosity values.
Therefore, we propose a long sequence series prediction method based on the Informer framework, as shown in Figure 3. The model consists of an encoder and a decoder, incorporating Multi-head Self-Attention, Self-Attention Distilling, and Locality Sensitive Hashing Attention.

TDA-LSHA-informer model structure.
Positional encoding
Assuming the input of the t-th sequence is


where
Each type of global timestamp is assigned a learnable timestamp embedding

where
Multi-head self-attention
Multi Head Attention is composed of multiple Scaled Dot-Product Attention. Scaled Dot Product Attention can be described as mapping a query and a set of key value pairs to an output, where the query, key, value, and output are all vectors. The input consists of queries and keys of dimension
In practice, we compute the attention function on a set of queries simultaneously, packed together into a matrix Q. The keys and values are also packed together into matrices K and V. We compute the matrix of outputs as:

Locality sensitive hashing Attention
For Locality sensitive hashing Attention, we refer to the structure of the multi head attention mechanism and focus on the calculation of formula 12. Assuming that the shape [batch_size, length,
We employ a random projection method to address this problem. When adjacent vectors have a high probability of obtaining the same hash while distant vectors do not, the hashing scheme that assigns each vector x to hash h (x) is termed local sensitivity. Our goal is for nearby vectors to obtain the same hash with a high probability, ensuring that hash buckets have a similar high probability. As shown in Figure 4, angle-sensitive hashing uses the random rotation of spherical projection points to establish buckets on the signed axis projection using argmax. In the upper half of the figure, the spherical projection distance between points x and y is relatively large, and they will not share the same hash bucket at three angles unless the spherical projection distance is close.

Sphere projected point with random rotation.
Assume that the size of Random matrix R is [


In order to achieve batch processing, we usually focus on larger sets P


For Locality Sensitive Hashing (LSH) attention, we can consider limiting the set Pi of target items that query location i can focus on by allowing attention only within a single hash bucket.

Figure 5(1) and (2) on the right side illustrate a brief comparison between complete attention and hash variants. In (1), the attention matrix used for complete attention is typically sparse, but this sparsity is not considered during computation. In (2), the sorting order of queries and keys is determined by the hash bucket. Because similar items are likely to fall into the same bucket, we can approximate the full attention pattern by allowing only attention within each bucket.

Schematic comparison of full-attention with a hashed variant.
There are two problems with directly splitting hash buckets: the size of hash buckets in this formula is often uneven, which makes batch processing across buckets difficult. In addition, the number of queries and keys in a bucket may not be equal. In fact, a bucket may contain many queries but no keys. To solve these problems, our solution is to set

If
Self-attention distilling
According to the LSH Attention process, redundancy is inevitably generated in the Attention results. The Informer network addresses this by shortening the original sequence length through a self-attention distillation operation, which highlights the main attention and extracts dominant features using maximum pooling. Traditional distillation structures do not incorporate a self-attention mechanism, so they simply shorten the sequence length through distillation operations, potentially leading to the loss of important information. The attention distillation structure used in this paper includes an attention mechanism, enabling the network to focus on important information in the sequence while shortening the original sequence length. After the self-attention distillation operation, a more focused self-attention feature map is generated within a smaller range. The self-attention distillation operation from layer f to layer f + 1 is calculated as:

In the formula,
Generative style decoding
The decoder consists of a Masked LSH Attention layer and a Multi-Head Self-Attention layer. The LSH Attention needs to be masked to avoid leftward information flow and prevent autoregression. Additionally, a fully connected layer is required, with its output dimensions depending on the dimensions of the variables to be predicted. We adopt a generative inference process to improve the speed of inference. Specifically, the input to the decoder is:

where
Experiments
In this section, we conducted three experiments to verify the performance of the proposed method. First, we preprocessed the data. Then, we conducted feature selection experiments. Subsequently, we performed time delay experiments on certain polymerization processes. Finally, we compared the polymer intrinsic viscosity prediction method proposed in this paper with other methods. The experimental data in this study are sourced from a polyester fiber factory, collected between March and September 2019. The dataset includes 1950 sensor readings from polyester fiber polymerization processes, encompassing parameters such as slurry density, pre-condensation pressure difference, and pre-condensation output temperature. The specific details are shown in Table 1. These parameters were selected based on process knowledge and engineering experience. For clarity, the necessary abbreviations and symbols in the table are explained as follows: EG – ethylene glycol, TPA – terephthalic acid, HW – heat exchanger plate, TiO2 – titanium dioxide, DEG – diethylene glycol, UFPP – pre-shrinkage polymerization, FIN – final shrinkage polymerization.
Process parameters.

Data preprocessing
Unlike traditional commercial data, production data in process industries often contain inevitable measurement errors. Additionally, this data exhibits strong temporal characteristics, high inter-variable coupling, and temporal fluctuations. These characteristics can adversely affect the accuracy of time delay calculations. Therefore, it is crucial to preprocess the data before conducting time delay analysis.
First, significant errors in the data need to be eliminated. Significant errors, also known as gross errors, are primarily caused by factors such as process leaks, instrument failures, unstable operations, and the psychological and physiological limitations of the measurement personnel. We adopt the following two steps to eliminate significant errors from the sample data.
(1) According to process requirements and operating experience, the operating range of the original data variables is determined by analyzing the sampling data. Then, the maximum and minimum limiting method is applied to eliminate data that fall outside this range (predefined threshold).
(2) The Leda criterion is used to detect and eliminate data with significant errors. The mathematical method is as follows:

if the deviation
Since time-delay calculation requires continuously spaced sample data, and the data involved is often discontinuous due to omitted sampling times and error elimination, it is necessary to interpolate and fill the missing data before performing time-delay calculations. In this paper, a simple mean value method is adopted, where the average value of the sample data is used to fill in the gaps. This method is straightforward and easy to implement.
Feature selection experiment
We obtained approximately 540,000 data samples from the sensor at a sampling interval of 30 s. Out of these, 432,000 samples were selected to form the training dataset, with the mean intrinsic viscosity as the output variable. The remaining samples were used to create the test dataset. When the adjustment step size is 0.1, the optimal learning rate is 0.002. Because there is a conflict between the training batch size and convergence, that is to say, if a sufficiently large batch of data is selected for training each time, the convergence of the model will be poor. Finally, the learning rate was set to 0.002, the batch size to 64, the number of epochs to 100, the optimizer was Adam, and the stride of the max pooling layer was set to 2.
The results are shown in Figure 6, where the x-axis represents the F-score, and the y-axis represents 1950 different features. By selecting multiple thresholds for testing and using Mean Square Error (MSE) as an evaluation indicator, features can be selected from the ranking of feature correlations. The threshold is calculated as the feature correlation of the current feature score divided by the sum of all 60 feature scores. For example, if the number of selected features is 10, the threshold is equal to the score of the top 10 features in the feature importance ranking divided by the total score of all 60 features. As shown in Table 2, due to space limitations, only a small number of features and corresponding thresholds are listed. Finally, among the 60 features, the approximate Markov blanket feature selection method selects the top 30 features most relevant to intrinsic viscosity as the final input variables of the model.

Importance ranking of process parameters.
The statistical MSE results of Testing set on different feature numbers.

Time delay analysis experiment
To verify the effectiveness of the time delay analysis method, time delay analysis experiments were conducted specifically for linear pipelines and bifurcated pipelines. Using the esterification reaction stage depicted in Figure 7 as the experimental object, the 10 variables involved are listed in Table 3. These include the inlet temperature of the esterification reactor, the flow rate of the esterification reactor, the pressure of the esterification reactor, the siphon pressure, and the outlet pressure of the oligomer. Full-day production data from March 1, 2019, was selected for the calculation, with a sampling period of 2 min. The time window size was set to 2 h based on the polymerization degree of the esterification reaction tank. The experimental calculation results are shown in Table 3.

Esterification reaction stage.
Tag number description.

Time delay analysis experiment of linear pipeline
Using the esterification reactor depicted in Figure 7 as the calculation object, five variables were selected: the inlet temperature of the esterification reactor (240°C), the flow rate of the esterification reactor, the pressure of the esterification reactor, the siphon pressure, and the outlet pressure of the oligomer. Full-day production data from March 1, 2019, was selected for the calculation, with a sampling period of 2 min. Part of the data is shown in Table 4. Using the esterification feed temperature TI53115 as the reference tag, the time window size was set to 2 h. The calculation results are presented in Table 5.
Esterification reactor process parameters.

Esterification reactor process parameter delay time.

Time delay analysis experiment of forked pipeline
Using the distilled water reactor shown in the figure as the experimental object, we selected the initial water temperature, top temperature of the distillation kettle, pressure of the distillation kettle, middle reflux extraction temperature, and bottom temperature of the distillation kettle as calculation variables. Production data for the entire day on March 1, 2019, was chosen for the calculation, with a sampling period of 2 min. Part of the data is shown in Table 6. Using the esterification feed temperature TIC53210 as the reference tag, the time window size was set to 2 h. The calculation results are presented in Table 7.
Distilled water reactor process parameters.

Distilled water reactor process parameter delay time.

Experiment on predicting intrinsic viscosity
In the training of the intrinsic viscosity prediction model, the pooling layer used the max pooling method, the learning rate was set to 0.002, the batch size to 32, the number of epochs to 160, and the optimizer was Adam. In the distilled attention module, we designed a one-dimensional convolution and a max pooling layer with a stride of 2, gradually reducing the length of the sequence data through the same operation to suppress the number of locally sensitive hash attention distillation layers.
To demonstrate the effectiveness of our proposed prediction method, we conducted two sets of comparative experiments. The first set evaluated the performance of Transformer, PIST-CVAE, 34 TS-λ GRU, 35 and TDA-LSHA-Informer. Table 8 and Figures 8, 9, 10 illustrate that with a sequence length of 100, all methods exhibited relatively low Mean Absolute Error (MAE) and Root Mean Square Error (RMSE), with TDA-LSHA-Informer achieving the lowest MAE of 0.0160 and RMSE of 0.0257. However, as the sequence length increased to 200 and 300, the MAE and RMSE values for each method also increased, indicating reduced prediction accuracy. Nevertheless, TDA-LSHA-Informer consistently outperformed the other models. Specifically, at a sequence length of 200, TDA-LSHA-Informer yielded MAE and RMSE values of 0.0365 and 0.0540, respectively, while at 300, these values were 0.0484 and 0.0619. These findings demonstrate the robust performance of TDA-LSHA-Informer across varying sequence lengths.
Prediction of polymer intrinsic viscosity with different length.


Length100: polymer intrinsic viscosity prediction.

Length200: polymer intrinsic viscosity prediction.

Length300: polymer intrinsic viscosity prediction.
Next, we evaluate the effectiveness of time delay analysis. The LSHA-Informer represents our proposed method without incorporating time delay analysis. Experimental results indicate that when predicting sequences of equal length, the TDA-LSHA-Informer, which considers time delay, achieves superior prediction accuracy compared to the LSHA-Informer without this consideration (Figure 11).

Comparative experiment between TDA-LSHA-Informer and LSHA-Informer.
Conclusion
In this paper, we propose a three-stage model for predicting polymer intrinsic viscosity over long time series data. This method effectively addresses the challenge of predicting viscosity over extended sequences while accounting for time delays. Initially, to handle the high dimensionality of process parameters in polymerization, we employ the MIC to extract features. This is achieved through a redundancy analysis method based on approximate Markov blankets. Next, acknowledging the time delays inherent in process industries, we introduce a method for time delay analysis. This approach computes the delay times between different process parameters, aligning closely with simulation results. Lastly, we introduce the TDA-LSHA-Informer model, an innovative framework for polymer viscosity prediction. Experimental results demonstrate the efficacy of our feature selection method in screening relevant process parameters. Our proposed time delay analysis method proves effective, particularly when integrated with the enhanced capabilities of the Informer model, yielding superior performance in long sequence prediction tasks while accommodating time delays.
However, our method relies heavily on high-quality data, and practical challenges such as missing data can impact prediction accuracy. Moreover, the complexity of our model, leveraging multi-head self-attention and locally sensitive hash attention, presents challenges in interpretability. Future research efforts will focus on addressing these limitations.
Footnotes
Declaration of conflicting interests
The author(s) declared no potential conflicts of interest with respect to the research, authorship, and/or publication of this article.
Funding
The author(s) disclosed receipt of the following financial support for the research, authorship, and/or publication of this article: This work was supported by the Program of the National Natural Science Foundation of China under Grant No. 52005099, the Open Project of Henan Key Laboratory of Intelligent Manufacturing of Mechanical Equipment, Zhengzhou University of Light Industry under Grant No. IM202303, and Shanghai Science and Technology Innovation Action Plan under Grant No. 22511101903.