
Abstract
This research delves into using machine learning techniques to enhance the airflow dynamics in Airjet spinning. It focuses on understanding the factors that affect airflow by examining components of a spinning nozzle including the fiber inlet element, injector nozzle and spinning spindle. A prototype Airjet spinning nozzle was developed to evaluate the Intake Airflow and Airflow Rate, which serve as the basis for a simulation model. A total of 501 data points were empirically gathered, and machine learning methods were applied to uncover patterns and make predictions. The study combines conventional measurement techniques with data analysis tools, like linear regression, decision trees, random forest and support vector regression. After developing a applicable machine learning tool, the hyperparameters are optimized with the goal to improve the model’s reliability. Following this optimization process it was found that the CatBoost model outperformed ML models in terms of all performance metrics. Furthermore insights, into how nozzle features impact airflow dynamics were obtained through sHapley Additive exPlanations (SHAP) analysis. The results indicate that specific nozzle design parameters play a significant role in improving airflow dynamics. Integrating machine learning techniques into the design process marks a departure from conventional empirical methods. This scientific method allows for a more rapid and precise Airjet nozzle design process, fostering innovation in textile manufacturing technology.
Keywords
Introduction
Airjet spinning plays a pivotal role in yarn manufacturing by improving efficiency and lowering energy consumption. 2 The core of this process centers around the Airjet spinning nozzle, which impacts yarn characteristics through its design and operational features. Important factors such as Intake Airflow and Airflow Rate are key in providing the kinetic and rotational energy for effective fiber drawing and twisting.1,2 Intake Airflow affects the air velocity and suction force at the nozzle entrance for fiber drawing. At the same time, the rotational airflow contributes to process stability during spinning and influences the mechanical properties of the resulting yarn.3,4 Yarns produced using Airjet spinning technology have a bipartite structure with a central core of fibers aligned parallel to the yarn axis and surrounded by helical wrapper fibers. The core provides the structural integrity, while the wrapper fibers contribute to its integrity, strength, and elongation properties.5,6 This helical nature of the wrapper fibers results in an irregular yarn appearance, distinguishing airjet yarns from traditional spinning technologies. 7 Compared to ring-spun and rotor-spun yarns, airjet yarns exhibit higher variability in evenness due to the uneven distribution of wrapper fibers. One notable advantage of airjet yarns is their reduced hairiness, leading to better abrasion resistance and a lower pilling propensity. 8 However, the overall strength of airjet spun yarns is moderate since the majority of the yarn’s character is determined by the untwisted, parallel fiber core. Although the wrapping fibers offer some reinforcement, the overall tenacity is not as high as ring-spun yarns.9,10
Designing airjet spinning nozzles challenges balancing airflow factors to maintain process stability and consistent yarn quality. The airflow within the nozzle is affected by interconnected elements like nozzle shape, air pressure, and material characteristics. Existing design practices lack robust predictive models that can accurately forecast the impact of design changes on airflow dynamics and yarn properties. This study aims to develop a data-driven framework for optimizing airjet spinning nozzle design through machine learning techniques. By merging real-world data with analytics methods, this holistic approach aims to pinpoint design factors influencing airflow dynamics and offer practical insights for enhancing nozzle design. Employing these techniques, it may unveil patterns and insights overlooked by conventional approaches. Improving airflow dynamics can reduce energy consumption during spinning processes, promoting sustainability efforts on a scale. The knowledge gained from this research can be extended to other parts of the spinning system, making the design process more scalable and adaptable to different production needs.
State-of-the-art airjet realtwist spinning
Airjet real twist spinning is a technique in yarn production that uses a single nozzle system to twist fibers around a core fiber. It was first showcased by Murata Machinery Ltd. at the International Textile Machinery Show in Osaka in 1997, building upon patent documents from the 1980s to address the energy consumption and processing challenges of long staple fibers.11–13 A notable improvement came with introducing the Murata Vortex Spinner (MVS) 810, which enhanced fiber bond strength by redesigning the nozzle to generate an efficient swirling airflow. 14 This configuration ensured yarn tension and reduced fiber splaying, enabling the production of yarns from 100% carded cotton.
The evolution of airjet development saw significant contributions from multiple industry players. Rieter AG introduced their Airjet spinning machine J10 after patent filings in 1991. 15
Saurer Spinning Solutions GmbH & Co. debuted in the market in 2019 with the Autoairo Airjet spinning machine, leveraging patents dating back to 2000.16,17 Muratec continued to innovate with the Vortex 870 EX, unveiled at ITMA Barcelona in 2019, which featured enhanced tension regulation and increased production speeds. 18
Recent models like Rieter’s J70 unveiled at ITMA 2023 have pushed production speeds up to 600 m/min, demonstrating a quest for increased speeds and superior quality in airjet spinning technology. 19 Pursuing production speeds drives innovations in spinning technologies while catering to a range of yarn counts and end uses across different materials. The advancement of this technology underscores the textile industry’s dedication to enhancing efficiency, reducing energy consumption and elevating the products’ quality.
Methodology
To support the investigative analysis, an Airjet spinning Nozzle was developed. Controlled airflow measurement studies were undertaken to evaluate the influence of different nozzle parts empirically. The components of the spinning nozzle chosen for the measurements differ in constructional design and applied materials.
Empirical data collection
The measurement of air mass flow in the spinning nozzle aims to quantify the airflows within the nozzle’s enclosure. Using a mass flow meter from Voegtlin Instruments guarantees consistent data collection regardless of pressure or ambient temperature changes. 20 The mass flow rate is physically determined and expressed in liters per minute by operating on the calorimetric method. The primary measurements include;
Intake Airflow : The rate at which air enters the system is measured by connecting the tool to the entry point of the spinning nozzle.
Airflow Rate: The rate of air that forms the rotating vortex, measured by connecting the instrument to the air supply of the spinning nozzle.
This dataset is randomly split into:
Training Dataset: Utilized for model training.
Validation Dataset: Employed to assess the models’ performance during training and for hyperparameter adjustments.
Test Dataset: The final performance was evaluated after training and hyperparameter optimization. The model should not see this dataset throughout training and tuning processes to provide an unbiased evaluation of its performance.
Research variables and process
The research methodology involves measurements with the Airjet spinning nozzle to assess airflow patterns with various nozzle geometries. Optimizing the application of machine learning leads to minimizing the variables considered displayed in Figure 1, as each variable introduces variances that may lead to prediction uncertainty. As a result, only two dependent variables were singled out:
1. Intake Airflow :
•
•
2. Airflow Rate:
•
•

Comparison of dependent and independent variables.
The Intake Airflow and Airflow Rate are collected and digitally stored for every nozzle setting. In total, 501 data points were measured. The dataset includes airflow dynamics inside the nozzle regarding air pressure and volumetric flow rate. The second part of the analysis includes the development of a Machine Learning tool to predict those flow dynamics. The groundwork for developing machine learning techniques is laid out with exploratory data analysis. It uses statistical methods to understand the data and uncover emerging patterns and anomalies.
Following this stage, various regression techniques shown in Figure 2 are employed to predict these particular airflow characteristics based on the settings of the Airjet nozzle.

Machine learning development path for the quantitive dataset.
After finding a promising machine learning model, it is undergoing Hyperparameter Tuning to optimize influential parameters further. Key steps include a data splitting process through a 5-fold cross-validation technique. Consistent performance across folds indicates the model’s resilience and reliability. Python is used to develop the machine learning models presented later.
Model validation variables
Different model types imply different validation metrics. For the employed Regression techniques, the following performance metrics are essential: Mean Absolute Error (MAE), Mean Squared Error (MSE), R-squared, and Explained Variance Score (EVS).
Mean-squared loss
The average square difference between the predicted and actual values is calculated, squared, and added (equation (1)). If the MSE is high, the model fits poorly. With the MSE, larger errors are more emphasized than smaller ones because the errors are squared. 21 This can be particularly useful if larger errors should be more panelized. A drawback is created when a dataset contains outliers, as squaring large errors can significantly increase the MSE.

Mean absolute error
The MAE calculates the absolute deviations between predictions and actual values, then calculates the average by dividing it by the total number of training examples (equation (2)). The Mean Absolute Error treats all mistakes equally, giving a linear score that doesn’t disproportionately penalize larger errors over smaller ones.
Coefficient of determination
R² is utilized to evaluate the explanatory power of a model, helping to determine how well it captures the underlying patterns of the data. The value reflects how much variation an independent variable explains a dependent variable (equation(3)). The coefficient of determination predicts values between 0 and 1, where 0 implies that the model does not explain variations around the mean value. 22

SSR: Sum of squares using regression (explained sum of squares).
SST: Total sum of squares.
Explained variance score
The score for explained variance is calculated by comparing the variance of the actual data with the variance of the model predictions (as shown in equation(4)). It reflects the difference between predicted and actual values. This score ranges from 0 to 1, where 0 signifies that the predictor variable(s) cannot account for the response variable, and 1 indicates that they can fully explain it accurately.
The explained variance score shows how effectively the model captures the variability of the variable, while R2 assesses how well regression predictions align with actual data points.

Analysis of airflow dynamics in the airjet spinning nozzle
The entire spinning process, including fiber formation and twist insertion, occurs due to the combination of two airflows: intake airflow and rotational airflow. Figure 3 serves as graphical support to explain the airflow dynamics. The spinning nozzle features injector orifices (3) pressurized with external air. These orifices align tangentially toward the spindle (5), allowing the injected air to strike the spindle tip.

Spinning Nozzle Prototype and surface fibers rotation around the spinning spindle. 23
Looking at Figure 3, the tangential arrangement of the injector orifices induces the formation of a rotational airflow within the confined cylindrical spinning chamber. 24 The high-speed airflow from the injector orifices forms a low-pressure zone at the center of the spinning chamber. A pressure gradient is created with the internal pressure in the chamber being lower than the external atmospheric pressure. 25 This differential pressure generates an Intake Airflow, which acts as a suction force. This suction is essential for drawing fibers from the drafting system into the nozzle inlet (1) and initiating the fiber integration into the spinning process.
The rotational airflow accelerates downstream toward the air expansion chamber and collides with the Intake Airflow spirally in the vicinity of the spindle. The two partial air streams merge into one airflow and are expelled through the air vent. Fibers that are not clamped by the output rollers and not caught by the rotational airflow result in loss fibers as they are sucked out of the nozzle block.
Intake airflow
The Intake Airflow represents the volumetric flow rate at which air flows into the system. It is created by the rapid movement of air through the injector orifices. The behavior of air in the nozzle follows dynamics principles, where Bernoulli’s principle links air pressure and velocity. This principle explains the relationship between air pressure and air velocity.
Compressed air enters the injector orifices via the air supply, significantly reducing the cross-sectional area between the air pressure source and the injector orifices. The compressed air is initially at a higher pressure and lower velocity in the wider section of the supply line. As the air approaches the injector nozzles, the cross-sectional area of the pathway narrows significantly. According to the principles of fluid dynamics, specifically the continuity equation (5), this reduction in cross-sectional area necessitates an increase in airflow velocity to maintain a constant mass flow rate. Assuming the flow is incompressible and non-viscous, the energy is conserved along the streamline.26,27

ρ: Fluid density.
ν: Fluid velocity.
According to Bernoulli’s principle and the Venturi effect, this increase in velocity results in a decrease in static pressure. 27 This reduced pressure creates a suction force that captures the fibers by pulling them into the nozzle.
Pei and Yu have proven the presence of a pressure zone in the nozzle chamber by studying the pressure distribution and velocity vectors using a numerical CFD κ-ε turbulence model. 28 They have also shown that the collision of the air currents distorts the airflows, resulting in a reverse flow that forms a vortex and separates the fibers from the bundle.
In their research on an Airjet spinning machine, Zeng and Yu 29 emphasized the importance of axial and tangential velocities within the nozzle. The axial airflow velocity creates suction at the nozzle entrance for fiber drawing and transportation. The effective drawing and transportation of fibers by the nozzle are essential for yarn production and directly impact yarn quality. Their study noted that increasing nozzle pressure elevates axial velocity, improving fiber drawing and transport processes. However, there is a threshold beyond a further increase in nozzle pressure that may not enhance performance.
Rotational airflow
The air movement creates the rotational current through the injector orifices, which generates a rotational airflow. Understanding the rotational airflow becomes more complex when considering both translational and rotational kinetic energy. The pressurized air serves as a force to sustain a consistent circular movement, demonstrating a phenomenon known as forced vortex flow. Forced vortex flow occurs when a fluid rotates around an axis due to an external force rather than its inherent properties. The air’s kinetic energy transforms into rotational energy within the nozzle, which is utilized to twist the fibers. The velocity and intensity of the twists are determined by their angular velocity revolving around the air expansion chamber. 24 This angular velocity is influenced by air pressure and air injection velocity. Higher pressure leads to faster vortices. Elements like nozzle inlet ratio, injector orifice angle, quantity and diameter, and the spinning spindle contour shape influence the rotational airflow, affecting air speed within it. Increased airflow results in tightly wrapped fibers around the fiber core, while higher speeds cause fibers to wind more sharply. 30
Machine learning model development
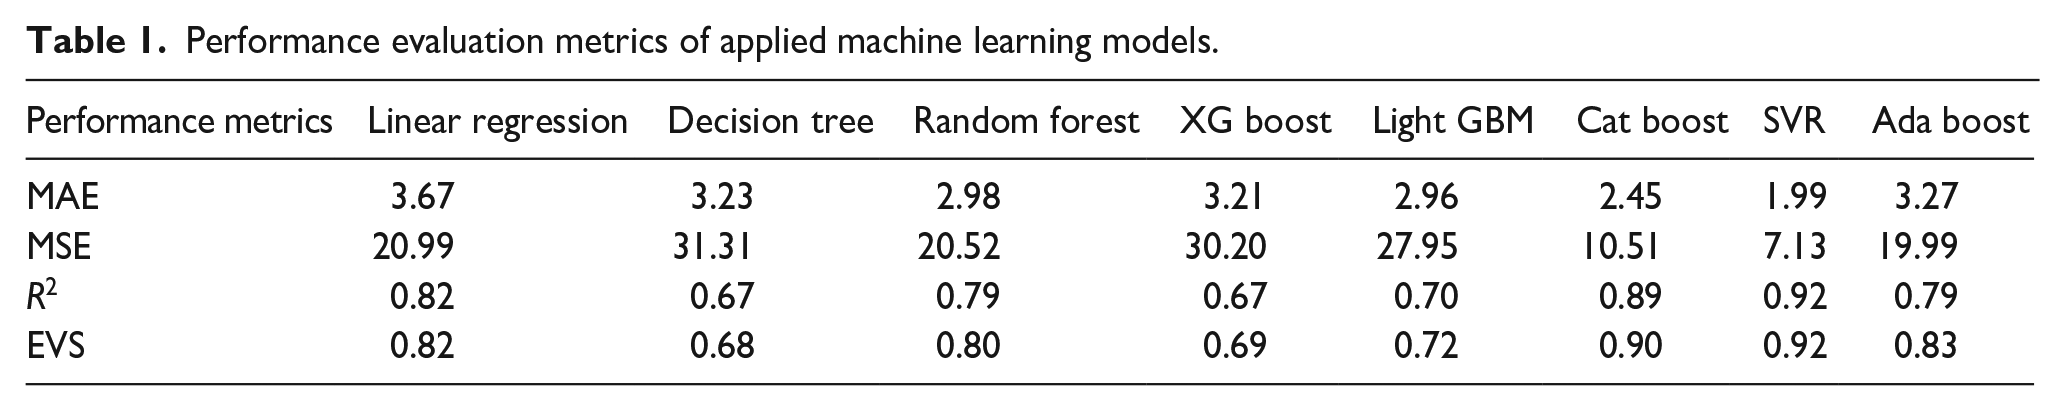
According to Table 1, various machine learning algorithms have been employed in the flow masses dataset to identify the model with the highest predictive accuracy and robustness. Table 1 and Figure 4 summarize the findings.
Performance evaluation metrics of applied machine learning models.

Performance metrics plot comparison of all applied machine learning models.
Of all the models considered, only the top two performing ones are highlighted as they show promise for hyperparameter optimization.
Support vector regression
Based on the empirical findings obtained from the comparison study, the SVR model demonstrates superior performance with the lowest Mean Absolute Error of 1.99 and Mean Squared Error of 7.12. Also, it has high predictive accuracy and explains the variance in the dataset with 92.39 % exceptionally well. The scatter plots in Figure 5 show data points closely aligned along the regression line (y = x), indicating that the predicted values are close to the actual values. The small deviation of points from the diagonal line suggests that the residuals are minimal, which indicates a good fit. A few points deviate more significantly from the diagonal line, which could represent outliers or instances where the model’s predictions were less accurate.

SVR model results.
CatBoost
CatBoost boasts an MAE of 2.45, and compared to all other models, it has fewer prediction errors with an MSE of 10.51. It stands out with an R2 value of 0.89 and a respectable EVS of 0.90. The scatter plots in Figure 6, combined with the performance metrics, indicate that the machine learning model used in this study provides highly accurate predictions for both intake airflow and airflow_rate. The model demonstrates excellent predictive power, as evidenced by the strong alignment of the scatter plot points along the diagonal and the high R2 and EVS values.

CatBoost model results.
Hyperparameter optimization
The model undergoes training using the training dataset and fine-tunes its hyperparameters with the validation dataset. Testing the model on a dataset that has not been seen before is crucial to verify that the chosen hyperparameters generalize well beyond the training data. The test dataset remains untouched until the final evaluation. 21 The key steps involve;
Data Splitting: A 5-fold cross-validation technique is applied during data splitting. The dataset is split into 5-folds, each taking turns as the training or validation set.
Model Training and Validation: For each fold, the model is trained on the training set and then assessed on the validation set. 31
Over 200 trials, different combinations of hyperparameters were examined to enhance performance metrics. The outcomes will be presented through a comparative performance analysis between SVR and CatBoost in a side-by-side Table 2.
Final ML model comparison with performance parameter side-by-side.

Model selection
When comparing CatBoost and SVR in Table 2, it’s clear that CatBoost consistently performs better across all the metrics. Specifically, CatBoost has an MAE of 2.3618, which is lower than the SVR MAE of 2.5397. This means that CatBoost predictions are generally more accurate. In addition, the MSE for CatBoost is 11.1858, lower than the 14.1059 observed for SVR, indicating that CatBoost has fewer prediction errors overall and less deviation.
Moreover, CatBoost shows an R2 value of 0.8343 compared to SVRs of 0.7668. This higher R2 value indicates that CatBoost explains more of the variance in the target variable, showing a fit for the data. The EVS also backs this up, with CatBoost scoring 0.8349 compared to SVRs 0.7717, confirming that CatBoost is better at capturing the dataset’s variability and, therefore, a reliable model for predictive tasks. The bar chart in Figure 7 quantifies the impact of each hyperparameter on the objective value. The plot reveals that the learning rate stands out as the crucial hyperparameter contributing significantly (86%) to the objective value and substantially influences the model’s performance. Maintaining a balanced learning rate is essential. Setting it too high may lead to quick convergence toward suboptimal solutions, while setting it too low may result in slow convergence processes.

CatBoost model hyperparameter importance.
In Figure 8 of the SVR model, the regularization parameter (C) holds the most critical importance, making up 42% of the model’s effectiveness. This parameter plays a role in balancing error reduction on training data and keeping model complexity in check. The second important parameter is the kernel type, with a 27% contribution. The kernel function determines how input data is transformed, playing a role in capturing the underlying patterns within the data. Based on the comparative analysis of the performance metrics, CatBoost outperforms SVR in terms of accuracy, stability, and the ability to explain the variance in the data.

SVR model hyperparameter importance.
Model validation
The CatBoost regressor model was trained to predict Intake Airflow and Airflow Rate outputs using flow masses data input. The following application utilizes SHapley Additive exPlanations (SHAP) analysis to interpret the predictive model’s output. It is a graphical representation tool in machine learning that summarizes the impact of each feature on the model’s predictability.
Each row on the y-axis corresponds to a different variable from the dataset used to train the machine learning model.
Looking at the x-axis of Figures 9 and 10, SHAP values are plotted for the Intake Airflow and Airflow Rate, which quantify the impact of each feature on the model’s output. It ranges between −7.5 and +7.5 in the case of the Intake Airflow and between −30 and +30 for the Airflow Rate. If a variable is located on the right side of the zero line, the variable pushes the model’s prediction higher. Each point represents a data row from the original dataset. A SHAP value can be either positive or negative:

SHAP summary plot feature importance intake airflow.

SHAP summary plot feature importance airflow rate.
The spread of the SHAP data points indicates the influence impact. This means a narrow spread can be interpreted as a consistent influence instead of a wider spread, which stands for greater variability. The plot arranges the features in descending order of importance with the most influential variable on top.
Discussion
Findings for intake airflow
The “Air” parameter, which refers to the compressed air directed into the spinning nozzle, significantly impacts the output of Intake Airflow. Figure 9 suggests higher air pressure decreases Intake Airflow as the red SHAP values shift toward the left. This observation aligns with Bernoulli’s principles, which suggest that an increase in air velocity (caused by a decrease in cross-sectional area) results in reduced Intake Airflow.
Impact of nozzle components on intake airflow
The SHAP analysis underscores the impact of Injector orifices’ angle, quantity and inner diameter on Intake Airflow. The fiber inlet cross-sectional ratio, the manufacturing material and Injector Nozzle inlet contour are proven to have an impact. However, the spinning spindle tip length and inner diameter do not appear to play a role.
Injector nozzle orifices
Orientation Angle: refers to the angle at which the injector orifices are positioned in the space, directly affecting where the airflow meets the spinning spindle. Higher orientation angles increase airflow, as the predominantly red SHAP points on the right side show a more positive model output.
Amount: This feature refers to the overall quantity of injector orifices in the injector nozzle. A higher number of injector orifices is associated with increased Intake Airflow, indicated by the red SHAP values on the right side of the graph.
Diameter: Generally, larger diameters tend to reduce Intake Airflow, as evidenced by most red data points falling within the negative SHAP range. However, existing red points on the right side also suggest that there are occasions where larger diameters could potentially increase Intake Airflow.
Fiber inlet element
A noticeable pattern has developed in this aspect. The SHAP values indicate red points on the left and blue on the right. When the cross-sectional area is larger, it typically reduces Intake Airflow because of air velocity and higher static pressure, which coincides with the Bernoullis principle. Conversely, smaller cross-sectional areas necessitate an increased Intake Airflow to uphold airflow.
Spinning spindle
Tip Length: Refers to the outer contour of the spinning spindle, directly impacting the architecture of the air expansion chamber. Blue points clustered around zero SHAP values indicate that tip length has a negligible impact.
Inner diameter: Refers to the hollow spindle inner diameter. The feature ‘inner_diameter’ has minimal influence on the system’s dynamics. Adjusting the diameter doesn’t seem to impact either airspeed, which means it doesn’t affect the intake airflow significantly.
Findings for airflow rate
When the air values are higher, represented by red points on the right side, it increases the model output of airflow rate. Conversely, lower air values result in a decrease in the models’ output. This indicates that increasing the air supply directly increases the airflow rate, aligning with the physical expectation that more air input results in higher airflow.
Impact of nozzle components on intake airflow
Conversely to the intake airflow, the airflow rate seems only to be substantially impacted by the injector nozzle. The analysis below discusses how each component affects the airflow rate based on their importance ranking in Figure 10.
Injector nozzle orifices
Diameter: This feature demonstrates positive effects on the flow rate. Larger diameters correspond to higher SHAP values, indicating that increasing trajectory orifice diameter results in a proportional increase in airflow rate.
Orientation angle: it’s interesting to note that the impact of the “orientation_angle” feature is quite complex, showing both negative and positive SHAP values. However, there seems to be a trend where lower orientation angles are linked to a positive SHAP impact. The influence of orientation angle on airflow varies based on system configurations and interactions with other factors. This complexity highlights the importance of a nuanced approach when adjusting orientation angles for airflow dynamics.
Amount: Higher values of “number_trajectory_hole” result in negative SHAP values, while lower values (blue points on the right) show a wider vertical cluster. Having more injector orifices leads to decreased airflow rates. This finding implies that increasing orifice numbers may introduce more turbulence within the nozzle, potentially reducing airflow rates.
Other features, including “cross_sectional_area,” “material1_Ceramic,” “material1_Steel,” “peculiarity_Straight,” “peculiarity_Oblique,” “tip_length,” and “inner_diameter,” show minimal impact on the predicted airflow rate. The SHAP values for these features are generally close to zero, suggesting that they play a secondary role in influencing the airflow dynamics compared to the key features discussed above.
Conclusion
Researching and assessing machine learning models to forecast airflow masses has offered valuable insights into the most effective algorithms. The findings underscore the potential application of Support Vector Regression and CatBoost among the models reviewed.
Based on the analysis in Table 1 and Figure 4, initially, SVR exhibited top-notch performance with the training dataset, boasting the lowest mean absolute error (1.99) and mean squared error (7.13), coupled with the highest R2 and explained variance score values. These results indicate that SVR excels in accuracy and reliability when predicting flow masses. CatBoost also produced positive results at the time, particularly with an MAE of 2.45 and MSE of 10.51, positioning it as the second-best performing model after training.
Following hyperparameter optimization, CatBoost emerged as the more robust model that outperformed SVR in the final evaluation (Table 2). The tuned CatBoost model exhibited lower MAE and MSE values, alongside higher R2 and EVS values than SVR, confirming its superior predictive capability on the flow masses dataset. Before hyperparameter optimization, any model uses default hyperparameters provided by the machine learning library, and these settings may not be optimal for the specific dataset. Also, in the first instance, any model is trained with the training dataset, but the hyperparameter optimization process applies the validation dataset. Models are retrained with optimized hyperparameters and generalize better to unseen data. This process reveals that a model initially perceived as less effective (such as CatBoost) emerges as superior once properly adjusted. The study then delves into the SHAP analysis, which offers insights into how the model makes decisions. Factors such as air pressure, the orientation angle of injector nozzle orifices, and the amount and the diameter greatly impacted Intake Airflow predictions. On the other hand, the Spinning Spindle showed minimal influence. Regarding Airflow Rate, only the injector nozzle components played a pivotal role, especially the diameter and orientation angle, which significantly determined the models’ output.
CatBoost excels in handling categorical features and reducing overfitting, making it ideal for complex datasets like those applied airflow dynamics datasets. SHAP quantifies feature contributions to predictions and enhances model transparency. Combining CatBoost’s accuracy with SHAP’s interpretability provides a comprehensive understanding of model behavior because the model itself can explain why those predictions are made. This synergy builds trust in the models’ output and can allow acceptance of the model in real-world applications. The key advantage of this synergetic predictive modeling is the actionable insights it provides for targeted design improvements for the nozzle design. For instance, optimizing injector orifices’ orientation angle or diameter can boost kinetic energy to optimize energy input and improve spinning process efficiency.
The next step would involve incorporating fiber or yarn characteristics to develop further and explore more machine learning tools’ uses. For instance, attributes like fiber length, diameter, tensile strength, and composition can be categorical features. By utilizing these fiber properties as inputs, a model can be trained to forecast outcomes such as yarn quality, production efficiency or the mechanical traits of the end product. These methods would encompass both supervised and unsupervised learning approaches. Employing methodologies like clustering to categorize fibers based on their characteristics can aid in comprehending the correlation between fiber properties and processing performance. It could facilitate tailoring the Airjet spinning process according to the characteristics of fibers, thereby optimizing performance and quality for diverse applications.
Footnotes
Declaration of conflicting interests
The author(s) declared no potential conflicts of interest with respect to the research, authorship, and/or publication of this article.
Funding
The author(s) disclosed receipt of the following financial support for the research, authorship, and/or publication of this article: The authos(s) received financial support for the research, authorship, and/ or publication of this article from Research Institute for Textile and Clothing (FTB), Mönchengladbach, Germany.