
Abstract
As a constituent of composites, fibers play a pivotal role in composites’ properties. In this study, an identification process for fiber shape is developed to enhance the transverse coefficient of thermal conductivity. The identification process is established by combining feedforward neural network, Kriging surrogate model and NSGA-II algorithm. The identification process leads to the discovery of an ellipse-like fiber shape which results in a 202.7% increase in thermal conductivity. However, the equivalent thermal conductivities of the models with ellipse-like fiber are highly dependent on fiber shape orientation. Another fiber shape, gear shape, is identified and a more than 100% increase in thermal conductivities is achieved along different fiber shape orientations. The effects of the fiber random distribution patterns are revealed with different fiber shapes considered. The results demonstrate that when the fiber random distribution pattern is considered, the thermal conductivity of model with gear fibers exhibits the largest increase due to the effects of fiber shape orientation. Furthermore, the equivalent transverse thermal conductivity can be enhanced by the non-circular fiber shapes only if the fiber-matrix thermal conductivity ratio is larger than a certain value which is dependent on the fiber shape. With the increase of the fiber volume fraction, the optimal fiber shape becomes more and more similar to the circular shape and the effects of non-circular fiber shape become less.
Keywords
Introduction
The metal materials are being replaced with fiber-reinforced composites due to their higher specific strength and specific stiffness. However, the thermal conductivity of polymer composites is usually at least one to two orders of magnitude lower than that of metals which precludes their usage. 1 The properties of composites are dependent on the properties of components and the geometrical characteristics of fibers. With the development of manufacturing techniques,2,3 non-circular fibers can be obtained. Thus, the optimization of fiber shape can be a potential way to improve the thermal conductivity coefficient, especially along the transverse direction.
Numerous studies have been conducted to investigate the effects of fiber shape on the transverse mechanical properties of unidirectional composites. Herráez et al. 4 analyzed the effects of different fiber shapes on transverse damage behaviors of unidirectional composites under tensile, compressive and shear loadings. Based on the perimeter-area ratio values, the gear shape fiber has been proven to be able to enhance the transverse mechanical properties of unidirectional composites in Yang et al. 5 The coupling effects of gear fibers and voids on transverse damage behaviors of unidirectional composites were revealed in Wang et al. 6 He et al. 7 found that the random distribution of elliptical fibers prevents crack propagation and enables the model with elliptical fibers to withstand higher loadings. The flat glass fibers can contribute more to composite strength than circular fibers in Thomason. 8 Generally, the transverse mechanical properties of non-circular fiber reinforced composites are superior to those of circular fiber reinforced composites.
There are also numerous studies focusing on evaluating the effects of fiber shape on thermal conductivities.9 –14 In Bao et al., 9 the fiber volume fraction was set to be 20% and it was found that the effects of elliptical and square fiber shapes can be ignored. In Hassanzadeh-Aghdam et al., 10 the effects of circular and square fibers on the transverse thermal conductivity are compared across a fiber volume fraction ranging from 5% to 60% and the differences between them are small. However, in Shim et al., 11 through comparing the thermal conductivities measured from the composites with round, C, and hollow fibers, it was found that the thermal conductivity was greatly dependent on the fiber shape. Kaddouri et al. 12 compared the effects of elliptical inclusion and circular inclusion on transverse thermal conductivity. They found that when the thermal conductivity of the inclusion is lower than that of the matrix, an increase in the aspect ratio of the elliptical inclusion leads to a decrease in the equivalent thermal conductivity. Nakka et al. 13 analyzed the effects of elliptical fiber on transverse thermal conductivity. It was found that when the thermal conductivity of the fiber is larger than that of the matrix, the equivalent transverse thermal conductivities increase with the aspect ratio of elliptical fiber. The variation in the values also increases. She et al. 14 also analyzed the effects of elliptical fiber shape on transverse thermal conductivity. They found that the effective thermal conductivity of a composite was influenced by the fiber size, fiber orientation, and fiber distribution pattern. From the studies on thermal conductivity mentioned above, it can be deduced that the effects of non-circular fiber shape are dependent on fiber volume fraction, fiber-matrix thermal conductivity ratio, fiber shape orientation and fiber distribution pattern.
In the studies mentioned above, the number of fiber shapes considered in the thermal conductivity analyses is much less than that for the mechanical property prediction. Furthermore, the non-circular fiber shapes are all selected based on expert knowledge. Recently, an optimization process has been developed to find the optimal fiber shape within a large set of fiber shapes to identify opportunities for reducing the cost of carbon fiber. 15 Based on the identified non-circular fiber shape, Camarena et al. 16 analyzed the longitudinal compressive strength of the fiber shapes using micromechanical models and found that a 13% increase in the strength value can be achieved.
In this study, an optimization process of the fiber shape is conducted to achieve a larger transverse thermal conductivity of unidirectional composites. The evaluation of the optimal fiber shape will also be carried out with several critical influencing factors considered. Firstly, an optimization framework based on various numerical methods is developed to facilitate the optimization process. Then, the influencing factors, including fiber random distribution, fiber-matrix thermal conductivity ratio and fiber volume fraction, are introduced. Finally, the optimization and evaluation of non-circular fiber shapes are presented and discussed.
Model generation
Parameterized shape function
To obtain the optimal fiber shape, a parameterized shape function is needed. The function referred from Ennis et al. 15 is adopted in this study. The boundary of the fiber shape is described in equation (1).
where r(θ) is the distance between the fiber center and the fiber boundary at angle θ. h is a variable used for distance normalization and is calculated with equation (2). The variable k is a positive integer that indicates the number of lobes. S is defined as a positive value that adjusts the amplitude of the lobes. R is a value between 0 and 1 that controls the relative amplitude of alternating lobes. R must equal 1 when k is an odd number so that the shape is continuous. R allows for non-axisymmetric shapes in some cases. n adjusts the curvature of the shape. A large n results in steep and narrow lobes. As in Ennis et al., 15 the ranges of the four geometrical parameters of the fibers (k, S, R, n) are set to be within, [2:1:9], [0.1:0.1;3], [0.05:0.05:1], [1.1:0.1:5], respectively. These geometrical parameters are defined as the design variables. The fiber radius of the circular fiber is set to be 7 μm. The Acir in equation (2) is the area of the circular fiber and can be determined using the radius of the circular fiber.

Constraints of the design domain
To conduct the fiber shape optimization analysis, the design domain should be defined. In this study, the design domain will be determined by the circular fiber square distribution model for each fiber volume fraction. This means that a circular fiber distribution model should be established for each fiber volume fraction and the square region of the circular fiber model is designated as the design domain. The design domain for a 50% fiber volume fraction is presented here as an example. The corresponding circular fiber square distribution model is shown in Figure 1 and the design domain with the fixed fiber center is illustrated in Figure 2. The d is half the length of the design domain.

Circular fiber square distribution model with a 50% fiber volume fraction.
Illustration of the design domain for a 50% fiber volume fraction.
If the fiber volume fraction is large, the non-circular fiber shape derived from the geometrical parameters within the ranges shown above could exceed the design boundary. A constraint function should be satisfied as shown in equation (3) during the optimization process. To determine whether the maximum distance between the fiber center and the fiber boundary (maxR) exceeds the design boundary (Figure 3), the maximum distance value of the non-circular fiber shape should be calculated conveniently. The feed-forward neural network (FFNN) method is adopted to establish the function used to predict the maximum distance value based on the geometrical parameters (k, S, R, n).

Illustration for the design domain and max distance value of the fiber shape.
The FFNN consists of a layer of input neurons, a layer of output neurons and one or more layers of hidden neurons 17 (Figure 4). Each hidden layer has a different number of neural elements. Information flows from one layer to the other layers in a feed-forward manner. Neurons in each layer are fully interconnected to preceding and subsequent layer neurons, with each interconnection having an associated connection weight. The network function is largely determined by the connections between the elements. The nonlinear activation function is utilized in the neurons of the hidden and output layers to ensure that the computer simulations are non-linear. To achieve a specific function with the neuron network, the connection weights between the elements need to be trained and adjusted correctly. To obtain the FFNN model for the maximum fiber radius value, 300 groups of geometrical parameters for the non-circular fiber shape are randomly selected and defined as the input parameters of the FFNN model. The corresponding maximum fiber radius (maxR) calculated from the geometrical parameters with equation (4) is set as the output of the FFNN. With the 300 groups of input and output values, the FFNN model can be trained. More details about the FFNN can be referred from Wang and Hang. 18

Schematic description of the FFNN.
Surrogate model for thermal conductivity prediction
To improve the efficiency of the optimization process, a surrogate model for predicting thermal conductivity should be developed. Before introducing the surrogate model for predicting thermal conductivity, the FEM analysis process should be explained. The FEM analysis process relies on the definition of the thermal conductivity. Firstly, the FEM model considering non-circular fiber should be established. Then, specific boundary conditions are applied to the models on the opposite surfaces to establish the thermal gradient (Figure 5). Afterward, the steady temperature distribution in the RVE can be obtained. Finally, the nodal reaction fluxes along a specific boundary where the temperature loading is applied are summed up to calculate the equivalent thermal conductivity.

Illustration for the boundary conditions.
To establish a surrogate model for predicting thermal conductivity, the first step involves utilizing the Monte Carlo method 19 for data collection. It means that the geometrical parameters (k, S, R, n) satisfying the design domain constraint are selected randomly. Then, these parameters are used to predict the corresponding thermal conductivity values with FEM. At last, the Kriging method is adopted to establish the relation between the geometrical parameters and the transverse conductivity values. As an interpolation technique based on mathematical statistical theory, the goal of the Kriging surrogate model is to simulate and predict the unknown information of a specific point using the information from known points. It has good approximation and error estimation capabilities for nonlinear systems. The main feature of the Kriging model is that it does not require a specific parametric mathematical model. More details about the method can be referred from Lu et al. 20 As the geometrical parameter R depends on the parity of k, two surrogate models should be established for odd and even conditions, respectively.
Optimization object and method
In Wang and Hang, 21 it was demonstrated that the fiber shape orientation had a significant impact on the transverse moisture diffusivities. In She et al., 14 it was found that the orientations of the elliptical fiber shape had a significant impact on the transverse thermal conductivities. Thus, in this study, three fiber shape orientations will be considered as shown in Figure 6. This implies that the 0°, 45°, and 90° equivalent thermal conductivities are all set as the optimization objects (equation (5)). A multi-objective genetic optimization method should be adopted here to obtain the optimal parameters of fiber shape.


Models with different fiber shape orientations: (a) 0° model, (b) 45° model, and (c) 90° model.
Multi-objective optimization problems differ from single-objective optimization problems. When there are multiple targets, finding a solution that optimizes all objective functions simultaneously becomes challenging due to conflicts between objectives. NSGA-II 22 is a fast non-dominated multi-objective optimization genetic algorithm based on Pareto optimal solution with an elite retention strategy. 23 It is mainly divided into the following three calculation parts: (1) fast non-dominated sorting of Pareto solution set; (2) calculating crowding degree and comparing crowding degree; (3) cross iteration, survival of the fittest, selecting optimal parameter points with an elite retention strategy. By continuously repeating the above three steps until reaching the target iteration count or convergence condition, the optimal Pareto solution set can be found.
Summary of the optimization process
A summary of the optimization framework is shown in Figure 7. Firstly, by randomly choosing geometrical parameters (k, S, R, n), the corresponding maximum fiber distance value (maxR) can be calculated. Based on these data, the surrogate function for calculating the maximum fiber distance can be established with FFNN. Then, based on the fiber volume fraction, the design domain can be determined and the geometrical parameters that meet the design domain constraints are randomly selected. With the ABAQUS, the equivalent thermal conductivities considering three fiber shape orientations (0°, 45°, 90°) can be obtained for each group of geometrical parameters. With these data, surrogate Kriging models can be established for predicting thermal conductivity based on the geometrical parameters of fiber shape. Thereafter, the multi-objective optimization process is conducted to obtain Pareto solutions with NSGA-II. Finally, the geometrical parameters of the optimal fiber shape can be obtained for a specific fiber volume fraction.

Procedures of fiber shape optimization for a specific fiber volume fraction.
Factor evaluation
Fiber random distribution model
Due to the effects of manufacturing, the positions of the fibers in the composites are randomly distributed. 24 Many studies have shown that the properties predicted by the fiber random distribution models differ from those predicted by the fiber square distribution models.25 –27 To evaluate the coupling effects of fiber shapes and fiber random distribution patterns, models with fiber random distribution patterns should be established. The fiber random distribution model generation processes presented in Wang et al. 6 are adopted in this study. The brief procedures are shown below.
Firstly, the model with fiber square distribution is established with the desired fiber volume fraction. In one iteration, a global crisscrossing of the positions of fibers is conducted to enhance the generation efficiency of the fiber random distribution model. After the global crisscrossing, the moving ranges along two vertical directions are determined and the random perturbation of each fiber position is conducted. Then, a new position for each fiber can be obtained randomly under the conditions that there is non-overlapping between every two fibers. After 100 times iterations in this study, the model with fiber random distribution can be obtained finally. For the models with non-circular fiber shapes, the fiber shape orientation is also set as a random variable, which means that for each fiber, the fiber shape is randomly determined within 0°–360°.
Fiber-matrix thermal conductivity ratio
There have been numerous studies focusing on evaluating the effects of thermal conductivity ratio on the change of equivalent thermal conductivity of composites.28 –30 These studies demonstrate that the ratio of thermal conductivity between the fiber and matrix has a significant impact on the equivalent thermal conductivity of composites. Thus, it is necessary to evaluate the effects of the thermal conductivity ratio on the thermal conductivity values of the non-circular fiber models. In this study, the range of the ratio is set to be between 10−3 and 103 as in Sihn and Roy. 31
Effects of fiber volume fraction
Fiber volume fraction is typically considered an important factor influencing composite properties. 31 The effects of the fiber volume fraction on the optimal fiber shape should be evaluated. It would be time-consuming to adopt the optimization process depicted in Figure 7 to determine the optimal fiber shapes for various fiber volume fractions. In this section, an equivalent optimization process is developed as shown in Figure 8. Firstly, a large design domain should be determined based on its corresponding circular fiber square distribution model. In this study, the fiber volume fraction for determining the design domain is set to be 30% to ensure that the maximum fiber radius generated from all the geometrical parameters is smaller than the design domain. Then, the effects of all non-circular fiber shapes on the equivalent transverse conductivities of models with a 30% fiber volume fraction can be revealed. The Kriging surrogate model is established to predict the thermal conductivity values. At last, the optimal fiber shape for a larger fiber volume fraction can be obtained using the Kriging surrogate model and the constraints imposed by the actual design domain boundary. To demonstrate the optimization process, the fiber shapes will be compared with the results derived from the analysis processes shown in Figure 6 for a 50% fiber volume fraction.

The optimization process for different fiber volume fractions.
Results and discussion
Model verification
Before conducting the optimization process, the numerical method for predicting thermal conductivity should be verified first. The thermal conductivity values of the fiber and matrix are set to be 0.2 and 0.0003 W/mm-K, respectively, which all are referred to Sihn and Roy. 31 Based on the circular fiber model with a 50% fiber volume fraction, the predicted thermal conductivity value is shown in Table 1, The simulation result from Sihn and Roy, 31 the experimental result in Thornburg and Pears. 32 and the result from the analytical model in Ahmadi et al. 33 are adopted to demonstrate the numerical result predicted in this study. The consistency between them demonstrates the effectiveness of the numerical method. The heat flow distribution pattern along the loading direction is shown in Figure 9. It can be found that since the thermal conductivity of the fiber is much larger than that of the matrix, the fiber primarily facilitates heat transfer.
Transverse thermal conductivities with the numerical method (W/mm-K).


Heat flux distribution pattern of the model with circular fiber.
Fiber shape optimization
To predict the maximum distance between the fiber center and fiber boundary, an FFNN model is developed here. 300 groups of the geometrical parameters are randomly selected and set as the input for the FFNN. The corresponding maximum distance values are set as the output. Among them, 70% of samples are used for training, 15% for validation and 15% for testing. Ten hidden neurons are adopted for the training. The performance of the established FFNN model is shown in Figure 10. It can be found that the maximum distance value can be accurately predicted with the established model.

performance of the trained FFNN: (a) training, (b) validation, and (c) testing.
With the FFNN model, 300 groups of geometrical parameters that meet the constraints of the design domain are randomly generated. The 0°, 45°, and 90° non-circular fiber models established with the specific geometrical parameters are analyzed to determine their respective thermal conductivity values. With the 300 groups of geometrical parameters and corresponding thermal conductivity values along three different directions, surrogate models are established for each fiber orientation using the Kriging method. For the models with fiber orientation equaling 0°, the performance of the corresponding surrogate model is shown in Figure 11. It can be found that the thermal conductivity can be accurately predicted with the surrogate model. It should be noted that as the number of design parameters varies for odd and even k values, distinct surrogate models should be utilized for each condition.
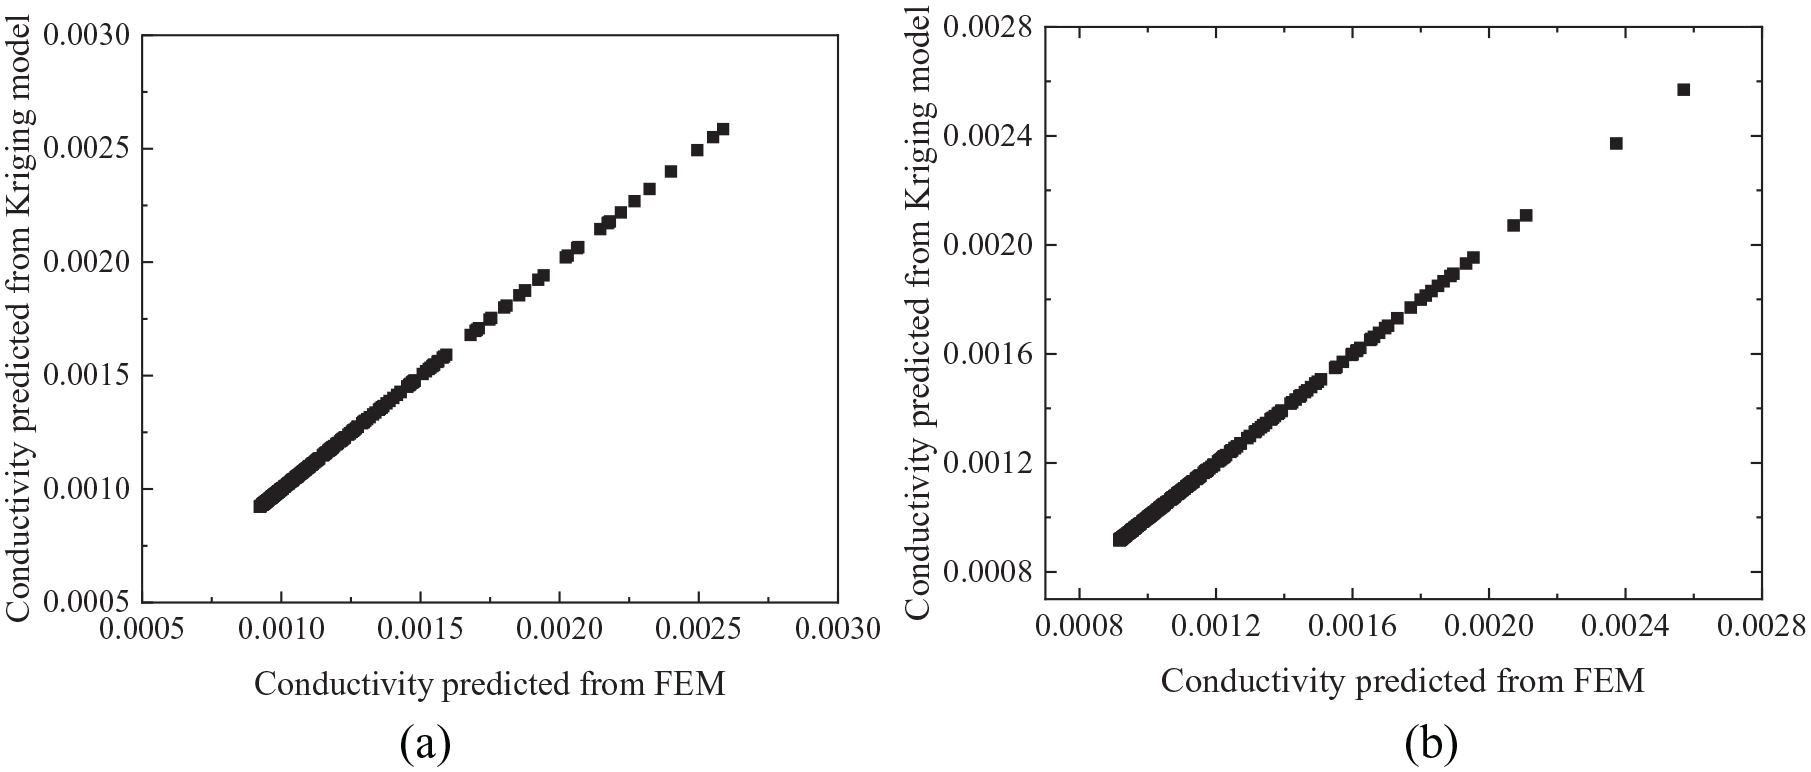
performance of the surrogate model: (a) k is even and (b) k is odd.
With the NSGA-II multi-objective optimization method, the optimization analysis is conducted. When the k is even, the Pareto front solutions are shown in Figure 12. With the Kriging method, the model with the highest thermal conductivity along 0° can be obtained and the corresponding geometrical parameters are 2, 0.7, 1, 4.3 for k, S, R, n, respectively. The models with the fiber shape are shown in Figure 13 and the fiber shape is named as ellipse-like shape. Along 0°, 45°, and 90°, the thermal conductivity values are 0.002785, 0.0010355, and 0.0006661 W/mm-K, respectively. The effects of the fiber shape orientation are clearly illustrated. Compared with the circular fiber model, there is a 202.7% increase in the 0° thermal conductivity. However, there is a 27.6% decrease in the 90° thermal conductivity. From the heat flux distribution patterns along the transverse loading direction (Figure 14), it can be found that when the fiber shape aligns with 0°, the fiber acts as a bridge for heat transfer, 34 which results in a significant increase in thermal conductivity. On the contrary, for the 90° fiber, the fiber boundary is far away from the loading boundary, which results in a decrease in the thermal conductivity along the loading direction.

Pareto-optimal front of three objectives when the k is even.

Models with ellipse-like shape fibers: (a) 0° model, (b) 45° model, and (c) 90° model.

Heat distribution patterns for models with ellipse-like shape fibers: (a) 0° model, (b) 45° model, and (c) 90° model.
Based on the Pareto front solutions and Kriging model, the fiber geometrical parameters that contribute to the maximum value of the sum of 0°, 45°, and 90° models’ thermal conductivities can be obtained. The four geometrical parameters are 8, 1.1, 0.8, and 2.5, respectively and the corresponding models are shown in Figure 15. The fiber shape is named as square-like shape. The thermal conductivities along three directions are 0.0024734, 0.001135, and 0.002478 W/mm-K. Although both conductivity values along 0° and 90° are increased significantly, the degree of increase along the 45°direction is small. From the heat flux distribution patterns (Figure 16), it is believed that the increase induced by the 0° fiber also results from the heat bridge effects. 34 However, the fiber regions near the loading boundary are fewer than those in the ellipse-like shape fiber model. Thus, the degree of increase is less than that of the 0° ellipse-like shape fiber model.
Models with square-like shape fibers: (a) 0° model and (b) 45° model.
Heat distribution patterns for models with square-like shape fibers: (a) 0° model and (b) 45° model.
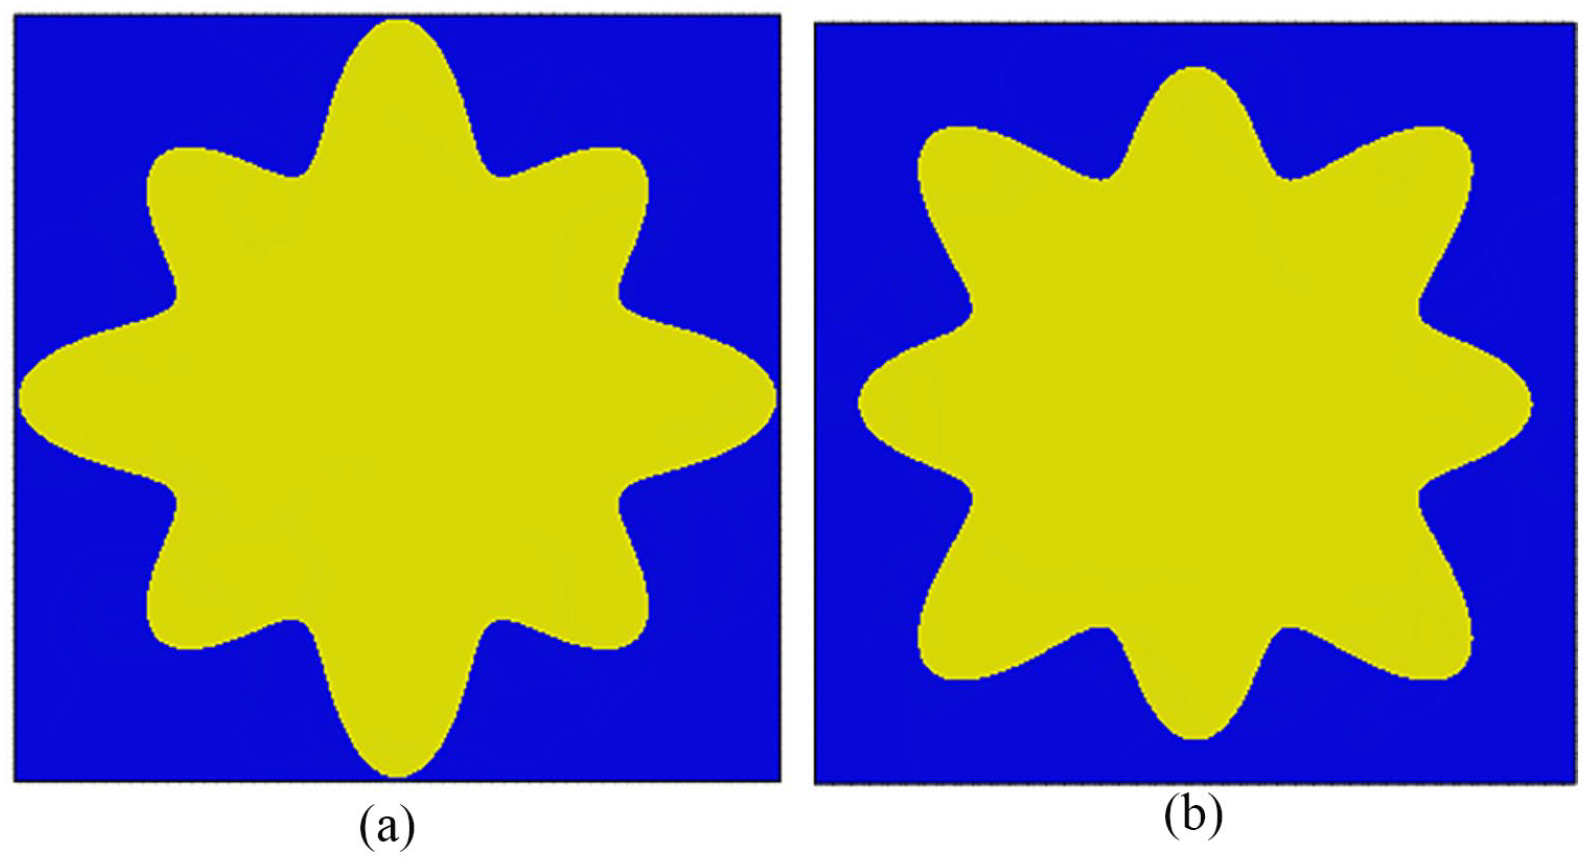
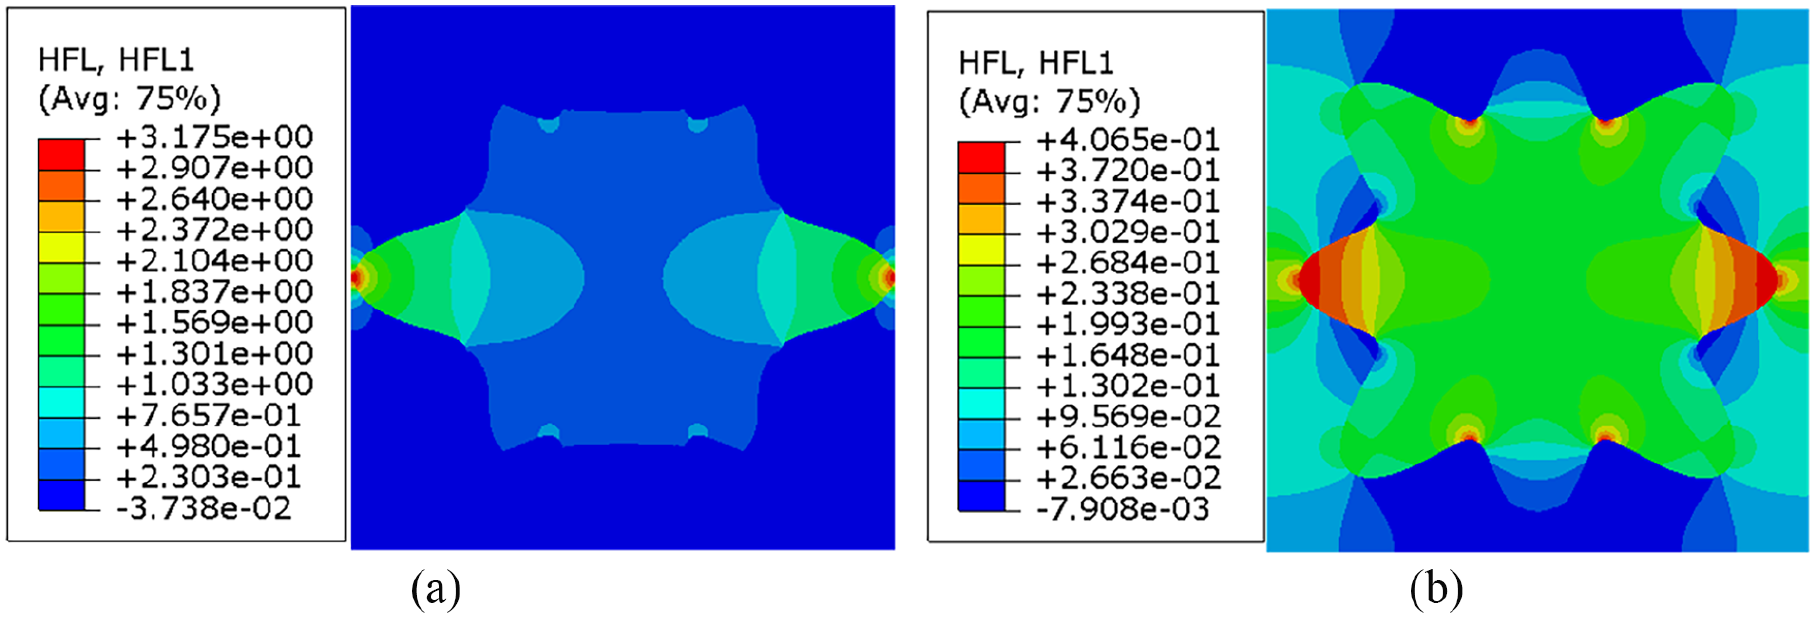
If k is an odd number, only one solution is obtained in the Pareto front solution group (Figure 17). The four geometrical parameters are 9, 1.9, 1, and 2.6. The established models are shown in Figure 18 and the fiber shape is named as gear shape. The predicted thermal conductivities are 0.002570, 0.002286, and 0.002150 W/mm-K. Compared with the result from the circular fiber model, the thermal conductivities along all three directions have significantly increased. Based on the heat flux distribution patterns obtained along various fiber shape orientations (Figures 14, 16, and 19) and the thermal conductivity values presented in Table 2, it can be concluded that as the symmetry axis number increases, the influence of fiber shape orientation diminishes. Furthermore, it can be deduced that an increase in lobe amplification leads to higher thermal conductivities along the direction of the lobe. A larger symmetry axis number, k, and a larger lobe amplification will lead to a simultaneous enhancement of thermal conductivity along different directions.

Pareto-optimal front of three objectives when the k is odd.

Optimal fiber shape with gear fiber: (a) 0° model, (b) 45° model, and (c) 90° model.

Heat distribution patterns for models with gear shape fibers: (a) 0° model, (b) 45° model, and (c) 90° model.
Transverse thermal conductivities predicted from the models (W/mm-K).

To further elucidate the effects of fiber shape orientation on the equivalent thermal conductivity, models with additional orientation values are analyzed and the results are presented in Figure 20. It can be found that the orientation of fiber shape is crucial for the thermal conductivity behavior of the non-circular fiber model. The results of the gear shape models illustrate the importance of the symmetry axis number and lobe amplification of the fiber shape. Based on the predicted values, the average thermal conductivities for the ellipse-like fiber, square-like fiber and gear fiber models are 0.001353, 0.001591, and 0.00236 W/mm-K, respectively. Compared with the circular fiber model, the increase percentages are 47%, 92.9%, and 156.5% for ellipse-like fiber, square-like fiber, and gear fiber models, respectively.

Thermal conductivities for models with different fiber shape orientations.
To demonstrate the benefits of the optimized fiber shape, the ideal square and elliptical fiber models are analyzed (Figure 21). The thermal conductivity of the 0° square fiber model (0.000936 W/mm-K) is very similar to that of the circular fiber model. This conclusion is the same as that obtained in Hassanzadeh-Aghdam et al. 10 When the fiber shape is rotated by 30°, a 46.37% increase in thermal conductivity can be achieved. The effects of the fiber shape orientation are ignored in Hassanzadeh-Aghdam et al. 10 For the ideal elliptical fiber, the minimum distance between the fiber boundary and the loading boundary is set to be the same as that in the ellipse-like shape fiber model. The obtained transverse thermal conductivity value of the model with 0° elliptical fiber is 0.00264 W/mm-K. The thermal conductivity is very close to that of the ellipse-like fiber model. The heat flux distribution patterns are also shown in Figure 21. It can be found that the distribution patterns of the ideal elliptical fiber model are also very close to that of the optimized ellipse-like fiber model. However, the fiber region of the ideal elliptical fiber close to the loading boundary is smaller than that of the optimized ellipse-like fiber. As a result, the thermal conductivity of the ideal elliptical fiber shape model is slightly lower.

Heat flux distribution patterns for models with ideal fiber shapes: (a) 0° square fiber model, (b) heat flux distribution pattern of 0° square fiber model, (c) 30° square fiber model, (d) heat flux distribution pattern of 30° square fiber model, (e) 0° elliptical fiber model, and (f) heat flux distribution pattern of 0° elliptical fiber model.
Effects of fiber distribution patterns
The fiber random distribution models with the obtained non-circular fiber shapes are established and analyzed here. In the models with non-circular fibers, the fiber orientation is also set as a random variable and examples for each fiber shape are shown in Figure 22. The predicted thermal conductivities are shown in Table 3. It can be found that the sorting of the average values is consistent with that from the fiber square distribution models. Furthermore, the average value for each fiber shape is very close to the average value calculated from Figure 20 considering different fiber shape orientations. The heat flux distribution patterns are shown in Figure 23. It can be found that for the circular fiber model, the random distribution patterns of circular fibers can hardly form the heat bridge. 34 Due to the consideration of the fiber shape orientation, the length of the heat bridge of the ellipse-like shape fiber model is much shorter than that of the gear shape fiber model. This should be the reason why the thermal conductivity of the gear fiber random distribution model is the largest.

Fiber random distribution models with different fiber shapes.
Thermal conductivities of models with different fiber random distribution patterns and fiber shapes (W/mm-K).


Heat flux distribution patterns for fiber random distribution models: (a) circular fiber model, (b) ellipse-like fiber model, (c) square-like fiber model, and (d) gear fiber model.
Effects of the ratio between fiber and matrix
The three optimal fiber shapes are adopted here to investigate the coupling effects of non-circular fiber shape and fiber-matrix thermal conductivity ratio on the equivalent transverse thermal conductivity of composites. Different fiber shape orientations are considered and the results from the circular fiber models are also presented in Figure 24. It can be found that the thermal conductivity can be increased by the non-circular fiber shape only if the fiber-matrix conductivity ratio is larger than a critical value. For each non-circular fiber shape, the effects of the fiber shape orientation are also apparent only when the fiber-matrix conductivity ratio exceeds a critical value. The critical value for the model with gear shape fibers is the largest, followed by the model with square-like shape fibers and the smallest is the model with ellipse-like shape fibers. This trend is opposite to the degree of dependence of thermal conductivity on fiber shape orientation for each fiber shape.

Normalized transverse thermal conductivity: (a) ellipse-like fiber, (b) square-like fiber, and (c) gear fiber.
If the ratio of thermal conductivity between the fiber and matrix is less than 1, the matrix plays a more significant role than the fiber in heat transfer. It can be proven by the heat flux distribution patterns of the model with ellipse-like shape fibers as shown in Figure 25. From Figure 24, it can be found that when the matrix thermal conductivity is larger than fiber thermal conductivity, the non-circular fiber shapes have less impact on the equivalent thermal conductivities compared to the situation when the fiber conductivity is larger than matrix conductivity.

Heat distribution patterns when the ratio equaling 10−3: (a) 0° model, (b) 45° model, and (c) 90° model.
Effects of fiber volume fraction
To obtain the optimal fiber shape for any fiber volume fraction, the effects of fiber shape on the thermal conductivity within a larger design domain are analyzed and a surrogate model is established. To achieve the large design domain, the fiber volume fraction is set to be 30%. In this section, k is set to be odd for simplification. The optimal fiber shapes for fiber volume fractions of 30%, 40%, 50%, 60%, and 70% are shown in Figure 26 and the corresponding geometrical parameters are shown in Table 4. Especially for the condition with a 50% fiber volume fraction, the geometrical parameters obtained from the optimization process are the same as those obtained in the section above. This demonstrates the effectiveness of the method for deriving the optimal non-circular fiber shape for various fiber volume fractions.

Optimal fiber shape for different fiber volume fractions with an odd k: (a) 30%, (b) 40%, (c) 50%, (d) 60%, and (e) 70%.
Geometrical parameters for the obtained fiber shapes.

From Figure 26, it can be found that for the models with a 30% fiber volume fraction, the boundary of the optimal fiber shape is far away from the loading boundary, which should be attributed to the extensive design domain. When the fiber volume fraction exceeds 40%, the fiber boundary is very close to the boundary of the design domain. Besides, it can be found that the k values of the optimal fiber shapes are all 9, which demonstrates the necessity of the symmetric axis. With the increase of the fiber volume fraction, the geometrical parameters S and n generally decrease. The decrease of the S and n results in the decrease of the lobe amplification and the fiber shape becomes more similar to a circular fiber shape.
The predicted thermal conductivities of the models along different fiber shape orientations are shown in Table 5. Compared with the circular fiber models, the increasing percentage of thermal conductivity is also calculated. It can be found that when the fiber volume fraction is larger than 40%, the increasing percentage decreases with the increase of fiber volume fraction. Especially when the fiber volume fraction is 70%, the increasing percentage of thermal conductivity is the smallest.
Transverse conductivities of models with optimal fiber shapes for different fiber volume fractions (W/mm-K).

Conclusion
An optimization framework is developed in this study to obtain the optimal fiber shape that will result in the increase of transverse thermal conductivity within a large group of fiber shapes. The framework is composed of the FFNN model, the Kriging surrogate model and the NSAG-II optimization method. With the framework, the optimal fiber shapes are obtained and the effects of fiber volume fraction, fiber-matrix conductivity ratio and fiber volume fraction are also revealed. The following conclusions can be made:
When the fiber volume fraction is set to be 50%, the optimal fiber shapes including ellipse-like, square-like and gear shapes are selected. A more than 100% increase in thermal conductivities can be achieved with gear fiber compared with that of the circular fiber model. The thermal conductivities of models with gear fiber are nearly isotropic compared with the other two non-circular fiber shapes. This results from the larger symmetry axis number and lobe amplification. The increase in lobe amplification results in the increase of thermal conductivity along the lobe’s direction. With a larger symmetry axis number, the thermal conductivity values are nearly isotropic.
After considering the fiber random distribution patterns, the average value of the gear fiber models is the largest compared with the other two non-circular fiber shapes. The average value for each fiber shape is close to that from the models with different fiber shape orientations. A longer heat bridge can be generated in the model with gear fibers due to the larger symmetry axis number and lobe amplification, which results in the largest thermal conductivity value.
The thermal conductivity can be improved by the non-circular fiber shapes significantly only when the fiber-matrix thermal conductivity ratio is larger than a critical value. The critical values are different for each fiber shape and are dependent on the influences of fiber shape orientation on the equivalent thermal conductivities. When the matrix thermal conductivity is larger than the fiber thermal conductivity, the matrix plays the main role in heat transfer and the effects of the fiber shape become less.
The effects of the fiber volume fraction on the optimal fiber shape are also revealed. From the obtained fiber shapes, it is found that with the increase of the fiber volume fraction, the optimal fiber shape becomes more similar to the circular fiber shape and the increasing degree of thermal conductivities induced by the non-circular fiber shape decreases.
Footnotes
Data and code availability statement
The data presented in this study are available on request from the corresponding author.
Declaration of conflicting interests
The author(s) declared no potential conflicts of interest with respect to the research, authorship, and/or publication of this article.
Funding
The author(s) disclosed receipt of the following financial support for the research, authorship, and/or publication of this article: This study was funded by the Fundamental Research Funds for the Central Universities (2021QN1024) and The Natural Science Foundation of Jiangsu Province (BK20210487).
Ethical approval
Not applicable.