
Abstract
This article investigates the mechanical properties of cementitious repair mortars modified with styrene-butadiene rubber (SBR) at dosages of 5% and 10% by weight of cement. It includes an analysis of flexural strength (FS) and compressive strength (CS), as well as transport properties such as total shrinkage (SR) and water absorption (WA). Glass fibers (GF) were added to these mortars at rates of 0.1%, 0.3%, and 0.5% of the total volume to reinforce them. A factorial design was employed in numerical modeling to study the effects of different SBR and GF levels on the physical and mechanical properties of the repair mortars. An analysis of variance (ANOVA) was conducted to determine the significance of the factors and their interactions on the selected responses. Digital Image Correlation (DIC), using GOM software, was used to measure and quantify deformations and movements. The findings reveal that polymer mortars reinforced with glass fibers exhibit greater resistance to bending and compression than polymer mortars without fibers. Furthermore, fiberglass-reinforced mortars demonstrate good dimensional stability over time with respect to total shrinkage. Moreover, the developed mathematical models yield efficient prediction equations for FS, CS, SR, and WA by considering SBR content and fiberglass levels. DIC provides a highly effective numerical representation of stressed areas, locations of crack initiation, fracture mechanisms, and crack propagation. The repair mortar exhibits strong adhesion to concrete exposed to high temperatures.
Keywords
Introduction
The use of polymer-based repair mortars is increasing significantly in the construction industry due to their ability to effectively restore damaged concrete structures. 1 These mortars offer multiple advantages, such as high mechanical strength, excellent weather resistance, strong adhesion, and low water permeability.2,3
Studies on this topic indicate that polymers used fall into different categories depending on the monomers utilized in their production. Acrylic polymers and styrene-butadiene rubber copolymers (SBR) are among the predominant types identified in the literature.4 –7 The selection of the latex type is based on the specific attributes required for the intended application.7,8 Li et al. 9 found that adding SBR latex to cement mortars in varying amounts (up to 20% by weight of the cement) exhibits favorable characteristics in terms of compressive and flexural strength, as well as capillary absorption, compared to mortars based on styrene–acrylic ester (SAE) and polyacrylic ester (PAE) latex.
Furthermore, various studies10,11 have examined the impact of SBR rates (2%, 5%, 10%, 15%, and 20%) on the compressive and flexural strength of cement-based mortars at different time points (1, 7, 28, and 90 days). It was observed that at an early stage (1 and 7 days), no amount of SBR dosage improved the mortar’s strength compared to the control mortars without resin. However, at longer terms (28 and 90 days), the SBR-modified mortar exhibited improved flexural strength compared to the control mortar. In terms of compressive strength, a decrease of approximately 5%–21% was observed in the mortar containing SBR latex at 28 days of age compared to the control mortar.
Several research studies have indicated that the incorporation of polymers has a minor impact on compressive strength and, in certain cases, may even lead to a decrease.3,12 –14 Shi et al. 15 suggest that this reduction in compressive strength is caused by increased air content in the polymer-modified mortars resulting from the polymer addition, as also proposed by Guo et al., 12 and Ukrainczyk and Rogina. 16
Additionally, cement mortars containing polymer modifications often display brittle characteristics, leading to relatively poor crack growth resistance.2,17,18 Moreover, the phenomenon of shrinkage is an important aspect in repair mortars, as emphasized by researchers.12,19,20 Yeon et al. 21 have demonstrated that resin particles or films can partially occupy certain capillary pores, thereby helping to reduce shrinkage during the drying process.
To enhance the static modulus of elasticity, flexural modulus, and compressive strength of SBR-based materials, recent research has focused on incorporating inorganic fibers into the polymer matrix to modify the mechanical properties of SBR-based composites.22 –28 Studies conducted by Xu et al. 29 and Yang et al. 30 have shown that incorporating 1% of polypropylene fibers and 20% of SBR latex into cementitious mortar can substantially enhance the flexural strength, brittleness index, and abrasion resistance. Xu et al. 29 explain that the polymer matrix can effectively bond with the fibers as thin polymer films gradually fill the gaps between the composite particles over time. This, in turn, results in improved tensile strength and toughness in polymer-modified mortars. Ashraf et al. 31 concluded that 4% of SBR latex and 0.5% of polypropylene fibers with a larger aggregate size enhance impact load resistance. Furthermore, researches performed by Moreira et al., 17 Cakir17, 18 Nunes and Reis, 32 had shown that the inclusion of glass fibers increases flexural and compressive strengths in polymer mortars by 10% and 8%, respectively. Finally, the observations of Shafei et al. 33 indicate that adding glass fibers imparts a more ductile mode of rupture to polymer mortars. Rashidi and Sharifzadeh 34 and Saidi et al. 35 have corroborated these results.
The Digital Image Correlation (DIC) system is a modern, highly precise, and user-friendly method in the field of engineering. It allows for the comprehensive assessment of the mechanical deformation of various elements without the need for physical contact. Recently, numerous researchers have employed this tool to analyze the mechanical performance of concrete structural elements.36 –39 For instance, Abbassi and Ahmad 40 employed the 3D-DIC method to examine the compression behavior of rubber-based concrete structures during deformation. They noted that this system enabled crack detection, tracking of failure mechanisms, analysis of crack propagation, and the identification of critical strain values.
Determining the optimal formulation of a product is a complex task dependent on various parameters. This complexity can be streamlined through the use of statistical experimental design and analysis procedures. Among the array of available methods, factorial design stands out. Factorial design is an experimental testing method that enables the study of the impact of multiple factors on a given response.41,42 It is based on ANOVA, which is a statistical method that analyzes experimental test data and identifies factors that have a significant effect on the response. 43
Numerous studies in the literature have primarily examined the isolated experimental effects of introducing SBR and/or glass fibers in cementitious mortars. However, research that concentrates on the application of the numerical factorial design method to assess the influence of various factors (SBR and glass fiber dosages) and their interactions on the mechanical and physical properties of SBR-modified cement mortar is relatively scarce in existing literature.
This study emphasizes the utilization of factorial design principles, taking into consideration factors such as SBR dosage (0%, 5%, and 10%) and the rate of glass fibers (0%, 0.1%, 0.3%, and 0.5%), to analyze their effects on the compressive and flexural strengths, water absorption, and shrinkage of the mortar at 28 days of age. Additionally, microstructural observations using Scanning Electron Microscopy (SEM) were conducted to assess the adhesion between the fibers and the different matrices. Furthermore, Digital Image Correlation (DIC) was employed to define the failure modes and deformations of concrete subjected to high temperature and repaired using the most suitable mortar identified in this study.
The principal objective of this scientific investigation is to develop predictive models that can assist researchers in predicting the performance of SBR-modified cement mortar based on SBR and GF dosages, thus eliminating the necessity for numerous and labor-intensive experiments.
Materials and equipment
Characterization of raw materials
In this study, we employed Portland cement CEM I 42.5 and utilized silica fume as a cement additive. The chemical composition and physical properties of these materials can be found in Table 1.
Chemical and physical properties of cement and silica fume.

To enhance the mixture, we introduced glass fibers measuring 1.5 cm in length (refer to Figure 1). Table 2 contains detailed information about the physical, chemical, and mechanical properties of the glass fibers.

Image depicting the glass fibers.
Physical, chemical, and mechanical properties of GF.

Regarding the sand, we utilized grade 0/4 silico-limestone sand, which has a density of 2680 kg/m3 and a sand equivalent coefficient of 86%.
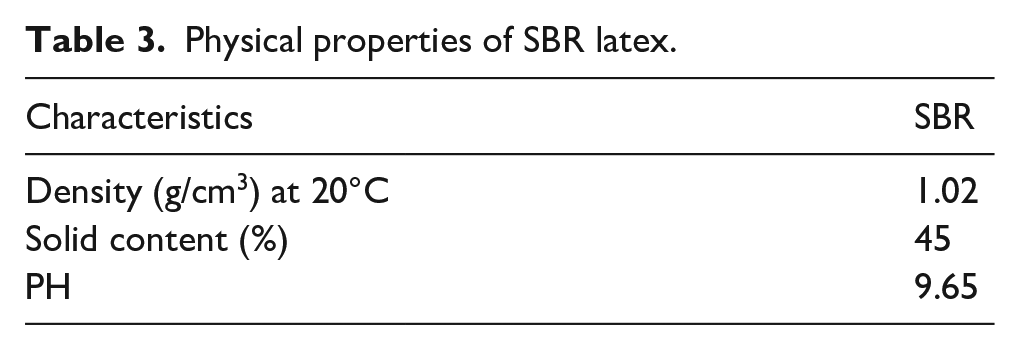
For enhancing specific properties, we integrated a styrene-butadiene rubber (SBR) latex polymer. The physical and chemical specifications of this SBR latex polymer are summarized in Table 3.
Physical properties of SBR latex.
Composition of various mixtures
This experimental study aimed to incorporate different quantities of glass fibers (0%, 0.1%, 0.3% and 0.5% by total volume of mortar) into mortar mixes containing various levels of dry latex SBR (Styrene-Butadiene) extract: 0%, 5%, and 10% by weight. The ratio of binder to sand (B/S) used was 1:3 by weight. For the polymer-modified mortars, the water/binder (W/B) ratio in the reference mixes was 0.5. However, for the polymer-modified mortars, this W/B ratio was adjusted by reducing the water content based on the existing content of latex SBR.
The fiber-modified mortar mixes were prepared according to the EN 196-1 standard. 44 To assess the mechanical and physical attributes, the molds with the mortar mixtures were wrapped in plastic and kept in the lab. The samples were removed from the molds after 24 h and then submerged in water for 6 days at 20 ± 3°C. After that, the samples were kept in open air at 20 ± 3°C and 55 ± 10% relative humidity until testing at 28 days, as per the curing method suggested by Jo 45 and Benali and Ghomari. 11
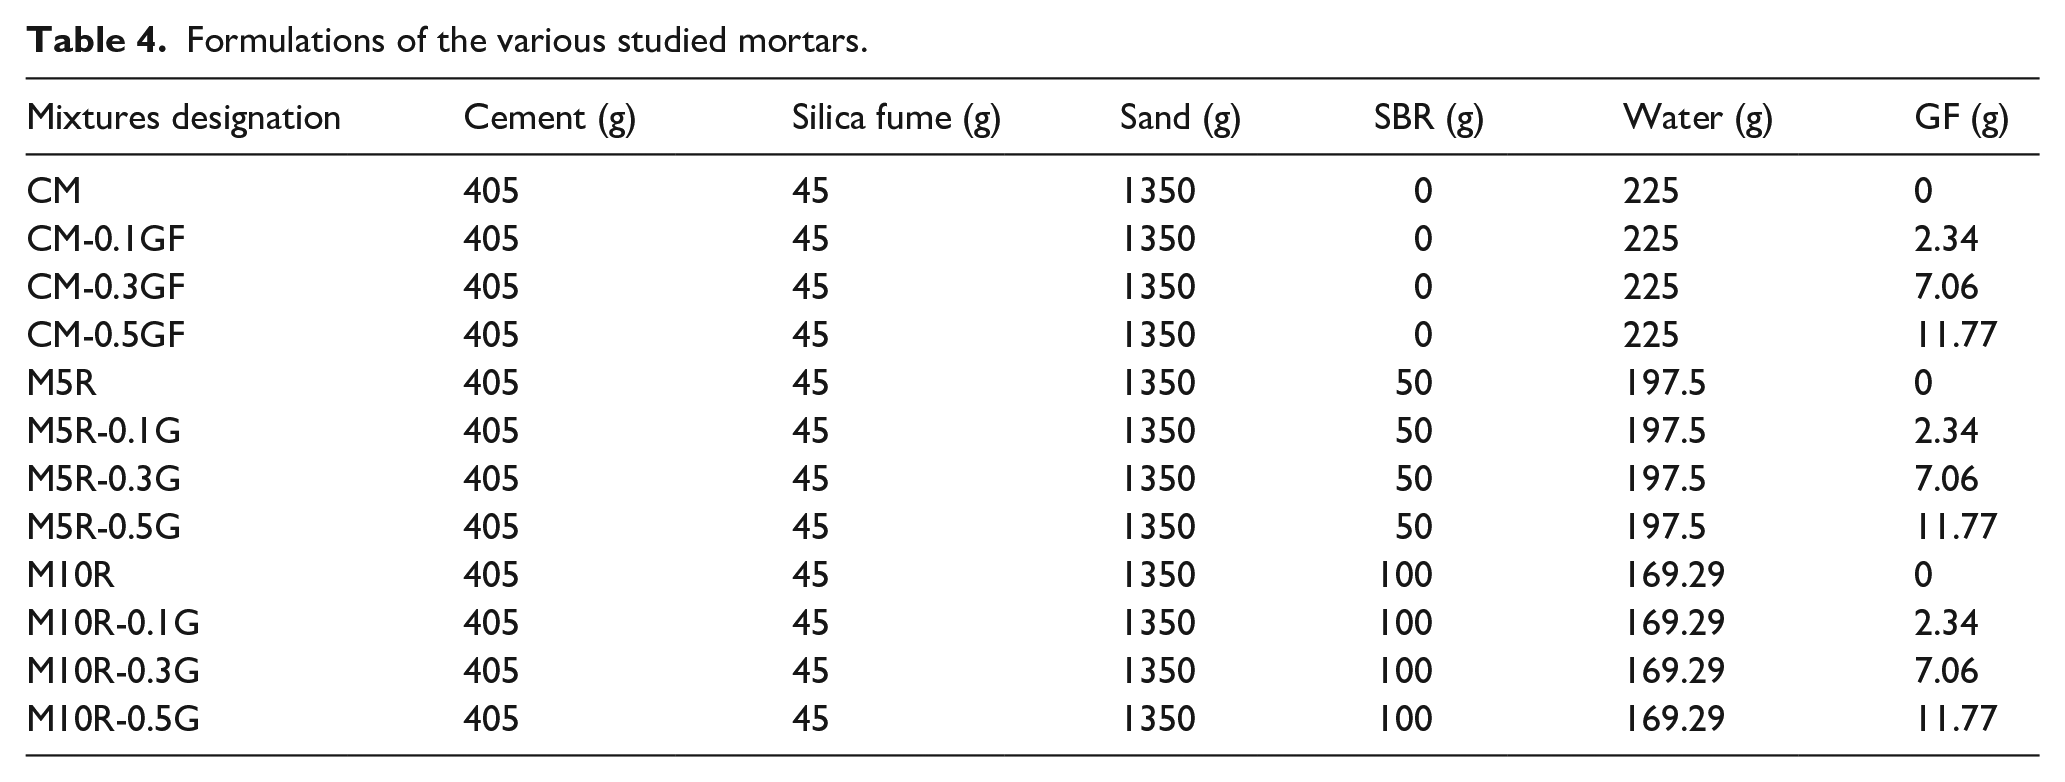
The different formulations of the mortars performed are illustrated in Table 4.
Formulations of the various studied mortars.
Experimental tests
The compressive and flexural strength tests utilized a 3000 KN capacity machine per standard EN 196-1. 44 The 40 mm × 40 mm × 160 mm molds held samples cured for 28 days before testing. Four samples of each mix were tested, with the average strength representing the ultimate flexural and compressive strength.
The water absorption of the specimens was evaluated after 28 days of curing according to the European standard EN 13057 46 after 28 days of curing. For the test, three identical samples per mixture were dried at 100°C to constant mass and subsequently submerged in water for 24 h to fully saturate. Subsequently, the specimens were carefully wiped clean, and the mass variation was measured under saturated surface dry conditions.
The shrinkage of each mixture was evaluated using prismatic test specimens with dimensions of 40 mm × 40 mm × 160 mm, measured longitudinally. The measurements were taken using a refractometer with an accuracy of ±0.001 mm. The samples were maintained at 20 ± 2°C and 55% ± 5% relative humidity in open air.
In order to repair concrete that has been damaged due to high temperatures exposure (750°C), the most effective polymer mortar that provides strong adhesion resistance was used.
After retrieving the intact section of concrete, it is placed within a 150 mm × 150 mm × 150 mm mold. Next, the prepared repair mortar is introduced into the mold, as depicted in Figure 2. Once the repair process concludes, the mended specimens will undergo an open-air curing period lasting up to 28 days.
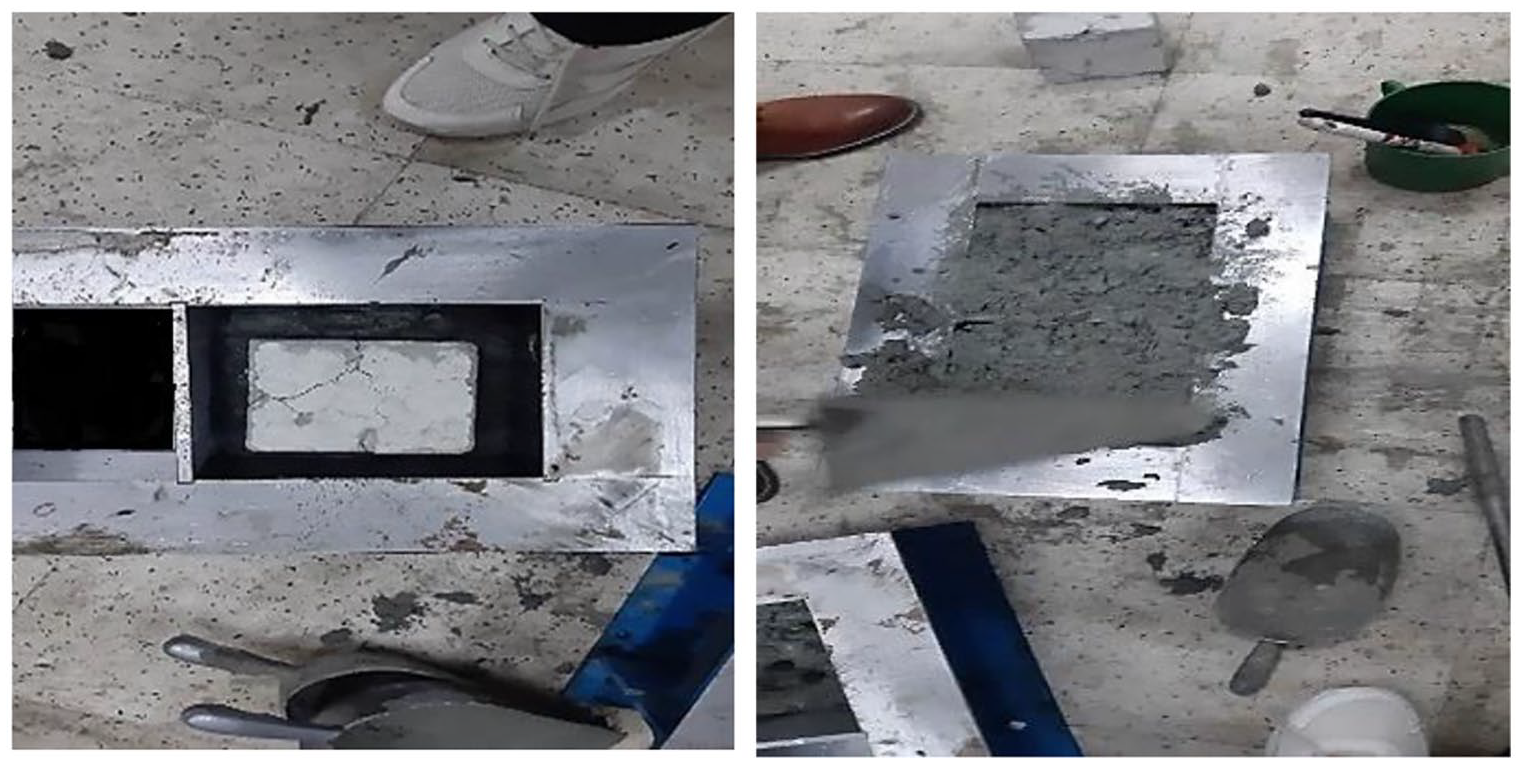
Method for repairing concrete exposed to high temperatures.
Numerical modeling
The full factorial design represents an incredibly valuable statistical technique for analyzing empirical findings, as it enables an optimal and precise assessment of the effects and interactions among different variables, denoted as “xi” factors, and the responses, referred to as “Y.” By employing this comprehensive factorial analysis approach, it becomes feasible to establish an empirical mathematical model, enhance and optimize the process factors, while carefully examining their interrelationships. 47
An experimental factorial design was utilized here to assess the physical and mechanical attributes of repair mortars. The aim was investigating the impact of fiberglass content and SBR dry extract on compressive strength, flexural strength, water absorption, and total shrinkage. The factors and interactions were analyzed using ANOVA.41,42 The results were then evaluated and examined using JMP16 software.48,49 Moreover, a mathematical equation employing a second-order model with a two-factor interaction was employed, and it can be presented as follows:

In this equation, Y represents the predicted response, where β0 denotes the constant coefficient for offset terms. A and B pertain to the independent factors, with B representing the fiberglass content (%) and A indicating the SBR content (%), respectively. The coefficients β1 and β2 represent the linear effects of these factors, while β12 signifies the coefficient for the interactions between them.
Digital Image Correlation (DIC) using GOM software (Free version) refers to a method used to measure and quantify deformations, movements, or shape changes of an object based on the analysis of variations in digital images. 36 Figure 3 illustrates the device for digital image analysis. Furthermore, Figure 4 provides a summary of the various tests used in this paper.

Image correlation device.
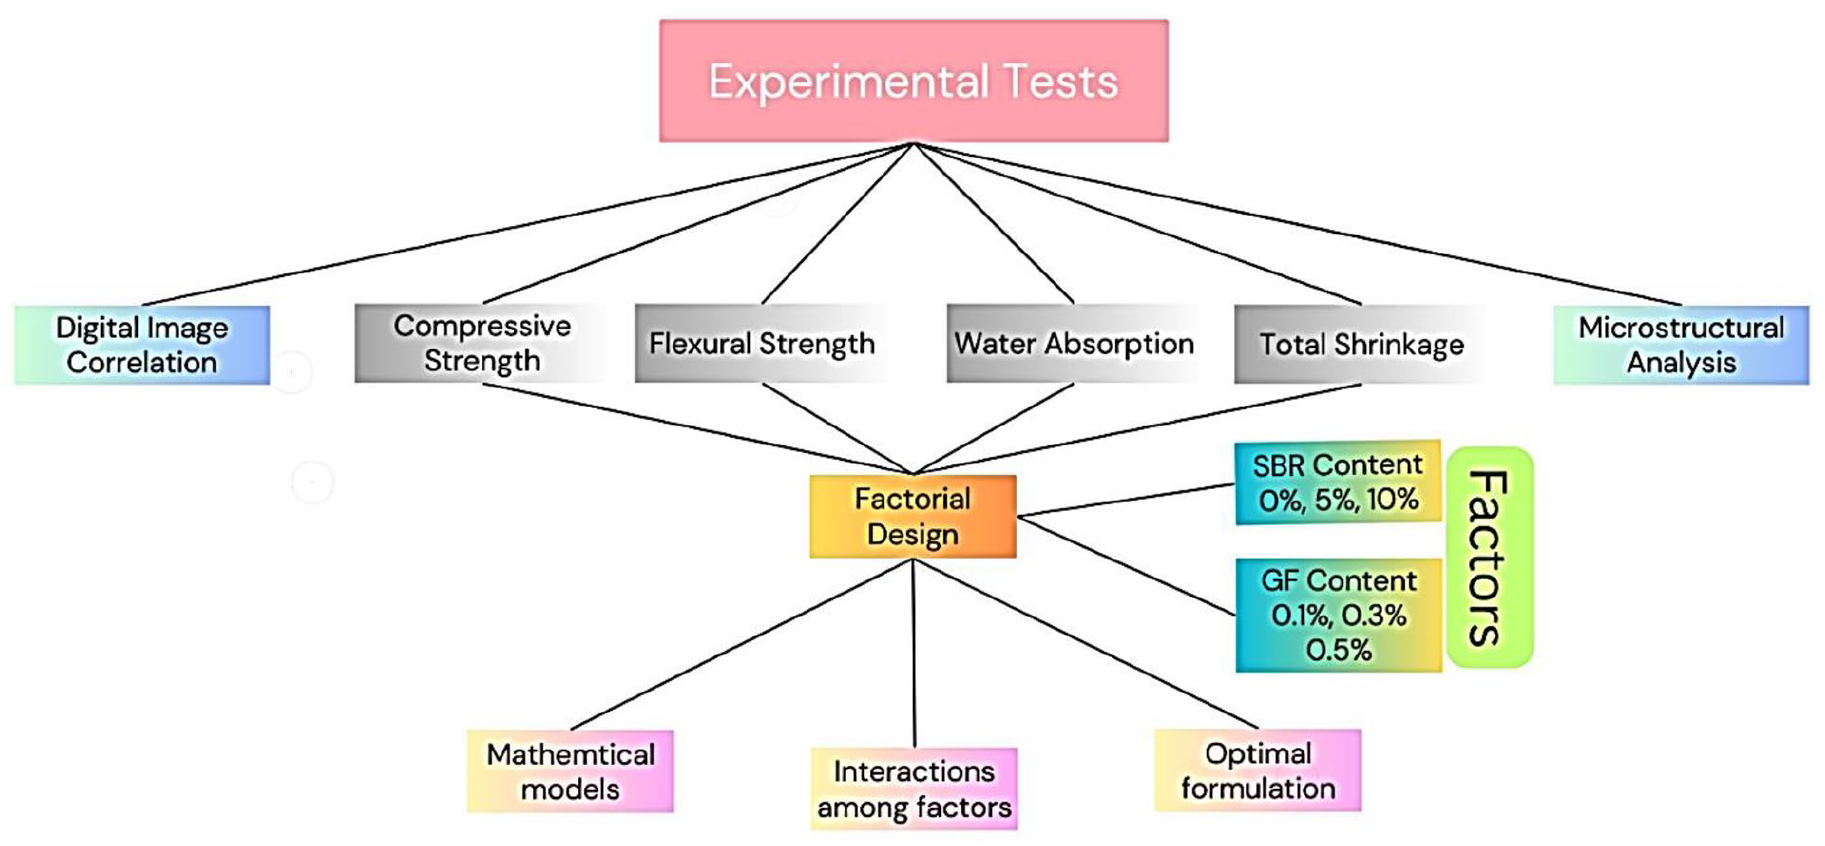
Organizational chart of the various tests used.
Results and discussion
The statistical analysis of mortar with SBR resin
Analysis and results of variance model
A statistical test called analysis of variance was conducted to determine the impact of different factors on the observed results., as shown in Table 5. The models developed in this study demonstrated high correlation coefficients, ranging from 0.89 to 0.95, indicating a strong and reliable relationship between the experimental results and the model predictions.
Summary of fit.

Consequently, it can be reasonably inferred that the developed models effectively predict the impact of fiberglass and SBR resin on the mechanical and physical properties of SBR-modified mortars. Moreover, these models facilitate the generation of iso-response curves based on different factors.
Furthermore, Table 6 presents the analysis of variance (ANOVA) for all the numerically modeled responses. The significance of the developed models was assessed using the Fisher test distribution. With a confidence level of 90%, the Fisher ratios for FS28, CS28, WA28, and SH were 44.51, 27.52, 25.79, and 15.21, respectively, signifying a substantial level of significance. Moreover, the probability values (Prob.> F) for all models were below 5%, confirming the existence of at least one significant factor within each model.
ANOVA results for developed models.

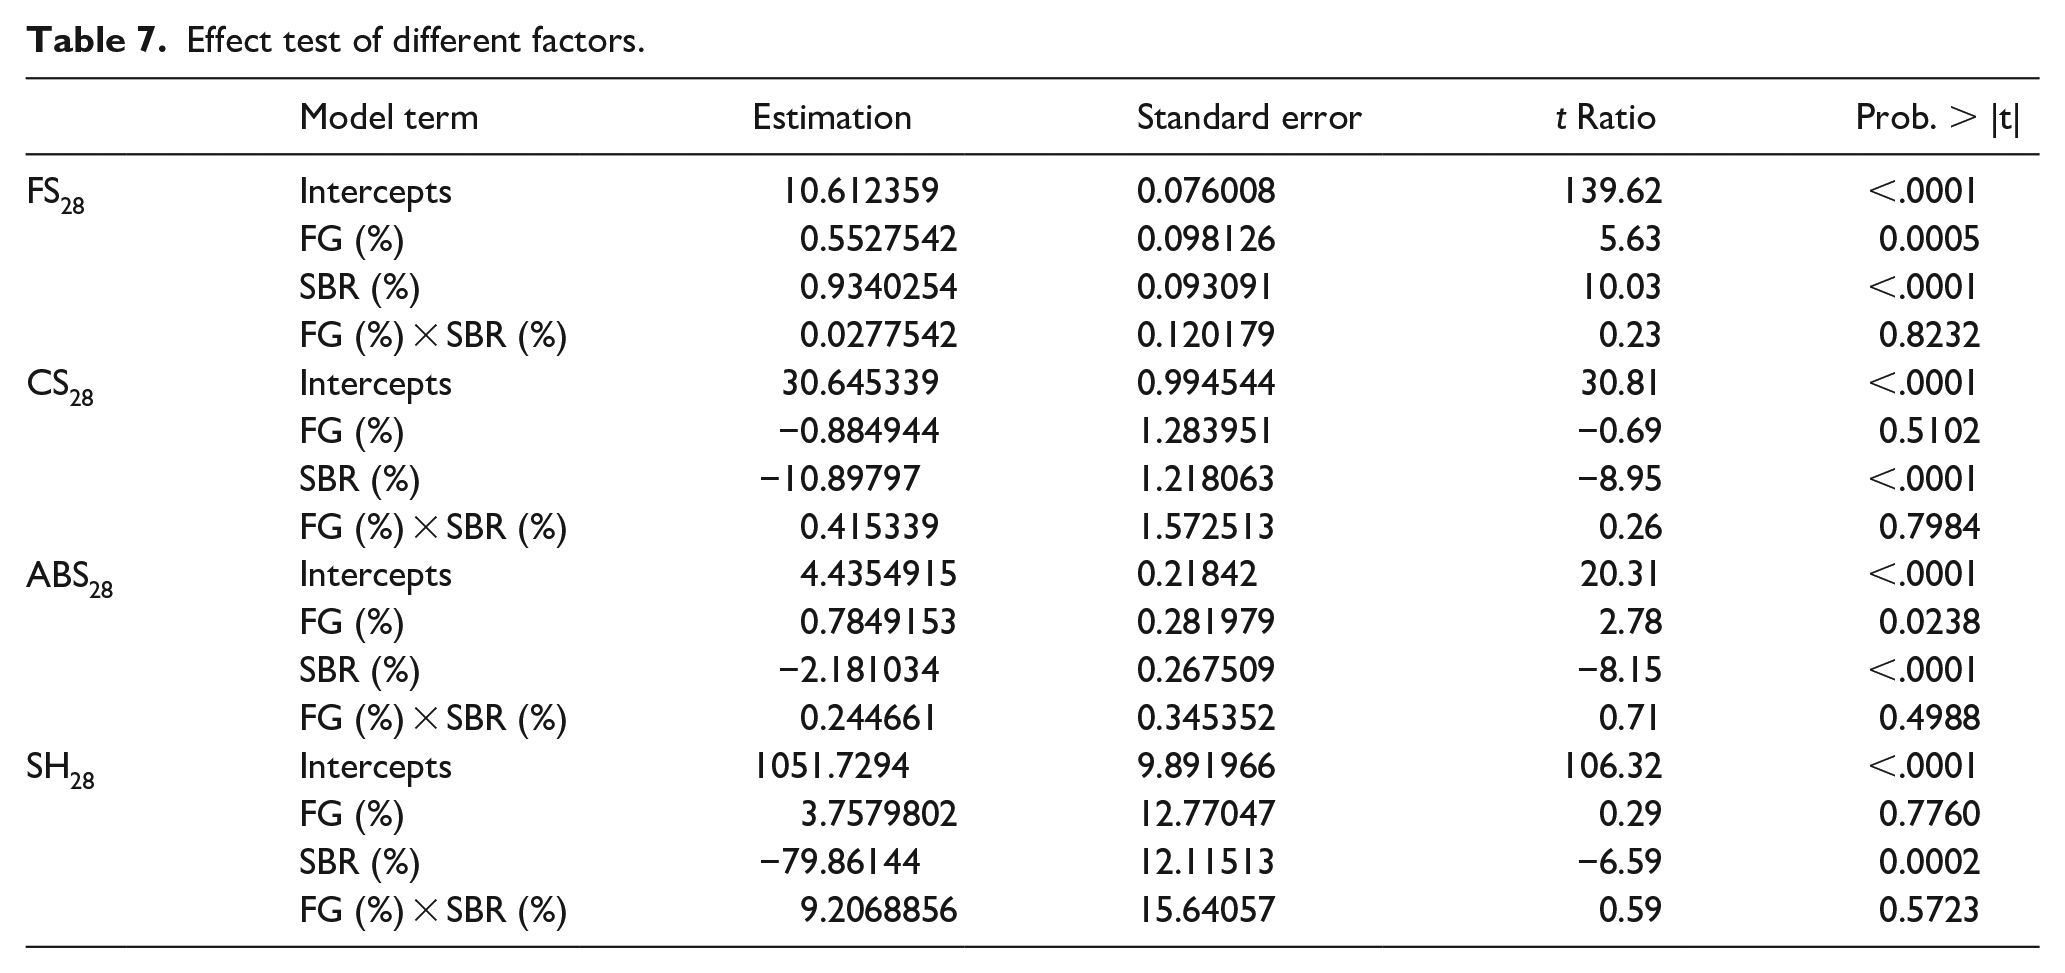
Table 7 present the effect of each factor (GF% and SBR%) and interactions on the properties, with p ⩽ 0.05 indicating significant coefficients. Both individual factors and interactions had a highly significant influence on the studied properties.
Effect test of different factors.
Mathematical models
The independent variables, (GF (%)) and (SBR (%)), along with the responses (FS28), (CS28), (WA28), and (SH30), were entered into the JMP 16 software. 47 The developed numerical models utilize a comprehensive full factorial design approach. It is expected that these models’ mathematical equations will remain valid for a wide range of mixtures, encompassing a range of 0%–0.5% for glass fibers (GF) and mass percentages of SBR spanning from 0% to 10%.
These models provide relevant insights into how each factor influences the behavior of repair mortars. The following are the mathematical models that were formulated to predict the responses of CS, FS, ABS, and SH:


Correlation between experimental values and numerical values
Figure 5 represents the correlation between experimental and numerical values of various mechanical and physical properties.

Correlation between experimental values and numerical values of (a) flexural strength, (b) compressive strength, (c) water absorption, and (d) total shrinkage.
Based on the analysis of Figure 5, it becomes clear that a robust and meaningful correlation exists between the empirical and computational results. This correlation underscores the exceptional alignment of the numerical model with all investigated attributes. The correlation coefficient, denoted as R², attains a notably elevated range of 0.85–0.94, confirming a strong agreement between the real data and the model predictions.
Furthermore, the proximity of all data points to the mean line in the graph enhances the reliability of the model. This means that the numerical model can effectively and reliably depict the characteristics of the various examined attributes, even under varied experimental conditions.
These outcomes are incredibly promising and showcase the model’s resilience in forecasting the characteristics of the analyzed materials. The concordance observed between experimental and numerical outcomes bolsters the trustworthiness of employing the model for material design and optimization purposes.
These findings are likely to contribute significantly to the development of innovative solutions in the field of repair materials research and their practical implementation in real-world applications.
Flexural strength
The analysis results for the 28-day flexural strength (FS) were graphically represented, considering two factors: the content of glass fibers (GF) as a volume percentage and the content of Styrene-Butadiene Rubber (SBR) as a mass percentage. These graphical representations can be observed in Figures 6 and 7.

Curves and surfaces of iso-response for the flexural strength at 28 days.

(a) Plot showing the main effects of the 28-day flexural strength and (b) experimental results of flexural strength for various mortars.
It was observed that the 28-day flexural strength increases from 10 to 11.5 MPa when the percentage of glass fibers (GF) increases from 0% to 0.5%. Furthermore, augmenting the SBR content leads to an improvement in the strength of mortars incorporating glass fibers. Hence, mortars with high contents of both glass fibers and SBR were identified as producing good 28-day FS.
The optimal range for 28-day flexural strength was established to lie within a glass fiber (GF) content higher than 0.25% and an SBR latex content of more than 6%. This effect may stem from enhanced cohesion between mortar constituents (paste and sand) owing to the polymer film and co-matrix development. The co-matrix involves an interpenetrating network of hydrated cement and polymer phases.15,50,51 Additionally, according to Xu et al. 29 the polymer matrix demonstrates efficient bonding with glass fibers due to thin polymer films occupying voids between particles, improving tensile strength of polymer mortars. Furthermore, Leone et al. 52 have shown that the type of metallic fiber materials, their shape, and aspect ratio have a significant impact on the brittleness, tensile strength, flexural strength, and energy absorption of concrete.
The main effects graphs in Figure 7(a) describe the response of the 28-day flexural strength in the mortar, considering the GF and SBR factors. Notably, a significant increase in FS at 28 days, from 10 to 11.5 MPa, is observed as the GF factor varies from 0% to 0.5%. This increase is attributed to the reinforcement effect of fibers, leading to enhanced ductility and resistance to rupture. Furthermore, a substantial increase in FS is observed with the variation of the SBR factor from 0% to 10%, indicating a notable influence of SBR on the flexural strength of the mortar at 28 days. These finding are in agreement with the coefficients from Table 7 as well as the experimental results from Figure 7(b).
Compressive strength
Figure 8 depicts curves and iso-response surfaces that illustrate the 28-day compressive strength of mortars with varying proportions of GF (Glass Fibers) and different levels of SBR (Styrene-Butadiene Rubber). As the GF percentage increases from 0% to 0.5%, the compressive strength at 28 days shows a slight decrease, ranging from 31 to 29 MPa. Moreover, irrespective of the existence of GF, elevating the SBR content results in a notable decline in mortar strength. The optimal range for compressive strength at 28 days was identified as GF and SBR content below 0.35% and 2.5%, respectively.
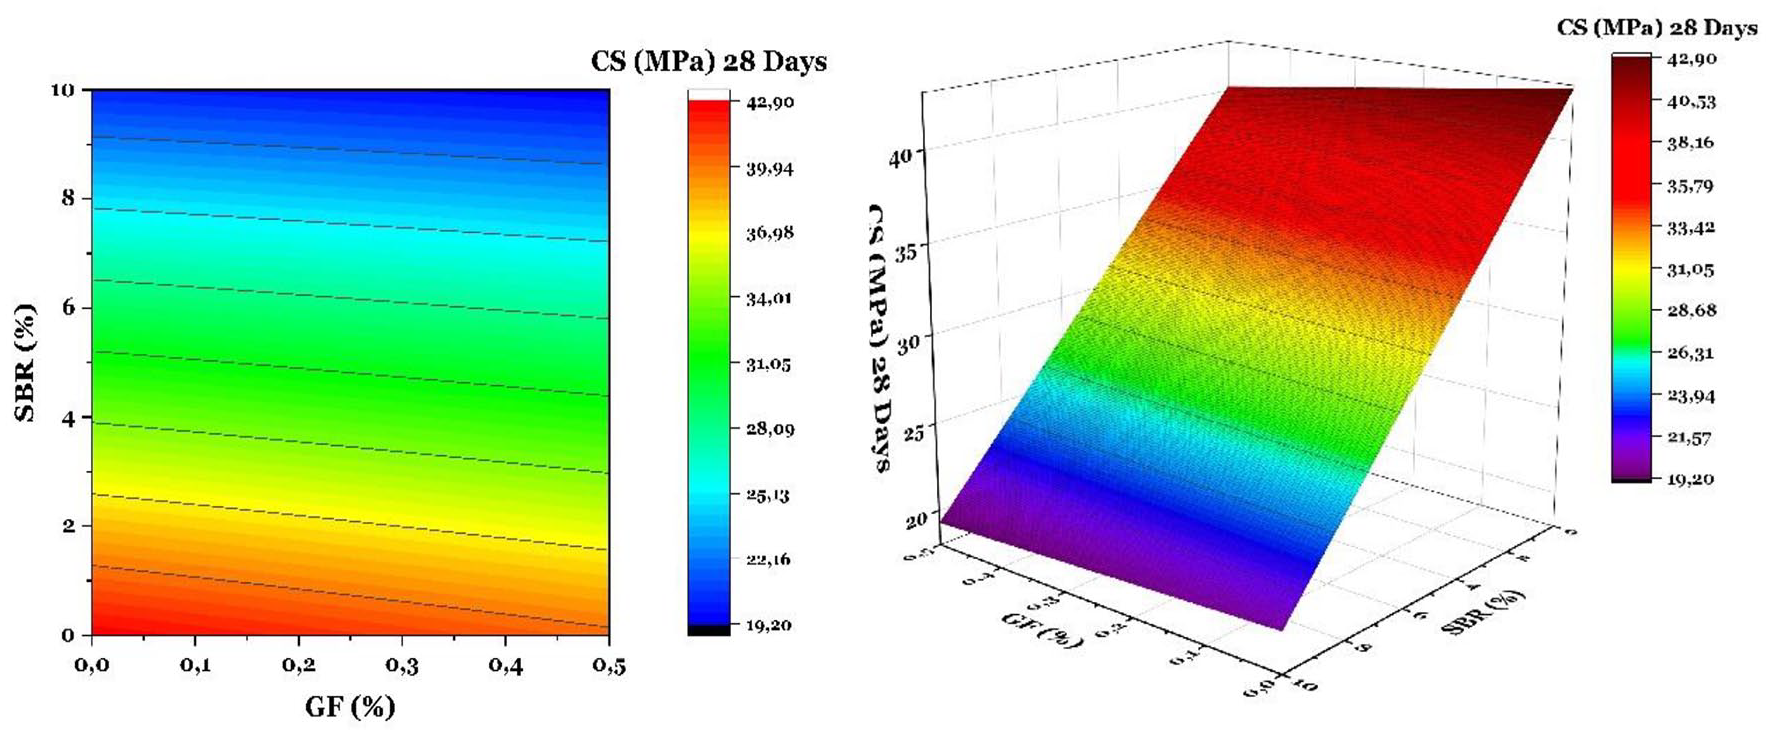
Curves and surfaces of iso-response for 28-day compressive strength.
Numerous studies have consistently demonstrated that the inclusion of polymers has a limited or even adverse impact on compressive strength.12,14,53 According to Shi et al., 15 this reduction is attributed to an increased air content within modified mortars due to the presence of polymers.12,16 Barluenga and Hernández-Olivares 14 found that incorporating SBR latex into cementitious mortar leads to a reduction in compressive strength, attributed to the comparatively lower mechanical potency of latex in contrast to cement mortar.
Additionally, Guo et al. 12 noted that this decline in strength is probably a result of the polymer molecules having a lower elasticity modulus in comparison to the individual cement hydration products.
Within Figure 9(a), the primary effects plots delineate the influence on the 28-day compressive strength of mortar as the factors of GF and SBR are taken into account. Notably, a substantial decrease in compressive strength at 28 days, dropping from 42 to 20 MPa, is observed as the SBR factor varies from 0% to 10%, indicating a significant influence of SBR on the mortar’s 28-day compressive strength. These results align with the coefficients presented in Table 7, in addition to the experimental findings illustrated in Figure 9(b).
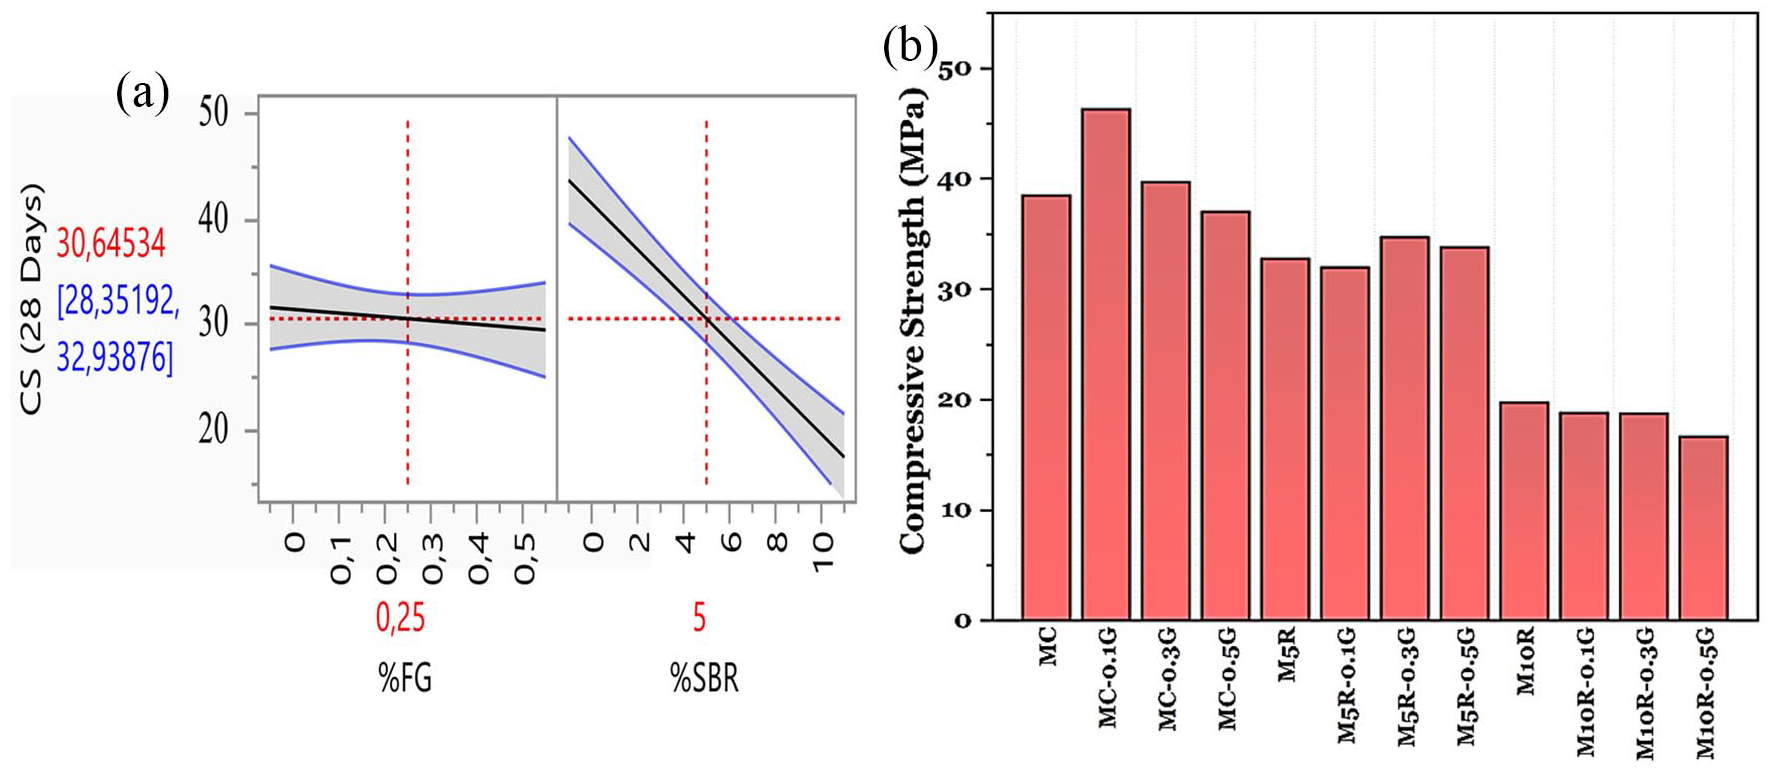
(a) Plot showing the main effects of the compressive strength at 28 days and (b) experimental results of compressive strength for various mortars.
Water absorption
The Figures 10 and 11 provide insights into how two factors, the glass fiber content (GF %) and the mass percentage of SBR, influence water absorption response after 28 days.

Curves and surfaces of iso-response for the absorption at 28 days.

(a) Plot showing the main effects of the absorption at 28 days and (b) Experimental results of water absorption for various mortars.
It’s clear that elevating the fiber content from 0% to 0.5% results in an increase in water absorption. The presence of SBR significantly affects the water absorption characteristics of mortars. For instance, a higher SBR content results in a substantial 40% reduction in water absorption for a mortar containing 0.5% GF and 10% SBR, compared to another sample with the same fiber content.
The reduced water absorption may stem from polymers occupying coagulated pores, which reduces open porosity and bridges microcracks within the matrix.54,55
Figure 11(a) exhibits the primary effects graphs depicting the water absorption response in mortar after 28 days, while accounting for the factors of glass fiber content and SBR. It can be noticed that the water absorption after 28 days rises from 10% to 15% as the glass fiber factor level changes from 0% to 0.5%. Conversely, an increase in water absorption from 10% to 40% is observed due to a change in the SBR factor level from 0 to 10%. This indicates that the SBR content’s impact on water absorption is more significant than that of the GF content. These results correspond with the coefficients outlined in Table 7, along with the experimental outcomes depicted in Figure 11(b).
Total shrinkage
Figure 12 presents the iso-response curve and iso-response surfaces illustrating the overall shrinkage evolution after 30 days for mortars with varying levels of GF and SBR (%). It is apparent that enhancing the fiber content from 0% to 0.5% results in a minor increase in shrinkage. The fibers present in the mortars act as bridges between the matrix particles, making the mortar more resistant to rupture but also creating additional pores in the material. These pores facilitate water migration to the exterior of the mortar, resulting in significant shrinkage. The presence of SBR is pivotal in determining the overall shrinkage of the mortars. For instance, a higher SBR content results in a significant 55% reduction in shrinkage for a mortar containing 0.5% GF and 10% SBR, compared to another sample with the same fiber content.

Curves and surfaces of iso-response for the Shrinkage at 30 days.
Similarly, the particles or resin films, by partially filling the capillary pores, contribute to mitigating the drying shrinkage phenomenon. For example, a research conducted by Guo et al. 12 demonstrated that introducing resin particles into mortars led to a 20% reduction in drying shrinkage when compared to mortars without resin. Another study conducted by Parhizkar et al. 20 also showed that resin films could contribute to reducing drying shrinkage, although their effect is less significant than that of particles.
Ribeiro et al. 56 elucidated the rationale behind the diminished shrinkage observed in polymer mortars compared to cement-based ones. They identified a lower occurrence of microcracks at the paste-aggregate interface or surface due to the influence of polymers. This improvement is a result of the polymer forming a film around the cement particles, preventing them from moving and creating cracks.
Figure 13(a) shows main effects plots of 30-day shrinkage response considering fiberglass content and SBR factors. An alteration in the GF factor level from 0% to 0.5% leads to an escalation in shrinkage after 30 days, ranging from 3% to 6%. Conversely, a modification in the SBR factor level from 0% to 10% results in a reduction in shrinkage, spanning from 5% to 55%. This indicates that the impact of SBR content on shrinkage is more significant than the influence of GF content. These findings correlate with the coefficients specified in Table 7, as well as the experimental results illustrated in Figure 13(b).

(a) Plot showing the main effects of the Shrinkage at 30 days and (b) experimental results of shrinkage for various mortars.
Table 8 provides a summary of all the experimental results found in this study.
The experimental results.

Microstructural analysis
Figure 14 presents images obtained through scanning electron microscopy (SEM) of the specimen.

Scanning electron microscope images of different types of mortars.
The results of scanning electron microscopy (SEM) images of different repair mortars can be interpreted as follows:
1. Homogeneity and dense structure: The observation of homogeneity in all the repair mortar mixtures, particularly M10R, indicates a good mixing quality and a uniform distribution of components within the matrix, promoting high compactness and low porosity for increased mechanical strength and durability.
2. Strong bonding between the polymer matrix and glass fibers: Effective adhesion between the fibers and the matrix allows for efficient transfer of loads and stresses, thereby enhancing resistance to traction and flexion. This is particularly important in repair applications where resistance to cracking and deformation is crucial. In a study published in 2020, Jo 45 utilized SEM to observe polymer films at the interface between repair mortar and the concrete substrate. The study results displayed uniform polymer film distribution adhering to aggregates. Namely, the polymer film exhibited strong bonding with silicon dioxide, which is the main component of both hydrated cement and aggregates. 57
This study demonstrated that the polymer films can enhance the bonding between the repair mortar and the concrete substrate. This can help reduce the risk of cracks and detachment of the mortar.
In summary, scanning electron microscopy images of repair mortars reveal homogeneity and a dense structure, as well as good adhesion between glass fibers and the polymer matrix, but do not directly visualize the composition of the paste.
Digital Image Correlation (DIC)
The Figure 15 illustrates the application of digital image correlation to repaired concrete using M5R-0.3GF mortar, with the assistance of the Gom software. This visualization highlights different phases of deformation and displacement. Two captures were taken at the beginning (1) and at the end (2) of the load.
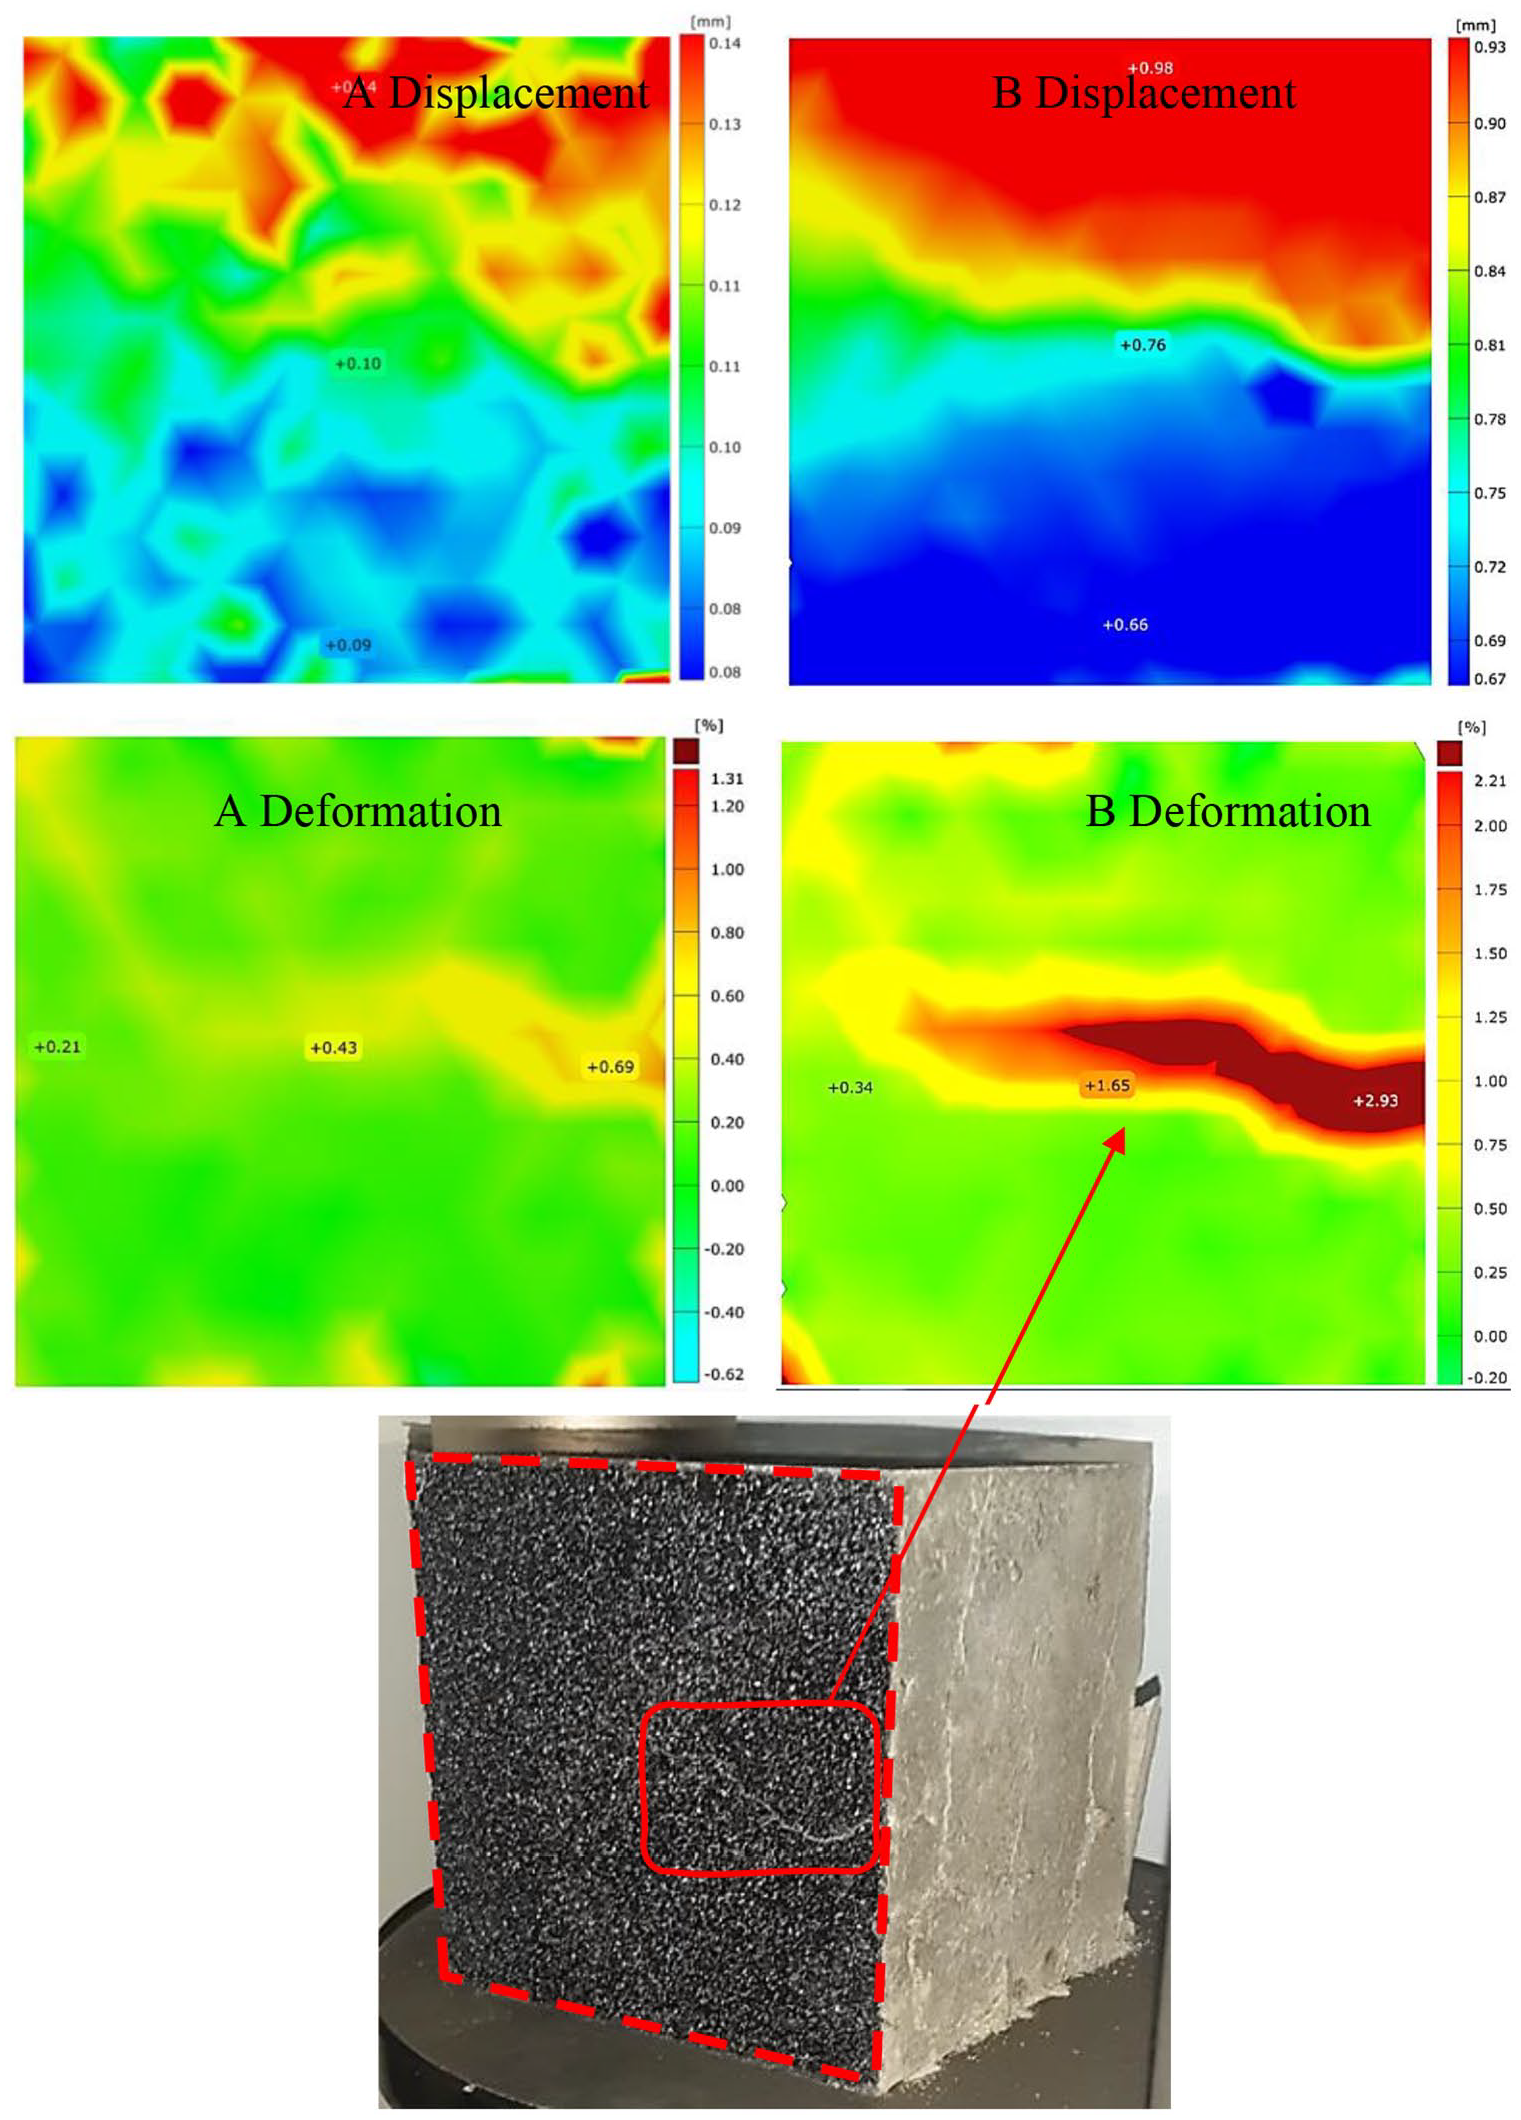
Different phases of degradation of repair mortars using digital image correlation: (A) Start of loading, and (b) End of loading.
In Phase A, concerning deformation, most of the surface displays a glassy texture, suggesting a relatively low level of deformation, ranging between 0% and 0.2%. This indicates a moderate compressive stress on this part of the repair mortar. However, a small central area appears in yellow, indicating slightly higher deformation, between 0.4% and 0.8%. This zone could be subjected to significant pressure or mark the beginning of a horizontal crack. Therefore, the DIC method proves effective in anticipating potential cracks.
Regarding displacements, they initiate from the upper part of the specimen, as shown in Figure 15(a), with red zones reaching a maximum value of 0.14 mm. At the median level, green zones can be observed, corresponding to average displacements of 0.11 mm. Conversely, displacements are lower in the lower part, reaching 0.08 mm. At the onset of the load, the displacement contrast between the upper and lower segments reaches 75%.
In Phase B, with respect to deformation, significant zones on the surface take on a yellow hue, indicating a medium level of deformation, ranging between 0.5% and 1.3%. This reveals high compressive stress on this part of the repair mortar. However, a notable zone in the center of the surface is colored red, signaling a very high deformation, between 1.75% and 2.21%. This area could be subjected to significant pressure or indicate a major horizontal crack (see actual photo). Thus, the DIC method demonstrates an effective correlation with the material’s real behavior.
As for displacements, the upper part of the specimen exhibits a red zone reaching a maximum value of 0.93 mm. At the median level, green zones correspond to average displacements ranging from 0.78to 0.8 mm. Conversely, displacements are less significant in the lower part, ranging from 0.67 to 0.72 mm. The displacement difference between the upper and lower parts reaches 35% at the end of the load. As emphasized by Huang et al., 58 research has shown that DIC provides information about deformation patterns and the initiation of cracks in concrete structures.
This interpretation underscores the importance of digital image correlation in assessing material behavior and predicting their response to stress. It provides crucial information for understanding deformations and displacements, as well as identifying zones prone to cracking, thus contributing to a more comprehensive analysis and management of concrete repair structures. Furthermore, this method can aid in guiding appropriate repair and reinforcement measures, focusing on areas with higher stresses. Taking these insights into account, targeted repair strategies can be implemented to fortify the most vulnerable parts of the repaired concrete, ensuring long-term durability and structural strength.
Repair of concrete subjected to high temperature
Fire is a crucial phenomenon that can have a profound effect on concrete. In many cases, it causes significant degradation, weakening the structure and putting it at risk of collapse. 59 In this study, we tested the effects of fire on concrete specimens by placing 100 mm × 100 mm × 100 mm concrete blocks in an oven and exposing them to a temperature of 750°C for 1 h. The Figure 16 represents the variations in compressive strength of different concrete repaired using two types of mortars, C-R-M5R-0.3G and C-R-MC.
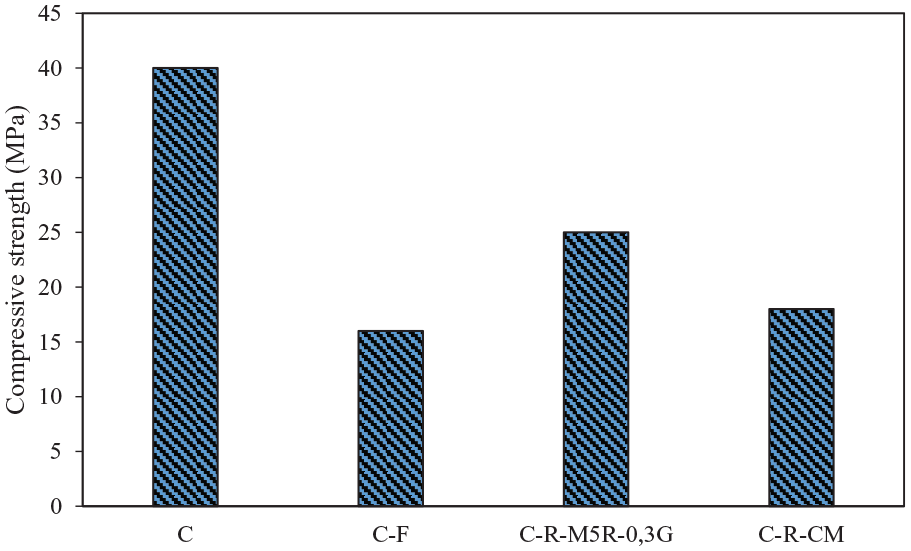
Comparison between concrete that was heated and repaired using two different types of materials.
The results, as shown in Figure 16, revealed a significant reduction in the residual compressive strength of the concrete, which measured 18 MPa after heating (C-F). This represents a substantial reduction compared to the initial strength of 43 MPa measured at 365 days. Considering the risks posed by fire degradation in concrete structures, such as tunnels and large building structures, The aim of this study was to validate the efficiency of the cost-effective repair mortar developed for degraded concrete repair. To achieve this, polymer concrete containing 0.3% fiberglass and 5% SBR latex was used, and the results were compared with the control mortar.
According to Figure 17, it can be observed that (C-R-M5R-0.3G) shows a remarkable improvement in strength, with a 56% increase compared to C-F. This is a significant result and demonstrates the effectiveness of the repair mortar in strengthening damaged concrete structures. Additionally, the adherence of the repaired mortar is excellent, ensuring the repair remains stable and secure over time. Furthermore, the new SBR-based mortar developed in this study achieves high strengths, with a 39% improvement compared to C-R-CM.

The adhesion between heated concrete specimens and the repair concrete.
Conclusion
The study delved into the mechanical and physical attributes of cementitious repair mortars, which were modified with styrene-butadiene rubber (SBR) and bolstered with glass fibers. The conclusions drawn from this investigation can be summarized as follows:
The incorporation of SBR and glass fibers led to an enhancement in flexural strength. As the content of glass fibers (GF) increased from 0% to 0.5%, the 28-day flexural strength demonstrated an increase from 10 to 11.5 MPa. The optimal range for flexural strength was found to be with GF and SBR content above 0.25% and 6%, respectively.
As the percentage of GF increased from 0% to 0.5%, the 28-day compressive strength exhibited a slight decrease, ranging from 31 to 29 MPa. The optimal range for compressive strength was identified with GF and SBR content below 0.35% and 2.5%, respectively, revealing a high strength of approximately 33 to 35 MPa.
A higher SBR content resulted in a substantial 40% reduction in water absorption for a mortar containing 0.5% GF and 10% SBR, compared to another sample with the same fiber content.
A higher SBR content resulted in a significant 55% reduction in shrinkage for a mortar containing 0.5% GF and 10% SBR, compared to another sample with the same fiber content.
The results obtained from the analysis of variance (ANOVA) indicated that both SBR and glass fiber content were significant factors influencing the properties of the mortars.
The mathematical models developed in the study generated effective prediction equations for flexural strength, compression, total shrinkage, and water absorption properties of the mortars. These equations are applicable for estimating the characteristics of mortars with varying SBR and glass fiber proportions.
Microstructural examination conducted using a scanning electron microscope revealed excellent compatibility between the fibers and the polymer matrix.
Digital Image Correlation (DIC) exhibited a highly effective digital representation of various areas experiencing high stresses. Consequently, the repair mortar demonstrated strong adhesion with the concrete exposed to high temperatures.
In conclusion, the study highlighted that the addition of SBR and glass fibers to cementitious repair mortars can enhance their mechanical properties and water resistance. The mathematical models developed in the study can be employed to predict the properties of mortars with varying SBR and glass fiber contents.
Footnotes
Acknowledgements
The authors gratefully acknowledge the Civil Engineering Laboratory at the University of Bordj Bou Arreridj and its staff for enabling the experimental work carried out in this study. We would also like to express our sincere gratitude to the LARGHYDE Laboratory at the University of Mohamed Khider Biskra for their support and contributions to our research.
Availability of data materials
Data and materials will be provided upon request.
Declaration of conflicting interests
The author(s) declared no potential conflicts of interest with respect to the research, authorship, and/or publication of this article.
Funding
The author(s) received no financial support for the research, authorship, and/or publication of this article.
Ethical approval
None of the authors of this article conducted studies involving human participants or animals.