
Abstract
Glass fiber reinforced cement (GRC) incorporating foam has good thermal insulation. Micro pores not only lowered the strength of the cement matrix but also changed the friction between the fiber and the matrix. It has an influence on modulus of rupture (MOR) and fracture energy of GRC. In this work, the effect of the glass fiber and foam contents of GRC on the MOR and fracture energy were evaluated using four-point flexural tests. The results show that glass fiber content has little influence on MOR of GRC. However, the MOR decreased significantly with increasing foam content. The empirical formula summarized by experiments can well characterize the relationship between the MOR and density of foamed GRC. The content of glass fiber and foam has a significant influence on the fracture energy of GRC. The fracture energy of foamed GRC decreased with the decrease of dry bulk density, and the decrease was fast and then slow.
Introduction
Fibers can effectively control the cracking of composites, and the incorporation of pores reduces their self-weight. 1 The combination of fibers and pores can result in high-quality composites. Lower density can also be achieved by adding ceramsite, expanded vermiculite, expanded perlite, pumice, EPS particles, or foam, resulting in light weight, flame retardancy, and heat insulation2,3 and reducing the energy consumption of buildings. 4 Glass fibers play a bridging role in the porous cement matrix, inhibiting crack propagation and improving the mechanical behavior such as the strength and toughness of the composite.5–8
The mechanical properties of glass fiber reinforced cement (GRC) incorporating various light aggregates were studied. Tassew and Lubell 9 claimed that glass fiber significantly improves the flexural and shear strength of ceramsite concrete but has little effect on the compressive strength. By incorporating 20–60 wt% PFA cenospheres into GRC, West et al. 10 produced a lightweight composite sheet with a dry density of 1500 kg/m3, a flexural strength of 12 MPa, and a limit of proportionality (LOP) of 6 MPa. Cheng et al. 11 developed an empirical formula for the relationship between the EPS content and GRC flexural strength. Li 12 reported that the tensile strength of a fiber-reinforced composite is a function of the fiber characteristics, the interface between the fiber and the matrix, and the matrix characteristics. The presence of pores reduces the strength of the matrix, and glass fibers act a bridge in the matrix. Falliano et al. 13 additionally installed a glass fiber mesh in the tensile stress area of fiber reinforced lightweight foamed concrete and obtained ultra-light concrete members with high mechanical strength.
For GRC sheets, toughness, and strength are equally important.14,15 In general, fracture toughness is observed to be linearly proportional to the fiber volume fraction. 16 The fracture toughness of GRC can be evaluated by measuring the fracture energy. 17 Fracture toughness is commonly measured using a four-point flexural test. The effect of the fibers on the flexural failure process of GRCs can also be analyzed using the pre-peak and post-peak information of a flexural load–deflection curve. 18 Genovés et al. 19 monitored damage of a GRC using Non-Destructive Testing (NDT) techniques such as Non-linear Impact Resonance Acoustic Spectroscopy (NIRAS) and other ultrasonic techniques. The toughness of a GRC is determined by the pull-out of fibers and the pseudoplasticity. Chemical bonds may be formed between the fiber and matrix; however, the static and dynamic friction at the interface also play an important role in determining the bonding strength. 20 The interfacial bond strength between the fiber and matrix can be effectively modified by surface treatment. 21 Mahzabin et al. 22 used alkali treatment to improve the surface roughness of kenaf fiber. The adhesion between the treated kenaf fiber and matrix improved, and the ductility of the composite was lower than that with the untreated kenaf fiber. Surface treatment of glass fiber bundles weakens the force between the glass fiber bundles and cement matrix and can slow down the brittle fracture of fiber bundles in composites.23,24
The incorporation of foam in the mixture not only reduces the bulk density but also acts as a “ball,” improving the workability and producing high-quality lightweight GRC. Stable foam can be obtained by mixing a high-performance foam agent with water under high-speed stirring. However, as GRCs are a new type of composite, there is currently a lack of research on the effect of foam on the flexural failure of GRCs, particularly its effect on the modulus of rupture (MOR) and fracture energy of GRCs with different glass fiber contents. This has led to confusion among engineers in applying this lightweight GRC. In this study, the effects of foam and glass fibers on the MOR, fracture energy, and fracture process of GRC were investigated, and a theoretical basis for the application of the foamed GRC was presented.
Materials and testing methods
Materials
The foaming agent from Beijing Sinomtec Technology Co., Ltd. was a colorless liquid made of multiple surfactants with a pH of 6.8. Its main component is sodium dodecyl benzene sulfonate. The foaming agent and water were stirred together at a high-speed of 1000 RPM to produce a stable micro foam of approximately 0.3 mm in diameter (Figure 1).
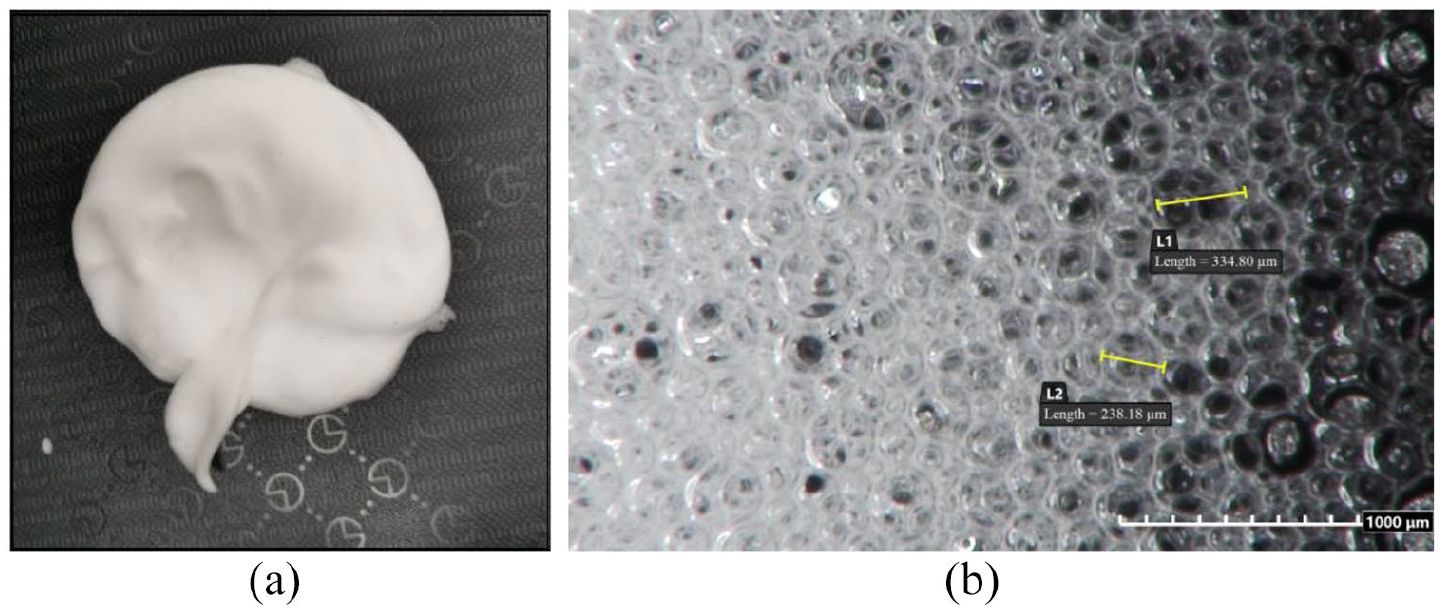
Foam for experiments: (a) accumulation of foam and (b) morphology of foam.
All specimens were made using L·SAC 42.5 low alkalinity sulphoaluminate cement from Guangxi Yunyan Special Cement Building Materials Co., Ltd. The mix proportions of the constituting elements in the cement were established in accordance with JC/T 659-2003. 25 Chopped high-zirconium AR glass fiber of ARC15-98-12 mmH from Huierjie New Material Technology Co., Ltd. was adopted, with a zirconia content of 16.7% by weight, a fiber diameter of 15 μm, a single-strand linear density of 98 tex, and a fiber length of 12 mm (Figure 2). River sand was used in this study and was screened using a square hole sieve with an aperture of 2.36 mm; the fineness modulus was 1.9. The water reducer used in this study was a polycarboxylate superplasticizer with a solid content of 50%.

Glass fibers: (a) glass fiber bundles and (b) glass fiber filaments
Mixture
The flexural tests were performed with reference mortar and the GRCs. The glass fiber contents of the GRCs were 0.8%, 1.6%, 2.4%, and 3.2% by weight. The glass fibers replaced sand of equal quantity. The GRCs with four glass fiber contents and reference mortar were formulated into five types of mixtures with different foam contents. The water-to-binder ratio of each mixture was 0.36, the sand-to-binder ratio was 1.0, and the dosage of the admixture was 0.8% (by solid content).
The foamed GRC was prepared by adding foam to the mixture. The pore content of GRC was controlled by changing the amount of prefabricated foam. As the foam was partially broken during stirring, the amount of foam added was not completely equal to the pore content of the specimens. The dry bulk density better represents the pore content in the specimens. Table 1 gives the mix proportions of the GRCs with four different glass fiber contents and the reference mortar, where FCx-0 refers to the reference specimens without foam, and FCx-1, FCx-2, FCx-3, and FCx-4 represent the specimens with different foam contents. For example, the GRCs with a glass fiber content of 1.6% and different foam contents were labeled FC1.6-0, FC1.6-1, FC1.6-2, FC1.6-3, and FC1.6-4. The corresponding dry bulk densities were 1903, 1621, 1396, 1252, and 988 kg/m3, respectively.
Mix proportions and dry bulk densities.

Experimental methods
The number of pores in the specimens was controlled by changing the amount of foam added. First, the GRC was mixed according to the designed mix proportion; the prefabricated foam was added, the mixing continued for 90 s, and then, the mixture was poured into a 10-mm-thick mold. After curing for 7 days at 20°C ± 2°C and a relative humidity more than 95%, the sheets were cut into specimens of 250 mm × 50 mm. Four-point flexural tests were performed based on GB/T 15231. 26 Four-point loading imposes pure flexural forces over the middle third of the test specimen and is preferred to the three-point loading test, where the stress is concentrated at the center (Figure 3). The distances between the loading points and between the loading points and supporting points were all 70 mm. A slow loading rate of 0.5 mm/min was used to ensure that all the work performed by the machine on the specimen was converted into fracture energy. This procedure used a typical universal tensile test machine, where the load–deflection curve was recorded automatically. The limit of proportionality (LOP) is the flexural stress developed when the initial part of the load–deflection curve deviates from linearity. The modulus of rupture (MOR) is the flexural stress developed when the load reaches the maximum. The MOR, fracture energy and dry bulk density of the specimens were represented by the average value of the six samples.
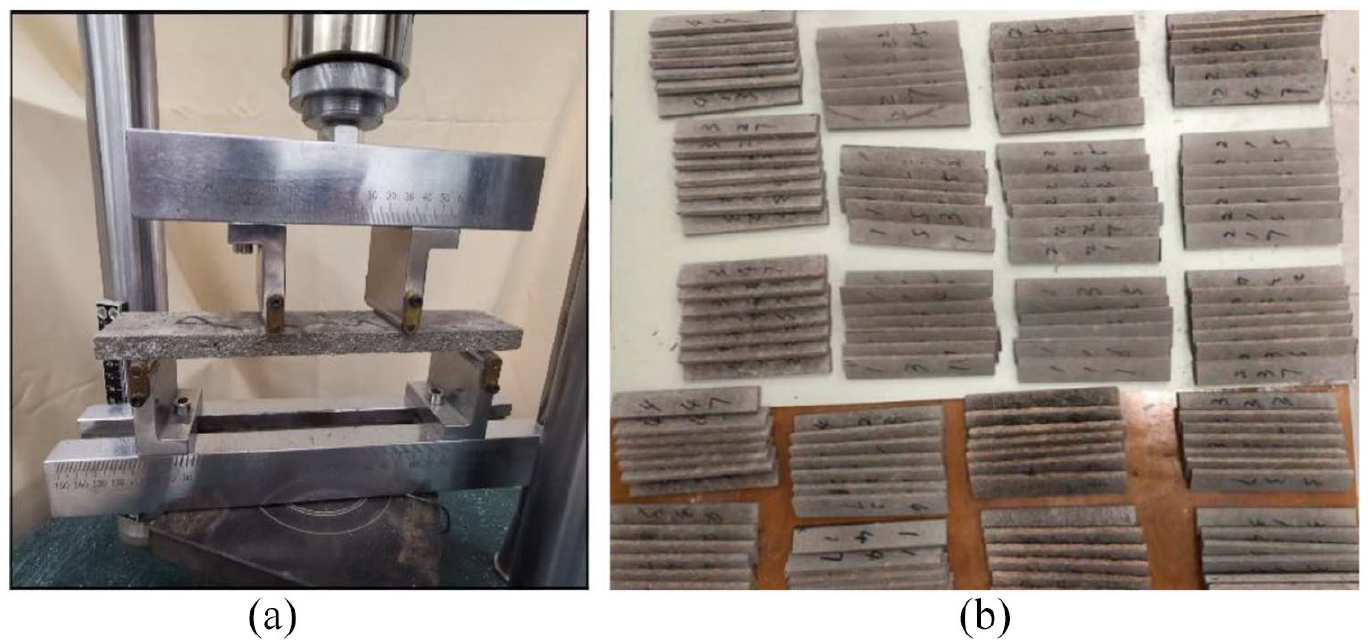
Flexural test: (a) the location of loading points and (b) test samples.
Distribution of fibers and foam
The filaments in the fiber bundle used in this experiment had good dispersion. After being pre-mixed, the filaments were fully dispersed in the specimens, and fiber bundles were rarely observed in the GRC. Although the foam was added by stirring, the incorporated pores were uniformly distributed in the specimens. Figure 4 shows the distribution of pores in the GRC specimens with different foam contents for glass fiber contents of 2.4% and 3.2%. The diameter of the pores was mostly 100–300 μm, which is equivalent to the diameter of the original foam shown in Figure 1. In addition to the pores from the foam, there are also pores in the specimens due to the uncompacted cement matrix and the superplasticizer, especially when the fiber content was high (Figure 4(e)). When the amount of foam was very large, the pores gathered. Especially when the glass fiber content was high, a porous area with very little cement paste and a lot of glass fibers was formed locally (Figure 4(f)).
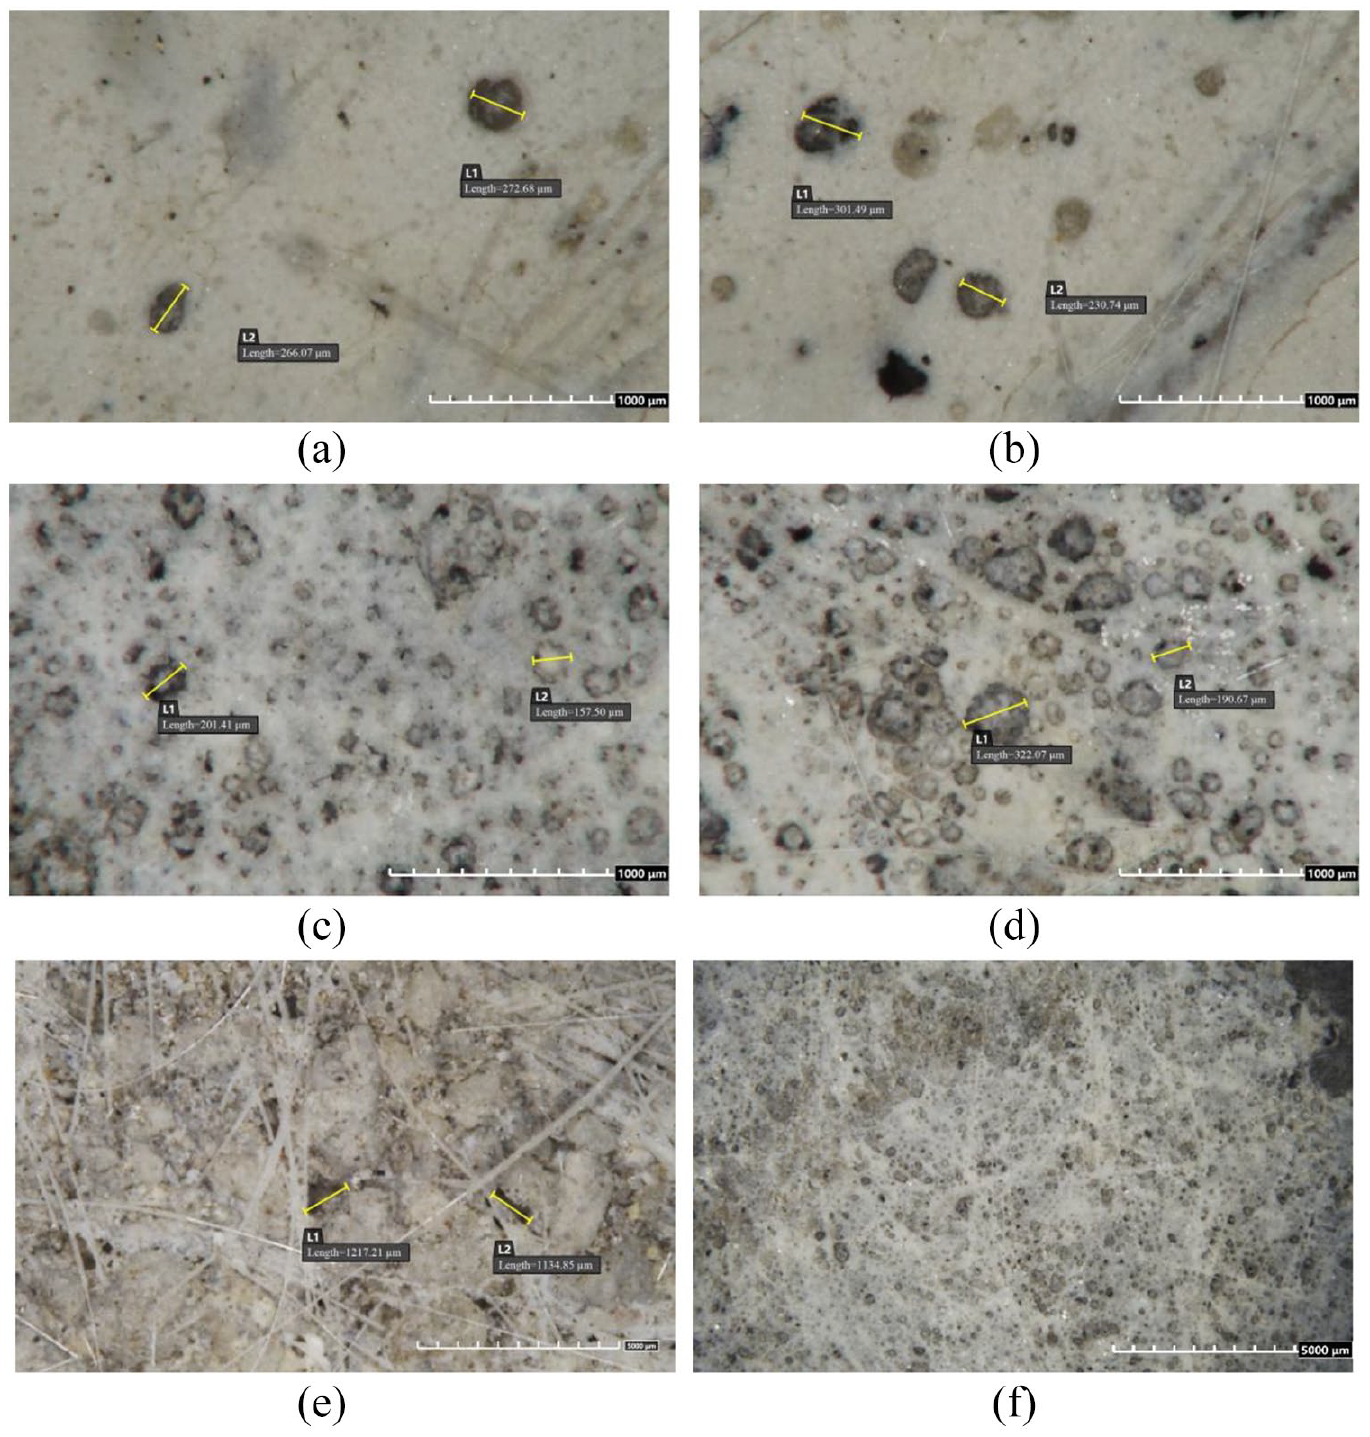
Distribution of pores in GRC: (a) sample FC2.4-1, (b) sample FC2.4-2, (c) sample FC2.4-3, (d) sample FC2.4-4, (e) sample FC3.2-3, and (f) sample FC3.2-4.
Results and discussion
Effect of foam and glass fibers on the MOR
In the foamed GRC, in addition to the pores introduced by the prefabricated foam, there were also pores in the specimens resulting from the uncompacted cement matrix (Figure 4(e)). Whether the pores originated from the foam or uncompacted cement matrix, the presence of pores led to a decrease of the dry bulk density and lowered the MOR of the specimens. 27 Figure 5 shows the relationship between the MOR and dry bulk density of the foamed GRCs with different fiber contents. The MOR decreased with decreasing dry bulk density. The change trends of the GRCs with different glass fiber contents were all similar to that of reference mortar (Figure 5). When the bulk density of the reference mortar decreased from 2151 to 1070 kg/m3, the MOR decreased from 7.2 MPa (FC0-0) to 0.9 MPa (FC0-4), a decrease of 87.5%. When the bulk density of the foamed GRC with a glass fiber content of 3.2% decreased from 1850 to 973 kg/m3, the MOR decreased from 8.7 MPa (FC3.2-0) to 1.9 MPa (FC3.2-4), a decrease of 78.5%. The decrease of the two is similar.

Relationship between MOR and dry bulk density of foamed GRC with different fiber contents.
The glass fibers were effective in reinforcing the matrices.28,29 As observed in Figure 5, a higher glass fiber content resulted in a higher curve, which indicates that the MOR of the GRC increases with increasing glass fiber content at the same dry bulk density. However, compared with foam, the content of glass fiber has little effect on the MOR. When the glass fiber content decreased from 3.2% to 0, the MOR of the foam-free GRC decreased from 8.7 MPa (FC3.2-0) to 7.2 MPa (FC0-0), a decrease of only 17.2%. The MOR of the foam-free GRC with 0.8% glass fiber (FC0.8-0) was even lower than that of the reference mortar (FC0-0). This is because a small number of glass fibers does not form a network in the specimen; therefore, it does not have a reinforcing effect. However, these fibers will lead to non-compaction of the matrix; therefore, the MOR is slightly lowered.
Empirical formula for the relationship between the foam content and MOR
The MOR–density curves of the foamed GRCs with different glass fiber contents are approximately parallel (Figure 5). This indicates that the effects of the glass fibers and foam on MOR are independent. To further analyze the effect of the foam on the GRCs, two concepts of the relative MOR and the relative density are introduced. The relative MOR
Figure 6 shows the relationship between the relative MOR and the relative density of specimens with different fiber and foam contents. The relative MOR increases with increasing relative density. The relationship between the relative MOR and relative density eliminates the effect of different fiber contents on the matrix properties; therefore, the effect of pores is more pronounced.
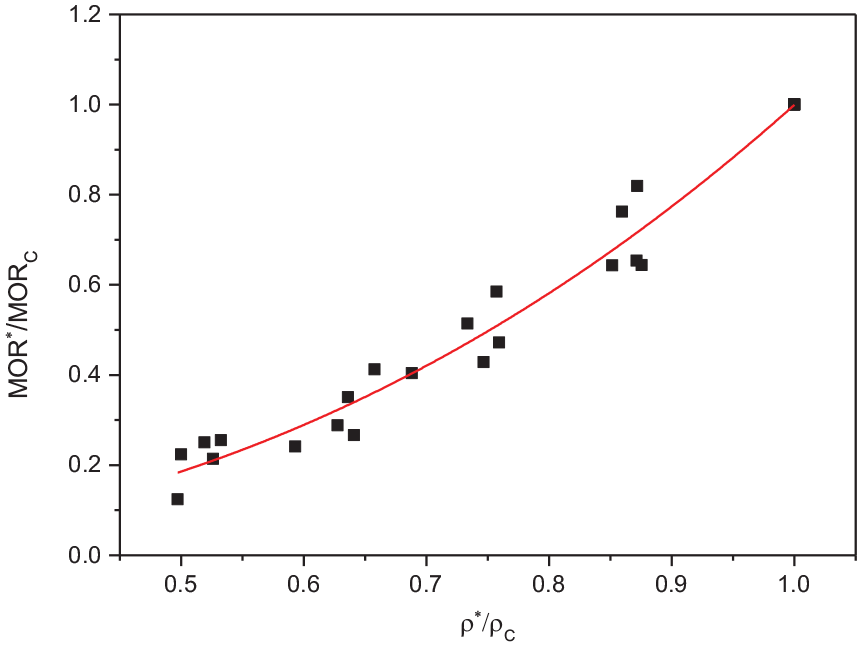
Relationship between the relative MOR and relative density.
Under four-point flexural load, the specimens exhibited failure of crack propagation in the tension zone. The large number of holes formed defect areas but also decreased the effective stress area. As a result, the MOR of the foamed GRC decreased significantly with decreasing relative density. In addition, a higher MOR of the reference GRC without foam corresponded to a higher MOR of the foamed GRC. Therefore, the relationship between the MOR of the foamed GRC

where n is the effect of the relative density on the MOR of the foamed GRC.
The relative MOR of the foamed GRC increased linearly with increasing relative density. Formula 1 was used to fit the relationship between the relative MOR and the relative density of 25 specimens with different fiber and foam contents, as shown in Table 1. The relationship between the relative MOR and the relative density of the foamed GRC obtained by fitting is (equation (2))
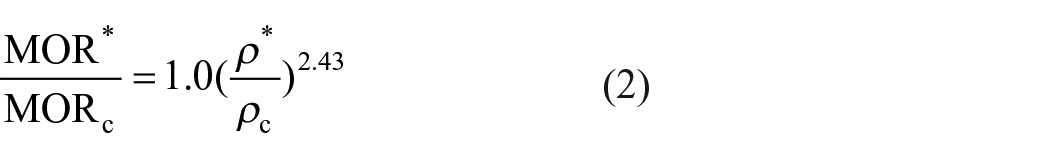
The relationship between the relative MOR and the relative density of the 25 specimens showed good correlation (R 2 = 0.970). This result indicates that the effect of glass fibers and pores on the MOR of GRCs is independent. The index n, which reflects the rate of increase of the relative MOR with increasing relative density, was much larger than 1. This result indicates that the crack propagation dominates the failure process of the specimens and that reduction of the effective stress area is not the key to decreasing the MOR.
Empirical formula 2 can reflects the relationship between the MOR of the foamed GRC and the relative density and MOR of the foam-free reference GRC. This formula has a clear meaning and accounts for the effects of pores and the cement matrix. It can be used to predict the MOR of foamed GRC and to determine the matrix strength from the MOR and dry bulk density in the mix design of foamed GRC. It should be noted that the foam would break during stirring, increasing the actual water content. An appropriate mixing time should be adopted during construction.
Typical flexural load–deflection curves of foamed GRC
In addition to the MOR, the glass fibers and pores had significant effects on the failure behavior of the GRCs. To understand these effects, the flexural load–deflection curve of the foamed GRC was further investigated. Typical flexural load–deflection curves of specimens with different glass fiber and pore contents are presented in Figure 7. It can be observed that the pores and glass fibers affected the flexural load–deflection curves of the specimens; however, the effect of glass fiber on the curves is more obvious. When there were no fibers, the flexural load of mortar with different foam contents dropped sharply after reaching the peak value, and the specimens were broken immediately. All of them exhibited typical brittle failure (Figure 7(a)). With increasing fiber content, the descending section of the curves gradually became gentle, and the specimens began to exhibit increased toughness (Figure 7(b)–(e)). This is because the fibers will carry the load that the specimens sustained after the matrix cracking. 30

Typical flexural load–deflection curves of specimens with different foam and fiber contents: (a) glass fiber content of 0.0%, (b) glass fiber content of 0.8%, (c) glass fiber content of 1.6%, (d) glass fiber content of 2.4%, and (e) glass fiber content of 3.2%
For a glass fiber content of 0.8%, the ascending sections were almost straight lines (Figure 7(b)). The proportional limits almost coincided with the peak point of the curve, and the LOP was approximately equal to the MOR. For the glass fiber content of 1.6% or 2.4%, a significant inflection point was observed before the peak, and the LOP was significantly lower than the MOR (Figure 7(c) and (d)). This is due to the bridging effect of fibers in the cement matrix (Figure 8), which effectively prevents the propagation of uncontrolled cracks after the peak load. 31 With increasing foam content, the curve had an arc-shaped top, and the descending section was smooth. When the foam content was very high, the top of the load–deflection curve of sample FC0.8-4 with a fiber content of only 0.8% was a smooth arc, with perfect plastic behavior exhibited (Figure 7(b)). For the glass fiber content of 3.2%, all the curves had an arc-shaped top regardless of whether foam was present, and there was no obvious inflection point in the ascending section of the curve (Figure 7(e)). This is because when the fiber content is very high, a complete network structure is formed, and the cracks slowly propagate in a controlled state.

Bridging effect of fibers on porous cement matrix.
Effect of foam and glass fibers on the fracture energy
Fracture energy represents the energy consumed per unit area of crack propagation. The energy consumed in flexural failure includes the machine work and self-weight work of specimens. Under the four-point flexural test, the specimens all failed by the propagation of only one crack, and there were fewer subsidiary cracks. Therefore, it can be assumed that the work done by the external force is completely used for crack propagation.32–35 The machine work can be defined as the area under the flexural load–deflection curve shown in Figure 6. Therefore, the fracture energy

where
Unlike the effect of fibers on the MOR, the presence of glass fibers has a great effect on the fracture energy. The relationship between the fracture energy and dry bulk density of specimens with different fiber contents is presented in Figure 9.

Relationship between fracture energy and dry bulk density of specimens with different fiber contents.
The brittleness of porous lightweight aggregate concrete is higher than that of ordinary concrete. 37 The brittleness of the GRC is also affected by the introduction of pores. As observed in Figure 9, the fracture energy of the specimens decreased with decreasing dry bulk density. The fracture energy of the GRC first decreased rapidly and then slowly. When a small amount of foam was added, the fracture energy of the GRC decreased sharply. Increasing the foam content did not continue to promote a significant decrease in fracture energy. Taking the sample FC1.6 with a glass fiber content of 1.6% as an example, the dry density of the foam-free reference sample (FC1.6-0) was 1903 kg/m3, and the fracture energy was 490 N/m. After adding foam, the dry bulk density decreased to 1621 kg/m3 (FC1.6-1), and the fracture energy decreased sharply to 251 N/m, a decrease of 48.8%. This decrease resulted from the formation of defects in the specimens with the addition of a small amount of foam. Under flexural load, the crack propagated rapidly along with the defects and the fracture energy decreased sharply. When the dry bulk density decreased to 1396 kg/m3 (FC1.6-2), the fracture energy decreased to 182 N/m. The decrease was only 27.5%. The dry bulk density continued to decrease to 988 kg/m3 (FC1.6-4), and the fracture energy was 178 N/m. The change of fracture energy was very small. This is due to the decrease of the bond force between the fiber and matrix, leading to an increase in the fracture energy. 20 With the addition of a large amount of foam, the contact area between the fiber and matrix decreased, and the adhesion also decreased. A large number of fibers were pulled out easily during the failure (Figure 10). Thus, the fracture energy increased.

Glass fibers pulled out at fracture.
The fibers can resist the propagation of cracks and do not fail suddenly, which causes an increase in fracture energy. As shown in Figure 9, the effect of glass fiber on the fracture energy of GRC is obvious. The pull-out energy of glass fibers is an important source of GRC toughness, and the fracture energy of GRC increases significantly with the increase of glass fiber content. 27 The higher the glass fiber content, the higher the position of the curve above in Figure 9. It indicates that if the dry bulk density of foamed GRC is same, the fracture energy increased with increasing glass fiber content. This trend was more obvious at lower foam content. When the glass fiber content increased from 0.8% to 3.2%, the fracture energy of the foam-free specimens increased from 420 to 651 N/m, an increase of 155%. Too many fibers lead to a decrease in fracture because when there are too many fibers and foam, the bonding force of the porous matrix to the fiber is too low. Fibers were too easy to pull out, and the fracture energy decreased accordingly. Therefore, when the foam content was high, especially when the dry bulk density of the GRC was below 1400 kg/m3, the fracture energy no longer increased with increasing glass fibers. For the fiber-free mortar, regardless of whether there was foam, it exhibited brittle fracture, and the fracture energy was very small.
Conclusions
In this study, a comparative investigation was performed on the effects of glass fibers and foam on the MOR, flexural load–deflection curve, and fracture energy of GRCs. The main findings were as follows.
The MOR decreased with decreasing foam and fiber content. However, compared with the foam content, the glass fiber content had little effect on the MOR.
The empirical formula summarized by experiments well represents the relationship between the MOR of foamed GRC and its relative density
Both glass fiber and foam have significant effects on the fracture energy of GRCs. The fracture energy of the foamed GRC decreased with decreasing dry bulk density, and the decreasing rate was first fast and then slow. When the foam content was low, the fracture energy significantly increased with increasing glass fiber content. When the foam content was high, especially when the dry bulk density of GRC was below 1400 kg/m3, the fracture energy no longer increased with increasing glass fiber content. Too many glass fibers even led to a decrease in the GRC fracture.
Footnotes
Declaration of conflicting interests
The author(s) declared no potential conflicts of interest with respect to the research, authorship, and/or publication of this article.
Funding
The author(s) disclosed receipt of the following financial support for the research, authorship, and/or publication of this article: This work was supported by the National Natural Science Foundation of China [grant number 52278250].