
Abstract
This study explores and discusses the morphology and microstructure of three-dimensional (3D) multilayered interlaced woven reinforcements for composites. Moreover, this study aims to analyze the differences in the internal geometry of woven reinforcements with different frequency and distribution of connecting points in multilayered woven reinforcement made from basalt fibers. X-ray microcomputed tomography images and the NIS-elements software were used to analyze the microstructure of five different fabrics with connecting points ranging from 1 cm × 1 cm to 5 cm × 5 cm. In the conclusion, the three basic objectives of the study are evaluated: (1) the difference between the upper and lower fabrics in a two-layer reinforcement with difference in the distribution and frequency of connecting points in the fabric area, (2) the shifting of horizontal and vertical fabric layers and mean skewness of contour functions of all tested reinforcements, (3) the thickness, packing density, and volumetric porosity of reinforcements to predict composite behavior during composite preparation.
Introduction
Woven reinforcement for composites introduces numerous technological advantages as well advantages in terms of mechanical properties and reinforcement behavior in the composite compared to other (knitted, nonwoven) textile reinforcements. Woven reinforcement for composites can be prepared based on the lamination of single two dimensional (2D) woven fabrics or 3D woven fabrics. A 3D structure offers advantages such as the compactness of the entire reinforcement, limited displacement of individual layers, and limited changes in the position of threads. Appropriate position of threads in the 3D structure can create suitable reinforcement properties in terms of stiffness or, conversely, flexibility of the resulting composite (e.g. automotive industry, production of bumper parts, and bonnet of an automobile, where it is necessary to create a structure that dampens the crash and absorbs the energy generated from the crash). Research studies have focused on the analysis and properties of input materials with technical fiber specifications1–7 and on the description of the construction possibilities of 3D or 2D woven reinforcement for composites.8–16 Conventional or special weaving machines can be used to produce 2D laminated or 3D woven reinforcement for composites. Regardless of how a woven fabric is used (2D or 3D technical application, i.e. composite or clothing applications), it is always defined by construction parameters that determine its behavior and production. In general, the basic construction parameters of a woven fabric are (a) definition of input yarn parameters (fiber density ρ [kg.m−3] and fineness tex [g.km−1]), (b) definition of the set of individual threads in a woven fabric (warp [ends.cm−1] and weft [picks.cm−1]), (c) definition of thread binding or weave definition (dobby and jacquard shedding mechanism), and (d) areal weight [g.m−2] and thickness [mm] of a woven fabric. The internal structure of the 3D woven reinforcement determines the mechanical properties (stiffness, strength and elongation) of the resulting composite with respect to the combination of input material and number of layers and connection of layers. Various researchers have described the internal structure of woven reinforcements as well as their modeling in relation to the application of the internal structure.17–25 Image analysis methods can be used to experimentally evaluate the internal woven reinforcement geometry. Cross-section images can be obtained via optical microscopy or X-ray computed tomography. In optical microscopy, it is difficult to obtain the real woven fabric structure owing to the fixation of the fabric sample for scanning. In comparison, microcomputed tomography (microCT) scanning is a more suitable method as the sample is in its real state without fixation. This study aims to analyze the internal structure of the multilayer interlaced woven reinforcements with different distribution and frequency of connecting points of layers in 3D woven reinforcement. To the best of our knowledge, no study has been published yet on the influence of the distribution and frequency of connecting points in 3D multilayer woven fabric on the internal geometry of 3D woven reinforcements.
Information about the internal microstructure and morphology of a woven reinforcement is crucial to model and predict the composite properties. Based on the knowledge regarding the behavior of the reinforcement, the error rate and defects during the creation of the composite can be minimized.
3D woven reinforcements created as multilayered fabric connected together by connecting points can influence internal geometry of the individual layers in terms of the waviness and the crimp of the threads in the fabric. Moreover, the distribution of connecting points can influence the thickness and internal porosity of the composite reinforcement. Additionally, it is possible to assume that the connecting points influence the mechanical properties in terms of the elasticity and rigidity of the final reinforcement. This study it is not focused on evaluation of mechanical properties. This study examines the internal structure of a two-layer fabric, where the frequency and distribution of connecting points ranged from 1 cm × 1 cm to 5 cm × 5 cm. In this study, the experimental samples of woven reinforcements were woven using the same construction parameters. The difference in experimental samples is only in the frequency and distribution of connecting points in individual reinforcements. Woven reinforcements were characterized by a square construction (identical parameters in warp and weft in all layers). Overall, this study aims to (1) analyze the difference between the upper and lower fabrics in a two-layer reinforcement with difference in the distribution and frequency of connecting points in the fabric area, (2) monitor the shifting of horizontal and vertical fabric layers and mean skewness of contour functions of all tested reinforcements, and (3) examine the thickness, packing density, and volumetric porosity of reinforcements to predict composite behavior during composite preparation.
Materials and methods
Sample preparation
The rapier weaving machine with an electronic jacquard shedding mechanism (Bonas) was used to produce the experimental 2D and 3D woven reinforcement samples. The jacquard shedding mechanism comprised 1300 hooks. The structure for the experimental part was compared using two types of fabric samples: 2D woven fabrics in plain weave having two single layers with no connecting points and 3D multilayered interlaced woven fabric having two layers (in plain weave also) interlaced with different distribution of connecting points ranging from 1 cm × 1 cm to 5 cm × 5 cm (Figure 1). The surface view of the detail of the connecting point location is almost identical for all types of fabrics, therefore it is shown in Figure 1 only for fabric 1 cm × 1 cm. Note: The marks are used for a better visualization of the connecting points. All experimental 2D and 3D samples were produced with identical construction parameters in warp and weft. The fabric was prepared using a basalt-twisted multifilament yarn with a fiber density of 2900 kg/m3, yarn count of 2 × 68 tex, twist number of 150/m, filament number of 640, and filament diameter of 12 μm. Set of ends and set of picks of woven fabrics was identical 13.2 threads/cm. Table 1 presents the structural parameters of all the experimental woven reinforcements. The 3D simulation of all experimental fabrics (Figure 2) was conducted to better understand the distribution of connecting points. The simulation was created on 72 threads, where the number of threads corresponds to the largest repeat of 3D fabric, with a distance of 5 cm between connecting points.

Experimental samples of two-layer woven reinforcements with the distribution of connecting points: (a) 1 cm × 1 cm, (b) 2 cm × 2 cm, (c) 3 cm × 3 cm, (d) 4 cm × 4 cm, (e) 5 cm × 5 cm, and (f) detail of connecting point 1 cm × 1 cm.
Structural parameters of 2D and 3D woven reinforcement experimental samples.


Simulation of two-layer woven reinforcements with the distribution of connecting points: (a) without connection, (b) 1 cm × 1 cm, (c) 2 cm × 2 cm, (d) 3 cm × 3 cm, (e) 4 cm × 4 cm, and (f) 5 cm × 5 cm.
Characterization of thread cross-sections from microCT images
A microCT scanner (SkyScan 1272, camera pixel size = 7.4 μm) was used to create images of the double-woven fabric with connecting interlaced points.
The cross-sections of all five types of double-woven fabric were evaluated in the same manner. As shown in Figure 3, four threads around the connecting point (threads 01, 02, 03, and 04) were evaluated, including the connecting point itself (thread 05).

Marked locations of threads from which cross-sections were taken and subsequently evaluated (fabric with connecting points 1 cm × 1 cm).
The number of threads around the connecting point was derived by analyzing the internal fabric structure; this analysis confirmed that the more distant threads are not affected by the binding with the connecting point. Figure 3 shows the marking of the threads for the microCT cross-section analysis. Figure 4 shows the individual cross-sections.

Real cross-section images of the threads obtained via microcomputed tomography (microCT): (a) cross-section 01, (b) cross-section 02, (c) cross-section 05, (d) cross-section 03, and (e) cross-section 04.
Image analysis was used to process the binding waves of the upper and lower fabrics for all the aforementioned cross-sections of the marked threads in all the experimental woven fabrics. The steps involved in the processing of cross-sections included image cropping, thresholding, morphologically closing the gap between the upper and lower fabrics, cleaning the cross-sections of the threads in the binding point, creating the contours of the binding waves, and measuring the coordinates of the contour functions. Figure 5 shows the final step in creating the binding wave contours.
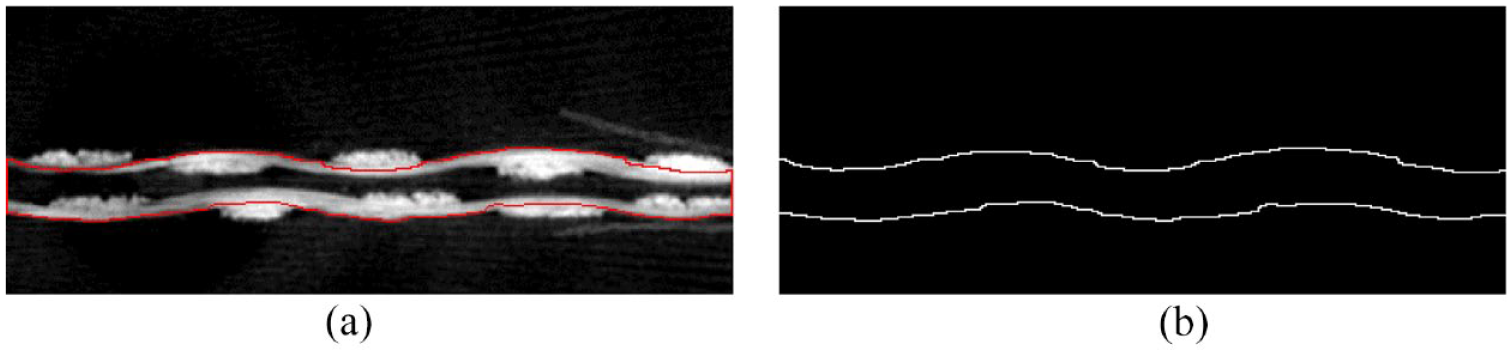
Presentation of image processing of a cross-sectional image of a double-woven fabric in NIS-elements image analysis: (a) creation of binding wave contours and (b) binary image for obtaining the coordinates of the contour functions. Example of processing using the image in Figure 4(a).
Measuring the volumetric porosity of double-layered woven fabrics
The part from one connecting point to the other in each experimental double-woven fabric was evaluated based on the assumption of fabric symmetry. MicroCT cross-section images of the fabric were obtained to determine the total volume, including air of the double-woven fabrics with connecting points (Figure 6(a)), followed by the measurement of thresholding (Figure 6(b)) and closure on a binary image, that is, filling the central space between the fabrics in the double-woven fabric with connecting points (Figure 6(c)).

(a) Original image of a 2 cm × 2 cm cross-section with two connecting points, (b) threshold image of a cross-section with two connecting points, and (c) morphological closure.
The packing density was calculated as the ratio of the two volumes presenting the images through the red areas (Figure 6(b) and (c)). Volumetric porosity was calculated as a complement to 100% to packing density and was measured for all experimental double-layered fabrics with connecting points in the same manner demonstrated for the 2 cm × 2 cm fabric example (Figure 6). Figure 7 shows the microCT cross-sectional images of all experimental fabrics.

Cross-sectional images of experimental woven fabrics obtained via microcomputed tomogaphy (microCT): (a) 1 cm × 1 cm, (b) 2 cm × 2 cm, (c) 3 cm × 3 cm, (d) 4 cm × 4 cm, and (e) 5 cm × 5 cm.
Thickness testing of double-layered woven fabrics
The thickness of the experimental woven fabrics was measured using three methods to analyze the influence of the measurement conditions on the thickness of 3D woven fabrics. The first measurement method was conducted on a thickness gage with a pressure plate having a disk area of 2000 ± 20 mm, disk pressure of 1 kPa, and a base plate with a flat top surface for sample placement. The measurement was repeated three times for statistical evaluation of the data. The second measurement method involved analyzing the images obtained from microCT (SkyScan 1272, camera pixel size = 7.4 μm). Figure 7 shows the images for subsequent thickness measurements. The image was cropped so that only the repeat of the double-woven fabric was analyzed (Figure 7).
Subsequently, the binary surface of the double-woven fabric image was smoothened using color image thresholding and morphological closure operation. This was followed by the measurement of the shortest distance of the two perpendiculars to the object surface of the double-layered woven fabric. The thickness of the single woven fabric was also measured using these images. The third measurement method involved image analysis of macroscope images. A special macroscope (Navitar stereomicroscope (magnification of 1–6.5× (with additional optics of 5–416×, Nikon camera, NIS-Elements 5 image analysis))) with a sliding motorized stage was used to obtain composite images of all experimental woven fabrics (Figure 8).

Cross-sectional images of the experimental woven fabric obtained using a macroscope: (a) 1 cm × 1 cm, (b) 2 cm×2 cm, (c) 3 cm × 3 cm, (d) 4 cm × 4 cm, and (e) 5 cm × 5 cm. The tip of the pin marks the connecting point.
Results and discussion
Structure of double-layered fabrics with connecting points
The following general assumptions are made regarding the structure of double-layered woven fabrics with connecting points. (1) Fabrics with different woven distributions are identical in terms of the structure of “upper” and “lower” fabrics in the warp and weft directions (square fabrics). (2) The connecting points between two square fabrics should have only a fixing function (fixing of two fabrics at a defined mutual position). (3) The existence and distribution of connecting points within a given double-layered interlaced fabric should ensure that two woven fabrics are fixed exactly on top of each other and that there should be no shifting of horizontal or vertical fabric layers relative to each other. The shifting of vertical and horizontal woven fabric layers was verified through the differentiation between the “top” and “bottom” fabrics in the experimental double-layered woven fabrics. Analysis of the shifting of layers is essential for the treatment of double-layered woven reinforcements in composites. (4) The existence and distribution of connecting points should not affect the shape of the binding waves of individual woven fabrics. The effect of connecting points on the shape of binding waves is evaluated using the skewness data of the contours of the “top” and “bottom” fabrics in the experimental double-layered woven fabrics. (5) The distribution of connecting points will or will not affect the volumetric porosity and thickness of the double-layered woven fabrics. Both the volumetric porosity and thickness of the double-layered woven fabrics increase with increasing distance between connecting points. Monitoring volumetric porosity and fabric thickness is important for future processing of composites, especially in terms of matrix options.
Vertical fabric layer shifting
The difference of cross-section layers in 3D experimental samples was calculated from the coordinates of the contour functions of the binding waves of the upper and lower woven fabrics for each section (Figure 5). The mean differences of cross-section layers were used for evaluation of the vertical layer shifting, that is, statistically significant differences in thicknesses within a single double-layered fabric with defined connecting point. Figure 9 shows the mean values of the differences and the confidence intervals for the cross-sections of individual thread markings 01–04 (Figures 3 and 4) of all experimental woven fabrics with connecting points distributed from 1 cm × 1 cm to 5 cm × 5 cm.

Mean difference of all cross-section layers of all experimental woven fabrics.
Pairwise comparison revealed statistically significant differences in thickness between cross-sections closer to the connecting points (threads 02 and 03; Figure 3), indicating a smaller thickness. Additionally, statistically significant differences in thickness were observed between cross-sections farther from the connecting points (threads 01 and 04; see Figure 3), indicating larger thickness. Thus, a connecting point has a statistically significant effect on the shifting of vertical fabric layers for all experimental woven fabrics.
Statistically insignificant differences were also observed between double-layered woven fabrics with connecting points 1 cm × 1 cm and 4 cm × 4 cm, compared with distributions of 2 cm × 2 cm, 3 cm × 3 cm, and 5 cm × 5 cm.
Regarding shifting of vertical layers, the distribution of connecting points exhibits a statistically significant influence on the distance of individual woven fabrics in a double-layered woven fabric. As expected, the smallest vertical layer shifting and the largest vertical layer shifting for the double-layered woven fabric occur at distribution of 1 cm × 1 cm and 5 cm × 5 cm, respectively.
Horizontal fabric layer shifting
The plots in Figure 10(a) and (b) show examples of two functions in phase and in opposite phase. The coefficient of variation (CV) value of the average difference of the two functions is added to the plots and is equal to zero for the case of functions in phase (Figure 10(a)) and ~35.45% for the other extreme case (Figure 10(b)). The CV values of the average differences were used to evaluate the shifting of horizontal fabric layers.

Shifting of horizontal fabric layers: (a) two functions in phase, showing their difference and CV of its mean value and (b) two functions in the opposite phase, showing their difference and CV of its mean value.
Figure 11 shows the CV differences for all tested thread markings 01–04 of all experimental woven fabrics.

Horizontal coefficient of variation (CV) of the mean differences of layers of all cross-section threads 01–04 of all experimental woven fabrics.
A green line indicating the CV difference value for the function in the opposite phase is also plotted (Figure 10(b)).
Statistical significance of the difference in CV values was tested via t-test by differentiating from the cutoff value of 35.45%. The woven fabric with connecting point distributions of 1 cm × 1 cm and 3 cm × 3 cm exhibited a statistically insignificant difference from this value. The binding waves of the “top” and “bottom” fabrics of these double-layered fabrics most likely occurred in the opposite phase (see Figure 10(b)).
Analysis of variance (ANOVA) of the difference in CV showed a statistically significant difference for the woven fabric with a connecting point distribution of 2 cm × 2 cm from the others (Figure 11).
ANOVA also determined the statistically significant effect of the distribution of connecting points on the shifting of horizontal fabric layers. Unfortunately, the connecting points cause the shifting of horizontal fabric layers, which is more akin to the arrangement shown in Figure 10(b). According to the CV values of the difference of layers of all cross-section threads 01–04 of all experimental woven fabrics (Figure 11), any dependence cannot be indicated, for example, the shorter is the distance of couplings, the less is the shifting of horizontal fabric layers.
Symmetry of the binding waves of individual fabrics in double-layered woven fabric and between two layers of woven fabric
Figures 3–5 show the processing of microCT images (cross-sections). The original data from the microCT images must be eliminated to a binding wave of the weave repeat because the periodicity of the binding waves is assumed to be alternating from their physical nature. The skewness of the adjusted data was also assessed. Each symmetric distribution of the data has a skewness of zero. If the skewness is >0, then most of the data is above the mean value and vice versa. Figure 12(a) and (b) illustrate the waveforms of the symmetric and nonsymmetric functions along with the calculated skewness values of the data.

(a) Symmetrical function and its skewness and (b) nonsymmetric function and its skewness.
Table 2 summarizes the values of the calculated skewness data of the binding wave contours of the individual experimental double-layered woven fabrics.
Skewness of the binding wave data; the last row indicates the pivot range of the average skewness value for each double-layered woven fabric.
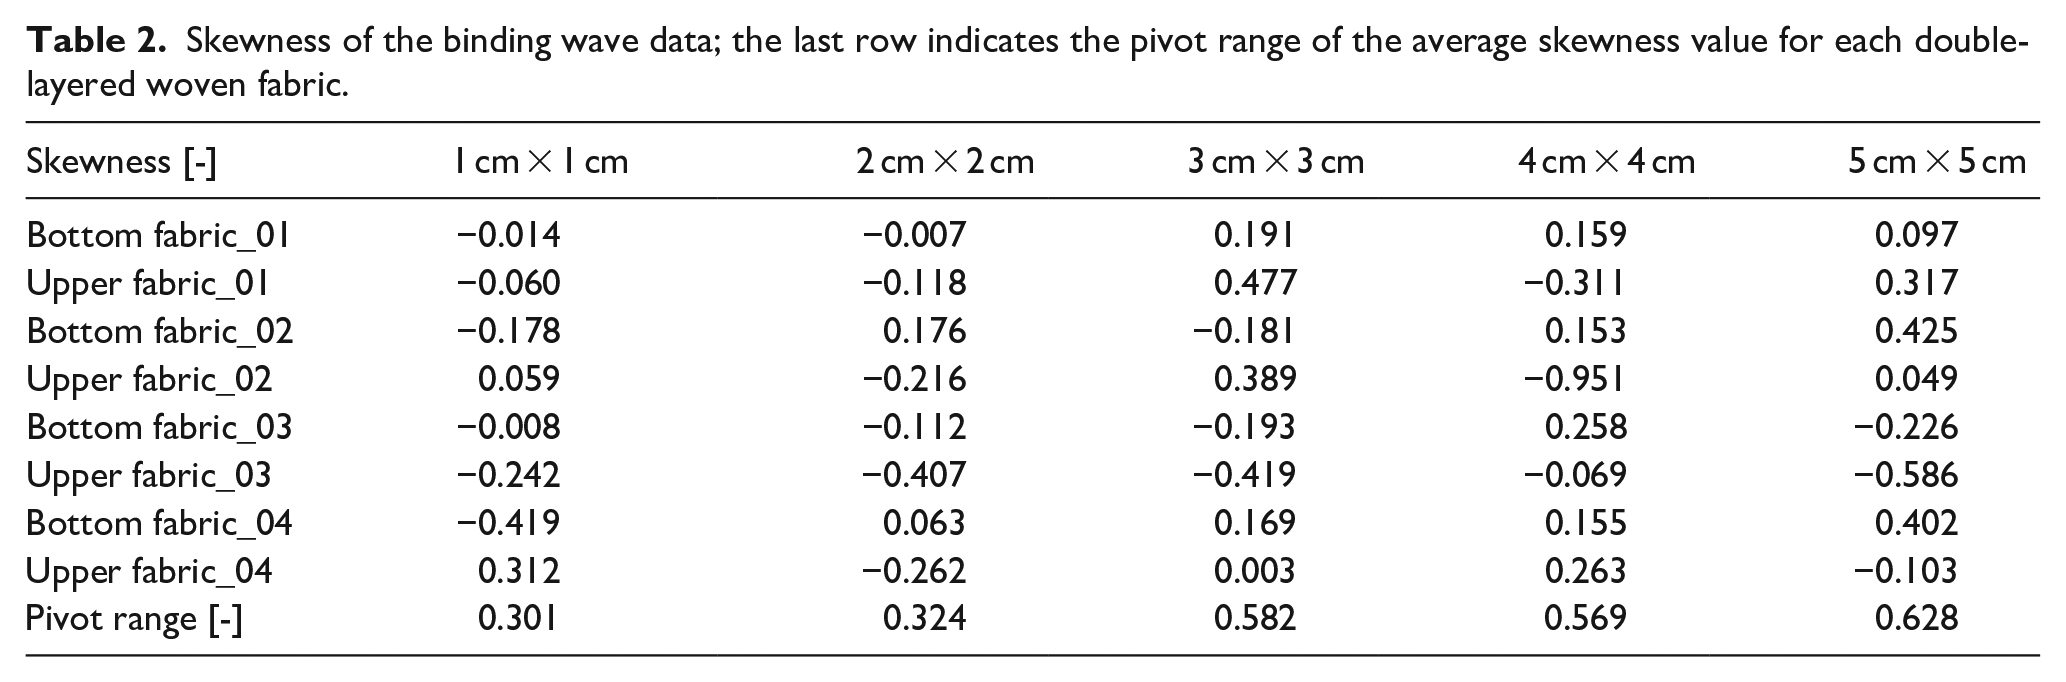
Figure 13 presents the average values of the skewness of the binding wave data along with their variability through confidence intervals.

Average skewness of data of all experimental double-layered woven fabrics.
Table 2 presents a basic variance (pivot range) for individual experimental fabrics (see last row in Table 2). Individual data skewness was also subjected to a more detailed ANOVA and pairwise comparisons.
In Table 2, the skewness values significantly different from 0 are marked in red. The binding waves for the woven fabric with connecting point distributions of 3 cm × 3 cm and 5 cm × 5 cm are more often asymmetric than for the other three woven fabric types. Based on the variability of the mean skewness value, the woven fabric with connecting point distributions of 1 cm × 1 cm and 2 cm × 2 cm exhibits comparable (lower) variability, while the remaining three double-layered woven fabrics exhibit higher variability.
A one-way ANOVA evaluated the nonsignificant effect of the factor, that is, distribution of connecting points in the double-layered woven fabric, on the symmetry of the binding wave contours of individual fabrics. As mentioned earlier, a significant deviation of skewness from zero was observed for some data; however, no statistically significant difference in symmetry was found between the individual binding weaves through pairwise comparison.
The binding wave contours of the individual woven fabrics are generally symmetrical. Nevertheless, greater dispersion of symmetry is observed for 3 cm × 3 cm, 4 cm × 4 cm, and 5 cm × 5 cm woven fabrics. However, individual woven fabrics within a single fabric and between double-layered woven fabrics exhibited statistically insignificant differences in symmetry. ANOVA confirmed the statistically insignificant effect of connecting point distribution on the binding wave symmetry of individual fabrics within the double-layered woven fabric. Thus, was confirmed the assumption that connecting points (their existence and distribution) do not statistically significantly affect the shape (symmetry) of the binding waves of individual woven fabrics.
Volumetric porosity of double-layered woven fabrics: Principle of evaluation from microCT images
Based on the observed volumetric porosity of double-layered fabrics (Table 3), the volumetric porosity is dependent on the type of double-layered woven fabrics with different connecting points (see Figure 14).
Summary of the packing density and volumetric porosity values of the tested double-layered woven fabrics.


Volumetric porosity of the tested double-layered woven fabrics with connecting points.
The correlation is considerably high (correlation coefficient is 0.95). Therefore, more distant connecting points will offer more space in the final reinforcement.
The connecting points that are closer together (1 cm×1 cm) are likely to cause a forced approach of the “top” and “bottom” fabrics and thus lead to relatively low volumetric porosity values. A porosity value of 0.43 for a 1 cm × 1 cm fabric approximately corresponds to the volumetric porosity of a single fabric. Furthermore, the more distant connecting points (for a 2 cm × 2 cm fabric) create a space between the fabrics, leading to an increase in volumetric porosity. This trend is considerably linear, but there is no clarity on what should be distance between the connecting points.
Analysis of double-layered woven fabric thickness
Thickness measurement via image analysis of macroscope images was performed both interactively and through automatic measurements on binary images prepared via subjective Bezier curve marking. The central region of the double-layered woven fabric between the two connecting points was marked (similar to the procedure used for microRT images). Only one measurement was realized each time for a given type of double-layered woven fabric. Table 4 present the results obtained from the analysis of macroscope images for both approaches.
Results of thickness measurements of the experimental woven fabrics obtained using different approaches.

Figure 15 shows a graphical comparison of the thickness values of experimental double-layered woven fabrics measured using different approaches.

Thickness of experimental woven fabrics obtained using different approaches.
The thickness values obtained using the thickness gage are the lowest among the thickness values obtained using other approaches. The applied pressure of 1 kPa plays a major role in controlling the thickness of volumetric or multilayered interlaced woven fabrics.
In most cases, the thickness values obtained via microCT are identical (or very close) to the values obtained using the macroscope. Interestingly, the sample position (horizontal position for the macroscope (Figure 8) and vertical position for microCT (Figure 7)) has no effect on the resulting thickness values obtained without loading the sample. The distance of two fabrics in double-layered woven fabrics is given by the connecting points where the points do not let two fabrics above each other closer together.
The comparison of the thickness values of a single fabric obtained via microCT (a woven fabric layered without connecting points (layer of two single woven fabrics)) with the other thickness values of the double-layered woven fabrics with connecting points showed that this thickness values is comparable with the thickness values of the double-layered fabrics measured at 1 kPa pressure on the thickness gage (Figure 15). However, a marked difference was observed compared with the thickness values of the double-layered interlaced woven fabrics measured without load (microCT, macro_int, macro_auto), showing the distinct influence of the presence of the connecting points on the thickness of the double-layered woven fabric with connecting points.
Based on the high values of the correlation coefficients for all approaches of thickness measurements without pressure < 0.84; 0.97>, the thickness tends to increase with increasing distance of the connecting points in the double-layered woven fabrics. In this case, the connecting points create an interlacing of the layers, reducing the air gap between the layers, where the compactness of the layers increases and the thickness of the resulting 3D woven fabric decreases based on the internal forces derived from the interlacing. The space created between the layers of individual woven fabrics placed on top of each other grows as the distance between the connecting points increases, leading to an increase in thickness.
Conclusions
This study focused on the analysis of differences in the internal geometry of multilayered woven reinforcements with different frequency and distribution of connecting interlaced points in double-layered woven fabrics made from basalt fibers. X-ray microCT images and the NIS-elements software were used to analyze the internal microstructure of five different double-layered interlaced woven fabrics. The results showed that the connecting points in the double-layered interlaced woven fabric statistically significantly affect the shifting of vertical fabric layers in all types of double-layered interlaced woven fabrics. The double-layered interlaced woven fabric has a lower thickness in the immediate vicinity of the connecting point than at the following interlacing point. Furthermore, the existence and distribution of connecting points in double-layered interlaced woven fabrics do not statistically significantly affect the symmetry of woven fabric binding waves in all types of double-layered interlaced woven fabrics. The distribution of connecting points in the double-layered woven fabrics affects the volumetric porosity and thickness of the double-layered interlaced woven fabrics. The results of this study show that different frequency and distribution of connecting interlaced points in multilayered woven reinforcement influence the internal structure of a woven reinforcement. Connecting interlaced points in multilayered woven fabric provides layer stability. This is because the layers cannot slide on each other and change position, leading to the stability of the woven reinforcement. In case of composites, the number of connecting points and their distribution in the woven reinforcement can change the stiffness of the reinforcement. The volumetric porosity and thickness affected by the distribution of connecting points can affect the saturation of the matrices during the preparation of composites. A follow-up study will investigate the influence of connecting points on the mechanical properties of the woven reinforcement in composites.
Footnotes
Declaration of conflicting interests
The author(s) declared no potential conflicts of interest with respect to the research, authorship, and/or publication of this article.
Funding
The author(s) disclosed receipt of the following financial support for the research, authorship, and/or publication of this article: This work was funded by the Ministry of Education, Youth and Sports of the Czech Republic and the European Union-European Structural and Investment Funds in the Frames of Operational Program Research, Development and Education-Project Hybrid Materials for Hierarchical Structures [HyHi, Reg. No. CZ.02.1.01/0.0/0.0/16_019/0000843].