
Abstract
The present research signifies a new modeling method for calculating the stiffness of braided composites. In previous works, the modeling approach has been related to repetitive unit cells for analysis of braided composites based on a single area or a few added areas. Also, no confirmed modeling method has recently been available for braided composites because of different fibers’ configuration considerations. Therefore, there is no preferred one, and fiber bundle arrangements are complex in practicality; it is unclear whether their shape is straight or curved. Also, the previously proposed mesoscale repetitive unit cell models have many elements and nodes in the finite element analysis phase, so applying periodic boundary and mesh conditions can mislead the results when they are used. So current research proposes a multi-cell multi-domain strategy and verifies it for modeling and computation of mechanical properties while showing the significance of braiding path and manufacturing process. The currently proposed method is tested with selected sections’ configuration and shown for actual braided composites’ scenario. So, according to the literature, the section is modeled as a complex shape with a squeezing effect. Then, that model is analyzed, and calculated properties are verified by the existing methods and found results with a maximum and minimum difference of 2.7% and 0.25%, respectively. Afterward, it is divided into cells, which are then analyzed and checked to determine which number of simplistic division stages can represent a section. It is found that a minimum of 15 divisions can be defined with a maximum 2% difference, and over that has approximately the same results as of the current considered section model. Additionally, the study examines how the elastic constants of 2D braided composites are influenced by the braiding angle and fiber volume fractions.
Keywords
Introduction
Textile composites are involved in many useful applications, such as marine, aerospace, and automobiles, due to their shear and transverse strength, impact, and fatigue resistance. Researchers have recently investigated braided composites in emerging scenarios to calculate mechanical properties under the elastic limit. The yarn angles and fiber volume fractions are essential parameters in characterization. However, analysis of big-scale heterogeneous structures may lead to inaccuracy, and small-scale repetition makes a complete structure. So, most of the calculation processes are dependent on repetitive sections. Therefore, it is recommended to choose better repetitive sections for exactness. 1 Textile composites contain yarns (fiber bundles), which are constituents of fibers and matrices, and yarns and matrices make a repetitive unit cell model.
The previously studied few famous models are the fiber interlock model, 2 fiber inclined model, 3 helix geometry model,4,5 and three-unit cell model. 6 The maximum strain energy concept underpinned the fiber interlock approach, while the fiber inclination model relied on the revised classical laminate concept. The Helix geometry model was created by merging textile engineering techniques with a customized laminate theory. The 3 -unit cell model used a mixed volume averaging approach to estimate the mechanical behavior. In their approach, the out-plane moduli were determined by volume averaging compliance, and the in-plane moduli were calculated by averaging volume stiffness. These early-stage modeling strategies are simplified. Additionally, those did not count the interface state between the yarns and the matrix. Rather than a uniform trajectory of yarn, Chen et al. worked on thetrajectory in different regions. 7 They demonstrated that three of the composite’s areas exhibit unique characteristics. The inner area is less rigid than the surface and corner sections. Different shapes of unit cells were also considered by researchers, such as 3D braided tabular 8 and rectangular9,10 for mesoscale models. Wang et al. established the tabular model which is based on the free-form deformation (FFD) strategy. Planar and spatial yarn pathways were examined using tabular preform when modeling the unit cell. The creation of the FGM (fabric geometric modeling) and the subunit-cell representations were also subjected to this modeling strategy. 8 Wang et al. proposed a way to simulate an effective braided preform and stated that especially for complicated or large-size parts. This motion concept was dependent on the PBR technique that was supposed to reduce computing time. 9 Zhang et al. investigated a technique for creating a representative unit cell modeling and performing finite element method by combining Matlab and Abaqus. the accuracy of the computed results was reduced for large braiding angles. 10 Meanwhile, various braiding techniques were introduced those can be understood by their name, such as maypole (like a maypole dance pattern; includes flat and tabular), cartesian (like a rectangular), lace (like a tightening pattern), and spiral (like a continuity around an axis) etcetera. 11
The geometric frameworks in the above-mentioned research relied on some assumptions, and they did not completely consider the actual geometric form of the braiding yarns (variation of cross-section, undulation, jamming, and crimp). Additionally, most of them employed the traditional lamination theory, which was less effective in estimating shear moduli and out-plane parameters with related non-linearities. In the development phase, for modeling and analyzing textile composites, Lomov et al. presented the micro/mesoscale model for textile geometry, specifically for woven composites. They provided a tool for mechanical properties and processing. They also incorporated modeling of resin flow, micro-mechanical property calculations, and micro-macro analysis of composite parts using virtual reality software and finite element models. They discussed the family of models, which employed a uniform description of the reinforcing unit cell’s geometry.12,13 Szostkiewicz and Hamelin presented three numerical textile composite microstructure models to demonstrate numerical and experimental stiffness characterization techniques for soft composite textile membranes used in fabric roof constructions. The fabric in the first two models, known as the “Crimp Model,” was modeled as a stack of unidirectionally reinforced layers based on the laminated thin plate theory. The elastic properties were determined by assembling the meshing components in the third, which took a geometrical approach to the fabric’s basic cell. 14 Prodromou et al. predicted the mechanical behavior of textile-reinforced composites with two meso-mechanical approaches. Their models considered the crimp, matrix distribution, and interactions between the yarns. Cagri and Jason presented an analytical study to predict the longitudinal elastic modulus of two-dimensional braided composites. They analyzed a small repeating representative block and unit cell of the braided structure to recognize the effects of the curvature of the unit cell on tubular braided composites as a function of the braided tube diameter. 15 Finite element modeling and assessment at the macro and micro levels were used by Xu et al. to predict the effective properties of biaxial and triaxial braided composite materials. 16 Naik et al. established a geometric model for the RUC and chose representative manufacturing parameters for the triaxial braided composite materials. The curved and straight fiber yarns were discretized into yarn slices, and the stiffness averaging method was used to forecast the RUC’s effective stiffness. 17 Boisse et al. presented an experiment using biaxial testing to examine the behavior of the fabric and its potential for taking on a shape. Their work highlighted the impact of geometric non-linearity at the mesh scale on the fabric’s behavior. 18 In the draping and forming calculations scenario, a multi-level simulation approach was utilized by Hamila and Boisse team to forecast the local mechanical characteristics of orthogonal and sheared textile-reinforced composites (especially for woven). They used an interpolation technique to combine the outcomes of the draping simulations with the projected mechanical properties. They presented numerical approaches for draping and forming simulations of textile composites, such as predicting wrinkling with the effect of in-plane shear, tensile, bending, continuous, discrete, and semi-discrete approaches.19 –25 Also, it is crucial to identify the parameters needed to properly design braided composite structures.
Therefore, investigations were conducted into the influence of various materials and fabrication parameters (specifically braiding parameters) on the mechanical properties. In his study, Kim proposed a representative volume model for 2D braided composites and predicted the mechanical properties according to changes in fiber filament size, fiber volume fraction, the gap between adjacent yarns, and braiding angle by the use of yarn slicing technique and stress averaging method. 26 Boris et al. describe the production of biaxial and triaxial braids on a braiding thread. It was shown how the evolution of important factors such as linear mass and braiding angle has changed. Different types of braid are also considered with the analysis and comparison of the mechanical behavior in relation to the braiding angle. 27 Zhang et al. presented the tensile and compressive tests using standardized testing methods for braided composites manufactured by resin transfer molding (RTM). It was found that the mechanical properties of the braided composites decreased with an increasing braiding angle. 28 In their experimental study on the tensile behavior of biaxial braids, Harte and Fleck demonstrate how the axial strain increases as a function of the braiding angle. 29 Thus, the braiding angle is a crucial variable in the kinematic analysis,30,31 affecting the braided composites’ mechanical behavior.32 –35
So far, different approaches have been applied to calculate mechanical properties, such as analytical, numerical, semi-numerical, and experimental. The numerical method is found to be useful and accurate in calculating the behavior of such complex structures. 36 However, despite having good predictions, the finite element (FE) model requires intricate geometric modeling and takes a long time to calculate. Moreover, it is laborious since every time the fabric geometry changes, the FE geometry needs to be rebuilt. Also, the yarn’s actual shape is not fixed; it changes according to the process and machines’ preform, such as a rod or curve with different cross-sections, and their discretization involves high computational work. Furthermore, there is no distinct domain, which means it changes according to the path, as shown in Figure 1. So, it is necessary to propose a method for modeling advanced composites such as braided composites to cover their accurate shape and calculations according to the manufacturing situation to quantify each domain of structures. The division of braided sections at a small level based on the cyclic nature of the manufacturing process is the solution to obtain accuracy in shape and simplify the calculation process. The manuscript presents a method to show the modeling strategy. This involves selecting domains and dividing them into cells as uniformly as possible according to manufacturing. Thus, this research performs an easy-handling calculation method for complex shapes to capture accurate manufacturing details in design and analysis. Also, the effect of two important factors (braiding angle and fiber volume fraction) on mechanical properties is studied. The existing methods verify the current analysis results in results and discussion sections followed by a conclusion.

Braiding configuration condition.
Methodology
Modeling
The braided textile two-dimensional section model is considered with yarns’ shape and matrix according to the textile profile (Figure 1) to show the proposed strategy. The considered section model is modeled along with yarn and matrix in Abaqus commercial code with a 1.51 × 2.72 mm dimension, according to the braiding conditions. It is considered matching to the literature to verify the current method.37 –39 The curve shape of the model is chosen so that the method would be accurately accessible for any other known situations. Further, corresponding to the current approach, the model is divided into 20, 15, 10, 8, 5, 3, and 1 cell, each including 0.136, 0.181, 0.272, 0.34, 0.544, 0.906, and 2.72 mm in length, respectively with the same width (1.51 mm). The simplified straight and angular cells are obtained according to the yarn arrangement. The different configurations of cells can cover the final section variation by their combinations according to rotating symmetry. Models contain both matrix and yarn. The yarn is a bundle of fibers, and it is directly related to braiding manufacturing. This is why it is homogenized with fiber and matrix properties. The packing with a 0.524 fiber volume fraction is involved inside a yarn, as shown in Figure 2. The yarn diameter is constant inside the cell, which is 0.78 mm. The volume fraction of yarn in the cell is 0.516. Figure 3 shows the division strategy for cells, and Figure 4 shows the schematic concept of the current strategy.

Microscale cell model.

Braiding section with division’s strategy: (a) textile section model, (b) 20 cells, (c) 15 cells, (d) 10 cells, (e) 8 cells, (f) 5 cells, (g) 3 cells, and (h) 1 cell.

Schematic division strategy for textile composites.
Based on the current modeling strategy, the final analysis cells are 5, 6, 9, 10, 11, and 12, indicated by the green dotted box in Figure 4. The cell division process will be like that to be stopped when the yarn number and its configuration are simplified to capture the yarn’s details and shapes. At that stage, yarns are straight (not uneven by geometry) with fewer elements in number for FEM so that analysis (mesh, boundary, and load conditions) will be cost-effective and easily handled. In addition, their rotating symmetry relations are useful in the calculation stage.
The manufacturing of braided composites follows a cyclic process, so if there are different regions after manufacturing, sections can be selected from those regions. Sections cover the representation of distinct areas; those can be divided into cells. Final cells are treated for numerical/analytical calculations. This strategy can cover complex composite shapes according to the manufacturing path and be suitable for predesign with predefined cells according to manufacturing conditions.
Analysis
First, utilizing fiber and matrix qualities, micromechanics is used to generate yarn properties. The fiber and matrix properties are shown in Table 1. The results and discussion section presents the micro-mechanics results and their verifications. The Chamis 40 model equations (1)–(4) are used for verifications.


Material properties are used in the section model at the microscale. 41

In further analysis, the obtained yarn mechanical properties are used for the yarns’ sections and cells. The 1 or 2 denotes properties in the fiber direction for the fiber and matrix inside the yarn. Yarn and matrix properties will be the input of the materials parameters for the considered braided section and its cells analysis.
After calculating yarn properties, the numerical analysis is carried out for the complex considered modeled section. Meshing is applied to the section cell. An adequate structure mesh and sizes are chosen, which are fine enough to capture accurate geometry. The material heterogeneity is maintained with element orientations. The discretization is done such that the pair of nodes at opposite boundaries should be the same. That is required to apply periodic boundary conditions (PBCs). 42 The PBCs are applied to produce pure tension and shear behavior according to homogenization requirements. Python code is used to apply PBCs as per the equations (5)–(8). The displacement constraint is introduced to the code of the constraint equations by defining the reference point (RP), which provides the required degrees of freedom to operate the essential response of the cells and divisions. The form of the equation set is represented by equation (5).

where k+ and k− indicate the kth pair of opposite parallel objects’ (edges and corners) relative periodic node sets, and
For edge and corner


By choosing the magnitudes of

where Sij is the effective compliance matrix, σ j , and ɛ i are the global averaging stress and strain, respectively, which is defined by
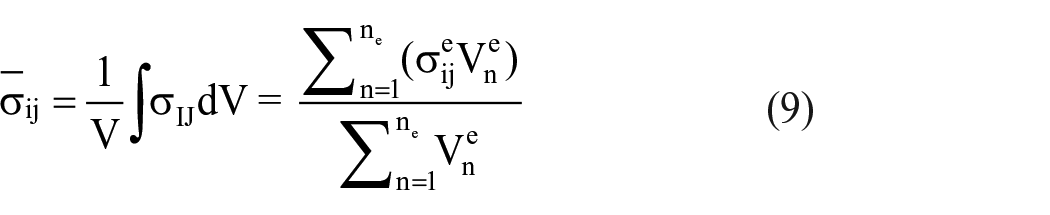

Where


where 12 denotes inplane notation

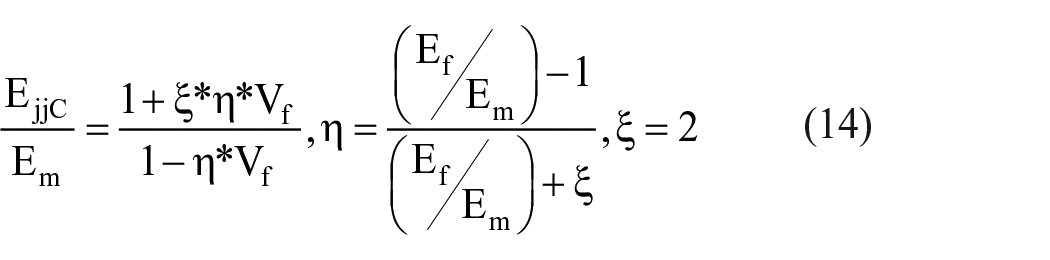
Then mechanical properties of each cell (for 20, 15, 10, 8, 5, 3, and 1 case) are calculated according to equations ((13)−(21)). Equations ((19)−(20)) are the rotational transformations for angular conditions. Finally, each cell’s properties are combined (equation (22)) for all cases to calculate the final effective mechanical properties (equation (23)) of the textile section in every division situation by using the volume averaging method. 32

(Vn = volume fraction of cells for each case)

Results and discussion
The division strategy is proposed for braided composites because the yarns’ shape is not affirmed. In the current method, the actual shape can be covered at a small-scale length compared to big-length repetitive volume, as it has less curve effect. If considered, the actual braided sections’ results are the same as divisions’ results. Then this strategy can be used for complex-shaped composites to capture actual manufacturing conditions. In the current analysis, yarn properties are calculated by fiber and matrix properties based on the model (Figure 2). In the micro-mechanical analysis of unidirectional fibers, the longitudinal and transverse modulus calculations show iso strain and iso stress behavior, respectively. The contour plots of micro-mechanics results are shown in Figure 5. After analysis, equations (8)–(12) used to calculate yarn properties those are, E11 = 122, E22 = 10.13, G12 = 9 GPa, ν12 = 0.302. The yarn properties are verified with the Chamis 40 formula (equations (1)–(4)) and found significant accuracy with a maximum approximate 1.85% difference. A little discrepancy is found in analytical and numerical calculations due to assumption (iso-stress/strain) in analytic/empirical relations and numerical calculations’ mesh effectivity in integration and stabilization at interface and boundary conditions.

Nephograms of microscale cell.
Afterward, mechanical properties are calculated for the selected textile section and its divisional cells as input of the above-mentioned yarn and matrix mechanical properties. The contour results plots are shown in Figure 6. The deformations are the same on opposite nodes, showing the accuracy of boundary conditions in analysis. The nephogram (Figure 6(a)) shows that yarn is the braided composite’s main load controller because the stress is high in the yarn region. Also, stress is concentrated in the tension and shear situations at the joints of yarn and matrix. The predicted cell model results from the current analysis are compared with the calculation of the well-established analytical/semi-analytical methods to verify the numerical calculation. The section results are compared with existing methods, and after verifying them, divisional results are compared with the sections’ results. The existing methods which are used for comparison are mechanics of structure genome (MSG), 43 Krenchel’s model, 44 bridging model, 45 variational bounding model, 46 schematic for generalized self-consistent method (GSCM), 47 and Mori-Tanaka method. 48 The comparison results are shown in Table 2. The results showed that there is no significant difference between the current and existing method results. Krenchel, GSCM, and variational bounding methods showed a maximum of 1.14%, 2.7%, and 2.78% differences. MSG, Bridging, and Mori-Tanka showed a maximum 0.25%, 1.4%, and 1.14% difference, respectively. Therefore, current results are overpredicted compared to MSG, bridging, and Moritanka methods and underpredicted compared to Krenchel, GSCM, and variational bounding methods. Deviations can be seen due to simplification and assumption in existing analytical calculations, including current modeling variation with numerical approximations and stability. The current method was also compared with the experimental results of those considered 2D textiles with the same materials.49,50 The current longitudinal and shear plane results are 47.35 and 7.83 GPa. Those are 49 and 8.1 GPa, respectively, in experimental calculations. The results show approximately a 3% error from experimental literature. This is because of the slightly different braiding angle (5° more for the current case, which makes it lessens in moduli) and fiber volume fraction (approx. 4% less, which makes it lessens in moduli), conditions, and approximations in analysis.

Stress variations for considered section cell: (a) yarn direction, (b) transverse to yarn, and (c) shear.
Comparison of cell models’ predicted mechanical properties with the existing method and divisions’ strategy.

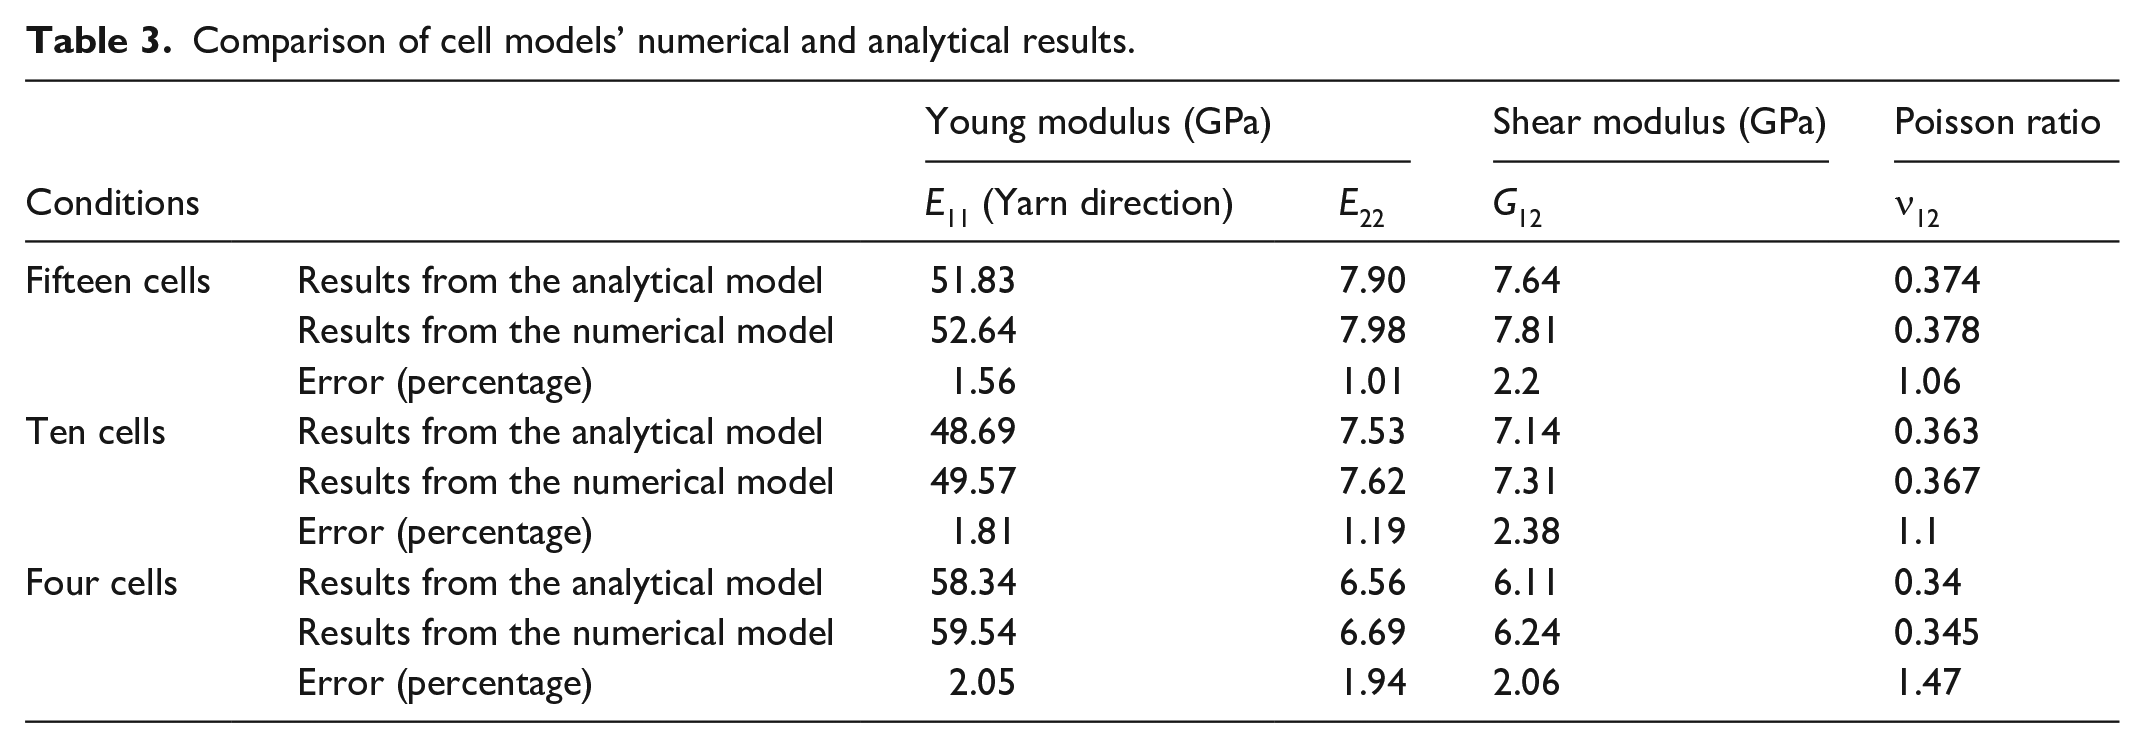
Then divisional results are compared with section results to check which stage of simplistic division can cover the exact shape and configurations. The division’s properties are calculated analytically and numerically, the nephograms of numerical calculations are shown in Figures 6 and 7, and analytical calculations are based on described equations (13)–(21). Equations (22) and (23) are common in both calculations for final averaging. In Table 2, the mechanical properties of each division condition are compared to those of the section model. It shows that 20 divisions of a chosen section model produce approximately the same results. In the case of 15 divisions, the 2.08% maximum deviation is found, and it goes up to 8.66% for 10 divisions. For eight, five, three, and one-cell conditions, the maximum relative percentage error from the actual section model is 12.72, 17.18, 30.72, and 33.08, respectively. For numerical comparison, a few division (high and low to check for a range) results are checked with numerical calculations, which show maximum 2.2%, 2.38%, and 2.06% differences for 20, 10, and 4 divisions, respectively, as shown in Table 3. In Figures 6 and 7, according to modeling, 1 and 2 represents yarn and it’s transverse directions, respectively.

Nephograms from numerical analysis: (a) 20 cells, (b) 15 cells, and (c) 4 cells.
Comparison of cell models’ numerical and analytical results.
The normalized stress (σ)-strain (ԑ) graph is plotted for the yarn direction (loading direction) as shown in Figure 8, which indicates the different division conditions with the actual cell model (Textile section model). The tensile strength (σu) from yarn and matrix for braided section and cells is 1012 MPa for stress to strength normalization, assumed by the rule of a mixture from fiber and matrix (Table 1), followed by yarn and matrix by their volume percentage and strength in the yarn direction (for yarn 3528 × 0.524 + 80 × (1–0.524) = 1886.75, for cells 1886.75 × 0.516 + 80 × (1–0.516) = 1012.3). Results show that 15 and 20 simplified cell conditions can accurately cover the textile section shape in the current work. It can be understood that cells can capture accurate details by simplifying calculations. If exact manufacturing conditions are known, then that can be applied according to their braiding details. Also, in a predesign situation where fiber configuration is unknown, choosing cells at a small level rather than a random unit cell is better because it can cover curves and straight sections.
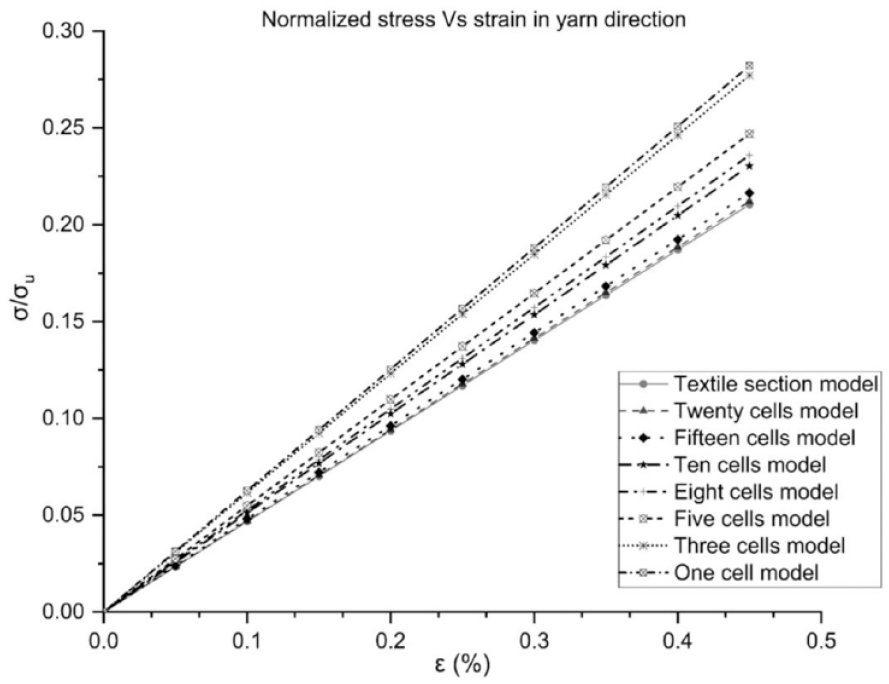
Comparison of tensile stress in yarn direction from different models.
The current strategy is suggested because no confirmed design method is available, which means existing calculation methods consider different yarns‘ configurations, such as circular, hexagonal, octagonal, etc., for predicting mechanical behavior. Therefore, there is no uniqueness to select. There are complex aids for normal recognition, which implies yarns’ shapes are uneven in realism (not confirmed whether they are straight or curved). So, it can be overcome by dividing the composites’ sections according to the manufacturing pattern into simplified cells, and easy calculations can be made. Also, for the numerical calculations in the FE model, the effective properties can be obtained with fewer errors than others for boundary and mesh conditions, leading to accuracy and saving time. Likewise, the contact between yarn and yarn and matrix can be covered better than previously proposed models because of multi-field conditions and smaller scale cells with fewer elements and nodes in the FE model. The proposed approach cells can capture different braiding patterns by rotating symmetry and combinations while covering the multi-area. The finer to coarser division makes a difference in results, so if it is according to the manufacturing process and fiber path, accurate details can be obtained. This is why randomly selecting repetitive areas without knowing the manufacturing conditions can mislead the results. Furthermore, creating cells’ stiffness sets and providing mechanical properties while considering different configurations can save time and cost for complex composites as their combinations can be used for different manufacturing patterns.
Current method can be used for different textiles, as the techniques prioritize creating different structures. However, all techniques have a sequence to produce braiding structures. Processes follow a cycle or a defined pattern around a point or axis that helps to determine the unique symmetrical region (pattern). The section can be selected based on the manufacturing part. Then the current methodology can be applied to select cells of the sections to predict the mechanical behavior. Moreover, the braiding parameters (mainly braiding angle and fiber volume fraction) affect the mechanical properties also covered underneath.
Effect of parameters
Braiding angle and fiber volume percentage are two important structural features that directly govern and affect the overall mechanical properties of braided composites. Figure 9 illustrates the impact of these two parameters on the final mechanical properties. Figure 9 shows the variation of the calculated elastic constants with the braiding angle for three distinct fiber volume fractions. As in the modeling section, 1 and 2 show yarn and its transverse directions. As the braiding angle

Effect of braiding angle and fiber volume fractions on the braided textile section on (a) E11, (b) E22, (c) G12, (d) ν12.
Conclusion
The present strategy is useful for advanced composites. Because of their complicated nature, modeling, and analysis conditions are cumbersome. So, the methodology of the division according to the manufacturing process into smaller cells (compared to the big, manufactured part) is defined and verified in the current manuscript. Current research signifies the essence of the braiding path in the manufacturing process with a calculation strategy to calculate mechanical properties. It is tested that if the cells are taken according to the known fiber route, they give the same results as the textile section model. Also, it saves significant calculation time and cost. In the case of a predesign situation, when manufactured parts are unknown, the cells can be taken as per the braiding details. This is more accurate than randomly selected unit cells because the curved path can also be covered at a small level. The analysis is verified with existing methods (such as Krenchel, bridging, Moritanka ) with a range of 0.25 (MSG) to 2.78 (variational bounding model) percentage difference. It is demonstrated that groupings of cells can cover complex profiles and create comfy analysis situations. – and 15 cells are as accurate as the considered section model, with 0.73 and 2.08% errors.
So, the cells should be chosen based on structural and manufacturing details. These can be selected based on design assumptions if details are not available. As a result, the current modeling technique is effective, and different cells of the braiding area are expected to cover the precise fibers’ path according to the manufacturing cycle point in different domains. The proposed strategy can address exact details with accurate and multi-domain modeling and analysis efforts for advanced composites, especially textile composites. It is tested for curved-shaped complex sections so that it can also be accessible under uniform conditions. The current strategy focuses on simplified divisions. Analytical and numerical manipulation of divisional cells is easy to handle. This is why when there are multiple yarns, the current strategy can also predict mechanical properties accurately under the effect of contact. In the future, this strategy can be applied to calculate the mechanical stiffness and failure behavior of 3D advanced composites.
Footnotes
Acknowledgements
The authors gratefully acknowledge the support and resources provided by INHA University during the conduct of this research work.
Declaration of conflicting interests
The author(s) declared no potential conflicts of interest with respect to the research, authorship, and/or publication of this article.
Funding
The author(s) received no financial support for the research, authorship, and/or publication of this article.