
Abstract
With the development of online shopping platforms, consumers and designers need to choose from a large number of garments when shopping or designing. Quick identification of clothing products can effectively improve the efficiency of designers’ and consumers’ experience. Therefore, this paper used DeepLabV3+ combined with deep separable convolution to improve the network computation speed. To address the problem of low recognition rate of H-shaped silhouette in semantic segmentation, the fuzzy trouser silhouette samples are further analyzed. The trouser silhouette was redefined according to the characteristics of pants, and the dataset labels were optimized with a trouser silhouette classification method. It was found that the accuracy and efficiency of trouser silhouette recognition were significantly improved. The indicators of recall rate, IoU and PA of H silhouette is improved by 6%, 5%, and 1% respectively. After label optimization, the classification prediction accuracy of silhouette V is 100%, the recall of silhouette V is 97%, and the recall of silhouette O is 96%.
Keywords
Introduction
In today’s new retail era, young consumers are the main force of clothing consumption. Online platforms are the easiest way for consumers to get clothing information in their minds. 1 They display clothing information through the image. The advantage of image display is that it is convenient to browse. However, the information conveyed by the image is limited and the characteristics that each consumer can obtain from the image are different. If the characteristics of garments in images can be extracted in an objective way, the objective feature extraction methods can provide consumers with a convenient service. Taking the trouser silhouette as an example, combined with the body type classification study of young Chinese women, 2 the human lower limb body type is more complex. Therefore, it is more difficult for consumers with different leg shapes to choose pants.
According to the classification of trouser character, the silhouettes has been defined as five basic silhouettes (A, H, O, V, X) and two special silhouettes (S, Y). 3 The basic silhouettes are often discussed in related research. Main methods of garment silhouette recognition are based on human feature points and automatic recognition based on deep learning methods. Tao et al. 4 used Ada Boost algorithm to classify clothing silhouettes into A, T, X, H, and O by the relationship of block heights and body-head ratio. Among the five classifications, T and V belong to the same silhouette. This method can accurately classify the clothing silhouette of the fashion show. Stangerup et al. 3 analyzed and identified the six silhouettes (A, H, O, T, X, S) of fashion shows based on data analysis. A, H, O, T, X correspond to basic silhouettes, S correspond to special silhouette. It provides a convenient method for garment trend prediction but plays a smaller role in online clothing shopping. Zhang et al. 5 achieve automatic measurement of A-line traditional Chinese costume by Fuzzy c-means clustering method and key point positioning algorithm. This method is effective and versatile for measuring A silhouette of traditional Chinese costume, but the model should be adjusted for specific silhouettes. Wu et al. 6 classified trousers into five types and use CaffeNet to recognize the silhouette of trousers images. This method can better identify the trousers with small differences. The labels in the dataset mainly rely on subjective judgment, which may affect the accuracy of recognition. Most studies focus on the accuracy of classification, but computational efficiency is also especially important in the process of trouser silhouette recognition.
In this paper, according to the clothing silhouettes and human characteristics, the optimizing classification method for trousers is used to improve computational efficiency. The trouser image dataset is first collected and the trousers in the dataset are classified by silhouette. Then, a convolutional neural network is used for model training. The trained model is able to achieve automatic segmentation and classification of trouser outlines. In order to avoid the problem of the influence of labels on the accuracy of the model during the classification process, the accuracy of the labels in the dataset needs to be improved. By parameterizing and analyzing some samples and optimizing the dataset labels, a more informative trouser silhouette classification model is obtained.
Identification method
The method based on semantic segmentation model and trouser silhouette label optimization was shown in Figure 1. Firstly, a parameterization method based on the silhouette of trousers was proposed for the recognition of confusing trouser silhouettes, then the labels of trouser silhouette dataset were optimized. The model was trained using the dataset before and after label optimization, and the performance of the two models will be compared.

Improved trouser silhouette identification model.
Semantic segmentation model
DeepLabV3+ is considered as one of the most accurate and efficient models for semantic segmentation currently, 7 so the improved algorithm of this paper is based on this model. After extracting features from the backbone, two effective feature layers which are compression of the high and width twice and four times respectively are obtained.
DeepLabV3+ is divided into an encoder and a decoder. Feature extraction is performed in an encoder with parallel Atrous Convolution with different expansion rates 8 for effective feature layers with high semantic features 7 are shown in Figure 2.

DeeplabV3+ network structure.
In the decoder part, the low-level features generated in the backbone network are fed into a 1 × 1 convolution to adjust channels. The feature layer in the high-level semantic feature branch is sampled by four times, which is consistent with the resolution of the low-level feature map. The two feature maps are combined. Then a depth separable convolution is carried out and predicted finally.
Improvement of trousers classification model
The backbone network uses MobileNetV29,10 instead of the original backbone. It uses depthwise separable convolution 11 to reduce parameters and improve computational efficiency. 12 Assuming that DF and DG are the feature layers with the same height and width. Therefore, the computational volume ratio of depthwise convolution and standard convolution is referred to Formula (1). When 3 × 3 deep separable convolution is used in MobileNet, the computation is 1/9–1/8 of standard convolution, with only 1.72% decrease in accuracy (MIoU). 13 This indicates that using the depthwise convolution can improve the computational efficiency without reducing of precision.

Where assuming that the shape of input is DF × DF × M, which means the height and width of the feature map are equal to DF and the number of channels is M. And the output’s shape is DF × DF × N. N is the number of channels of the output feature map. The size of the convolution kernel is DK × DK.
Sample collection of trousers
The existing clothing datasets, DeepFashion 14 and FashionMnist, 15 contain rich clothing categories, but there is no dataset for trouser silhouettes. There are no suitable samples and corresponding learning targets for model training. Therefore, this experiment collected 5291 image samples from online shopping platforms that meet the requirements. The collection criteria of trousers images is that when standing, the posture of the legs does not affect the measurement and observation of the silhouettes of the trousers.
The sample silhouette categories were judged and labeled by people who have experience in apparel professional learning before defining the label. And after learning, all samples were measured and classified manually one by one according to the judgment system constructed by the analysis.
Accuracy analysis of trousers classification
The experiments were based on the Pytorch deep learning framework. The indicators of the evaluation model are Pixel Accuracy (PA), Mean Pixel Accuracy (MPA), Intersection over Union (IoU), Mean Intersection over Union (MIoU), 16 Recall, 17 and Mean Recall (MRecall). PA is the proportion of pixels correctly classified for each category, and MPA is its mean value. Intersection over Union (IoU) is the ratio between the intersection and the union of two sets, the ground truth and the predicted segmentation, and MIoU is the mean value of IoU. Recall is the ratio of the number correctly predicted in a certain class to the number of ground truth of that class, and MRecall is the mean value of all the classes. The above indicators closer to 1, the better the prediction effect is.
The loss value is 0.551 after the model converged. Table 1 shows the scores of each index in the test set, in which the MIoU is 0.83, the MPA is 0.92, and the average recall is 0.90. The overall accuracy rate of MPA is relatively high, while the accuracy rate of MIoU is relatively low. The IoU of H silhouette is 0.73, PA of H silhouette is 0.87, and Recall of H silhouette is 0.82. This indicates that the H silhouette is relatively less accurate compared to the other silhouettes. By analyzing the incorrect test samples of silhouettes, it was found that some of them were not correctly classified due to subjective factors in the dataset labeling. The classification criteria for H and V, A, and O silhouettes are difficult to define, and judgment by experience will lead to inaccurate labels of some samples. Inaccurate labeling can lead to lower prediction accuracy, so ambiguous samples should be analyzed further. Although the recall of X silhouette and the PA of S silhouette also are low, these labels do not need to be optimized because the difference between S-shape and X-shape is higher under human view. To improve the prediction accuracy of H silhouette, the label will be redefined according to the trousers structural features of H, V, A, and O silhouettes.
Model evaluation indexes.

Improved silhouettes classification method
The parameters of the silhouette classification
There are 256 ambiguous samples between A and H silhouettes, 112 ambiguous samples between H and V silhouettes, 100 ambiguous samples between O and V silhouettes, and 468 in total. Because these silhouettes are determined by the relationship between the waist, hip, and knee joint parts of human lower limbs, each sample has been measured and determined by using the six angles (α1, α2, α3, α4, α5, α6) and the ratio (R1, R2, R3) of hip width (HL), knee width (KL), and bottom of trousers width (BL) to waist width (WL) (Figure 3).
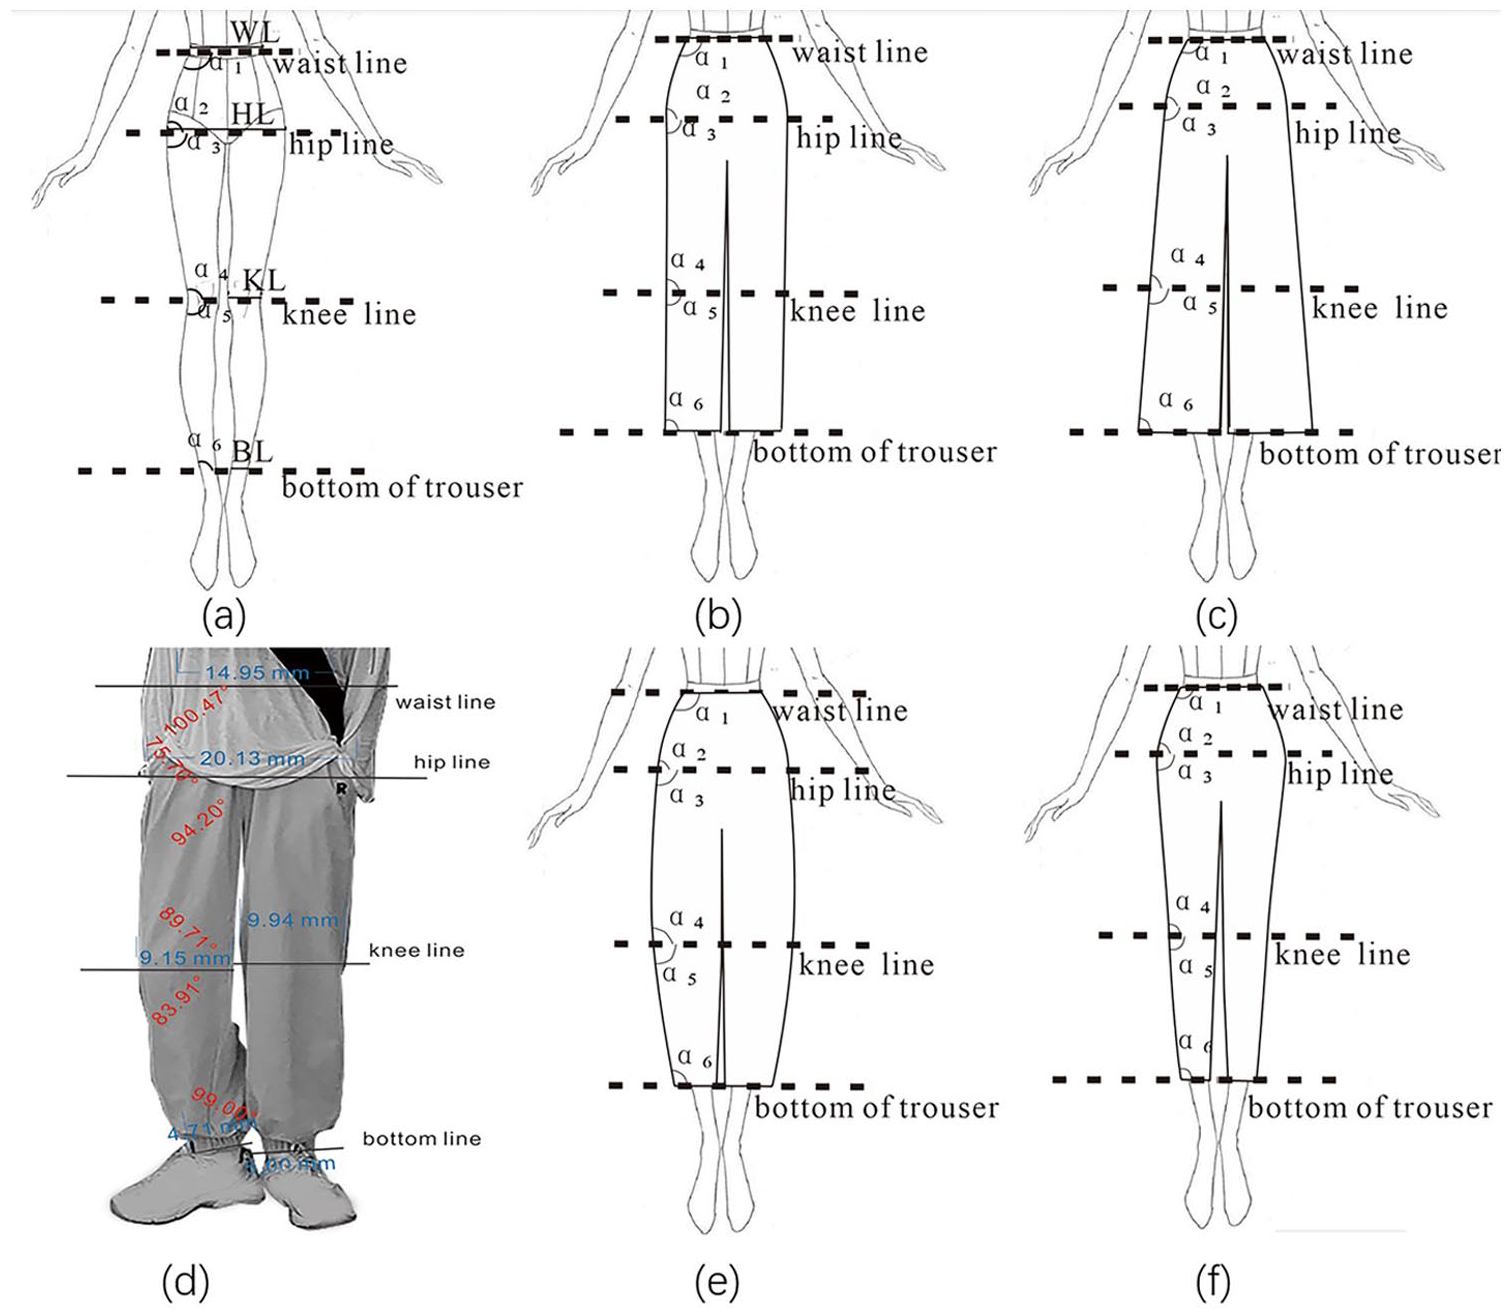
Schematic of measurement positions: (a) schematic diagram of each classification parameter, (b) schematic diagram of H silhouette, (c) schematic diagram of A silhouette, (d) schematic diagram of schematic of actual measurement positions, (e) schematic diagram of O silhouette, and (f) schematic diagram of V silhouette.
The six angles of α1, α2, α3, α4, α5, and α6 reflect the angle near the joint parts of human lower limbs: waist, hip, and knee joint respectively. Ideally, when the angle α1 > 90°, the silhouette of trousers tends to unfold from the waist, which is usually looser, accompanied by a decrease in the angle α2 and vice versa. When the angle α3 > 90°, the trousers are looser at the hip and thigh part, while the angle α4 > 90° causes the trousers to tighten at the knee part and form an arc, while the angle α4 < 90° makes the trousers continue to unfold below the knee and most of the trousers look like A-shape. The angle α5 > 90° means that the trousers are looser in the calf part, while α6 is larger, indicating that the trousers are tightened at the trouser opening, and the angle α6 is smaller, indicating that the trousers still have a looser silhouette at the trouser opening. The variation pattern between the six angles in the ideal state is more complex and more difficult to generalize in practice, and all measured variables are used in the analysis in order to fully analyze and extract the factors.
The three ratios (R1, R2, R3) describe the relationship between the width of joint parts of human lower limbs parts and the waist, and the comparison of the three ratios can help judge the silhouette of the trousers. The relationship of HL, KL, and BL values can visually reflect the overall line direction and silhouette changes of the trouser. To make the data between different samples comparable, the three widths are compared to their respective WL. Ideally, when R1 is close to 1, the trousers are close to a straight shape at the waist and hip, and when R1 > 1, the trousers are loose. When R2 < 1, the trousers are narrower at the knee part and have a loose shape when R2 > 1, When R3 < 1, the trousers are tightened at the bottom of trousers and loose when R3 > 1.

Where HL, KL, BL denote the widths of the hips, knees, and the bottom of the trousers respectively. And WL denote the width of waist.
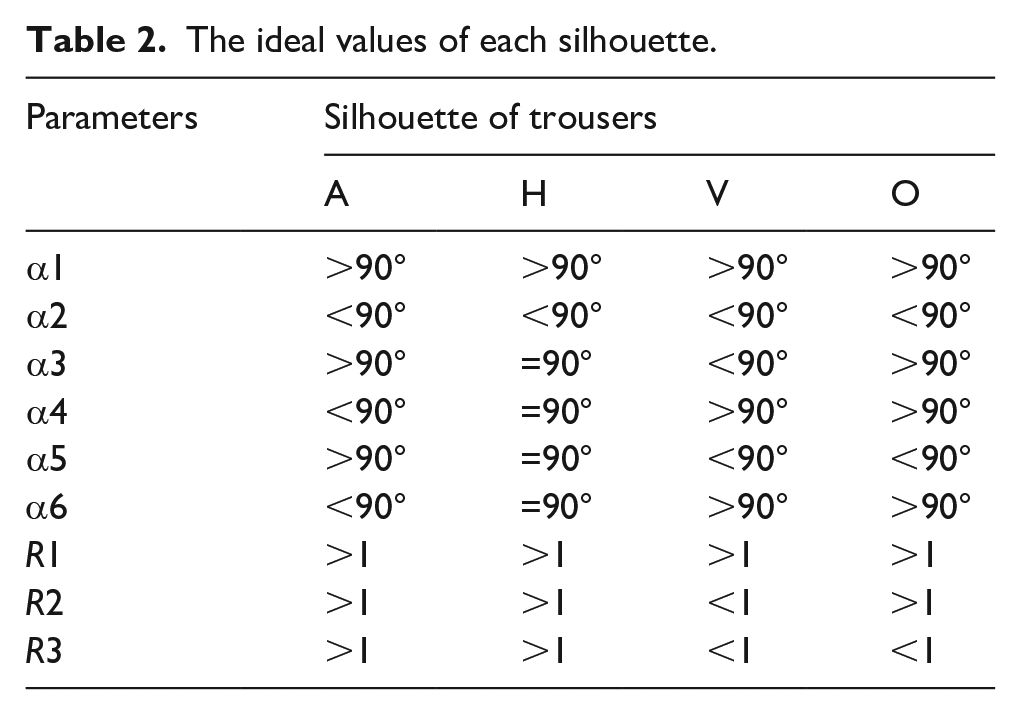
Firstly, the parameters of six ideal silhouettes were extracted and compared. It can be seen from the Table 2 that there is no difference in angles α1, α2, and ratio R1 for various silhouettes, while there are differences in other angles and ratios. For the silhouettes, A and H, the angles α3, α4, α5, and α6 of the H silhouette are all 90°, which are different from the A silhouette, while the ratios between H and A silhouettes are not different. For the silhouettes H and V, except for the four angles, there is a difference between the ratios R2 and R3. For silhouettes O and V, the angle α3 is divided by 90°, and the ratio R2 is divided by 1. The angle α3 of silhouette V is less than 90° and ratio R2 is more than 1, while the angle α3 of silhouette O is more than 90° and ratio R2 is less than 1. These results indicate four silhouettes above can be effectively distinguished by ratio R1, R2, R3, and angle α1, α2, α3, α4, α5, and α6. These parameters are able to reflect the variation in the silhouette of the trouser, which will be used in further analysis. To make the silhouette classification both accurate and efficient, dimensionality reduction of these parameters will be discussed by using factor analysis.
The ideal values of each silhouette.
Key silhouette classification parameters
Because the angle parameter and the ratio parameter have different dimensions, these parameters are treated with standardized parameters. The data were standardized by Z-score to improve the accuracy and scientific validity of the sample data. Based on standardized treatment, all parameters were analyzed by principal component analysis. The result shows that the KMO value is 0.674 and the sig is less than 0.01, indicating suitability for factor analysis. Two common factors are extracted here, which can explain 64% of the total variance of the original variable. It is believed that these two common factors provide information that can be expressed by the nine indicators of the original data.
To simplify the structure, the skew method was used to rotate the load matrix. The Structure Matrix is shown in Table 4. Factor 1 explains parameters α4, α5, R2, R3, and α3, which reflect the angle and width ratio from the hip line to calf part of the trousers and is named “thigh factor” (F1). Because the factor score coefficient of angle α6 is 0.541, which is smaller than other parameters, the factor 2 only contains the parameters R1, α1 and α2, which reflect the angle and width ratio above the hip, and it is named “hip factor” (F2). To further simplify the variables, the variable with the large absolute value of the factor score coefficient greater than 0.8 (Table 3) in the factor was taken. Factor F1 (thigh factor) corresponds to α4, α5, R2 and factor F2 (hip factor) corresponds to R1.
Factor structure matrix.

Based on these two factors and the variables contained therein, a set of standard samples of four types of silhouettes were selected, of which the angle and width ratio values were obtained by measurement (Table 4). Because R2 and R3 have a large coefficient (0.807, 0.762) in the factor F1 and R3 is about the same as R2, R3 is also a width indicator of the trouser silhouette. The ratios R1, R2, and R3 all represent the ratio of various parts to the waist, the relative relationship between various parts is not discussed, and therefore R3/R2 is used as a category of width ratio indicator in the comparison process of F1 of the four standard sample categories. It can be inferred from Table 4 that when the ratio R3/R2 > 1, it means that the width of R3 is greater than the width of R2 and the trousers present A silhouette. When 0.6 < R3/R2 < 1, it means that R3 is slightly less than or equal to the width of R2, and the trousers present H or V silhouette. When R3/R2 < 0.6, it means that the width of R3 is significantly smaller than the width of R2, and the trousers present O-shaped. The angles α4 and α5 belong to the silhouette angle on the knee circumference line, and it can be seen in Table 4 that the angle α4 is less than 90° for H and A silhouette, and greater than 90° for V and O silhouette. The angle α5 has the opposite angle pattern. So, it is reasonable to use α4 as one of the judgment variables for factor 1. The value range of R1 in factor 2 is small, the value of R1 varying between 1.37 and 1.52. Through statistical analysis of samples, the value 1.45 can be used as a distinguishing value.
Four typical contour sample variables.

According to the two factors and parameters discussed above, a set of silhouette recognition methods was proposed and this method is more consistent with the trouser structure (Figure 4). The method considers the structural feature of the waist, hip and knee joint parts of human lower limbs which affect the silhouette of trousers, and the relative relationship of various parts was considered according to the characteristics of the silhouette. Firstly, the trousers silhouette was divided into two categories by the angle α4. If α4 was less than 90°, the trousers were silhouette H or A, and classed them to the first category. The second type was that if α4 was greater than 90°, the trousers were silhouette V or O. On this basis, the parameter R3/R2 was used to distinguish the first type of silhouette, and the parameter R1 is used to distinguish the second type of silhouette. In the first type of silhouette, when R3/R2 was greater than 1, trousers were identified as silhouette A, otherwise, the trousers were identified as silhouette H. In the second type of silhouette, when R1 was greater than 1.45, trousers were identified as O silhouette, otherwise, the trousers were identified as V silhouette. This method can effectively distinguish four kinds of silhouettes by three parameters and two steps.

Four types of silhouette judgment method.
Through this method, the silhouette of the samples was re-identified. The ambiguous samples are optimized according to this classification method, and amount of sample of A silhouette was changed from 120 to 256, amount of sample of H was changed from 220 to 48. And small change in sample size for V and O, V’s amount was changed from 56 to 52, O’s amount was changed from 72 to 112. By comparing the labels before and after optimization, it was found that the number of samples of silhouettes A and H has changed significantly, indicating that these two silhouettes are not accurate as judged by experience before. The above conclusion of convolutional neural network for silhouette prediction is consistent, which proves the reason for the low accuracy of H prediction to a certain extent. In order to prove whether the optimized labels play a role in improving the accuracy of H silhouette prediction, the optimized sample labels will be used for convolutional neural network prediction in the following.
Result and discussion
Accuracy of trousers pixel
The recognition model in Chapter 2 was used to retrain the newly labeled samples and compared them with the first training and test results. The loss value after convergence of both training networks had no significant difference. Figure 5 shows the comparison of the effect of trousers segmentation for four classes. The four categories before optimization are correctly predicted. Before label optimization, some pixels of the test samples of silhouette O were wrongly predicted as silhouette A. The pixel points of the test samples of silhouettes V, H, and A were correctly classified, but the segmentation edges are not clear enough. After optimization of silhouette labels and reclassification of training set, the edges of silhouette H and silhouette V were clearer. These results indicate that the prediction accuracy of pixels is improved and can promote the improvement of trousers silhouette edge segmentation accuracy.

Indicators of the four silhouette categories and the segmentation example: (a) shows the comparison before and after optimization of silhouette A, (b) shows the comparison before and after optimization of silhouette H, (c) shows the comparison before and after optimization of silhouette O, and (d) shows the comparison before and after optimization of silhouette V.
After the label optimization, the MIoU increased from 0.83 to 0.84. The IoU value of H silhouette increased from 0.73 to 0.78 (Figure 5(b)), the IoU value of O silhouette and A silhouette remained unchanged (Figure 5(a) and (c)), and the IoU value of V silhouette decreased from 0.88 to 0.85 (Figure 5(d)). The average recall was improved from 0.90 to 0.91. The recall reflects the ratio of predicted positive samples to true labeled positive samples. The recall for H silhouette increased from 0.82 to 0.88, the recall for O silhouette remained unchanged. And the recall for A silhouette decreased from 0.95 to 0.94. The recall for V silhouette dropped from 0.94 to 0.9. The MPA decreased from 0.92 to 0.91. The PA value of V silhouette was increased from 0.93 to 0.94, the PA value of H silhouette was increased from 0.87 to 0.88, and the PA values of A and O silhouettes were unchanged. The small decrease in the mean value was due to the X silhouette. This is the result of the label of X silhouette was not optimized. And from an objective standpoint, the PA value of the X silhouette was high (0.88). The small decrease in the metric had a minor impact on the classification ability of the model.
Apart from the fact that the two randomly generated test sets are slightly different, the following reasons could explain the variation in these indicators. The optimization of the labels for the H silhouette increases the fraction of true and predicted labels that overlap for this silhouette. After label optimization, the sample size of H silhouette changed the most before and after label optimization, while the improvement of each index of H silhouette was obvious after label optimization. The other silhouettes have smaller changes in the indexes, so it can be considered that the segmentation prediction ability for the H silhouette has been improved after label optimization. The metrics for the O and A silhouettes are the same after optimization. The IoU and Recall values for the V silhouette decrease and the PA value increases. The sample size of V decreased after optimization, that is, the real label set changed.
Accuracy of trousers silhouette classification
For further analysis, the predictions for all the pixel points in an image were extracted. The category with the highest percentage of them is used as the final classification result for this image, which is the silhouette category of the trouser. For four easily confused silhouettes A, H, V, and O, the prediction accuracy was calculated and compared before and after the label optimization of these silhouettes. On the whole, the recall of these silhouettes was 0.96 before the label optimization and 0.97 after the optimization. This result suggests that the optimized label has a positive influence on the accuracy of silhouette prediction.
As can be seen from Figure 6, after label optimization, the test samples number of silhouette A remains unchanged, silhouette H is decreased by 11, silhouette V is decreased by 3, and silhouette O is increased by 7. The recall of silhouette A is 0.95 before optimization and 0.97 after optimization and it is not predicted as silhouette H. The recall of silhouette H is reduced by 0.03, but each pixel-level index is improved. This result suggests that although the recall of silhouette H is slightly decreased after label optimization, the pixel segmentation results are more complete. After label optimization, the recall of silhouette V is 1.00, which is significantly improved. Although the results in Figure 5d show that the pixel recall and IoU are both reduced after label optimization, and PA is improved, which shows that for the prediction of a single image, the recall of silhouette V is improved. The recall of silhouette O is 0.94 before optimization, and it becomes 0.96 after optimization.

Number of misclassified samples in the test set.
Because silhouettes A, H, and V are easy to be confused in label definition and recognition, analyzed the various misclassifications before and after label optimization. After label optimization, the types of misclassifications of silhouette A are reduced from the original H, V and O to V and O. Silhouette V is not wrongly predicted as other types, and the types of silhouette H is unchanged. These results indicate that after label optimization, the silhouette recognition method based on artificial intelligence not only improves the accuracy of silhouette prediction, but also significantly reduces the types of A, H, and O silhouette prediction errors, and significantly improves the degree of differentiation.
Conclusion
The goal of intelligent recognition of trouser silhouettes is to save the time of costume designers and consumers during developing and selecting products. The deep separable convolution was used to reduce the number of parameters of convolutional neural networks and improves the speed of network convergence. In the process of labeling the dataset, it was found that the silhouette categories of some samples were difficult to be classified by subjective methods. The model was trained using a dataset of initially classified trouser dataset. The results showed that MIoU and MPA values of H silhouette were low. The ambiguous samples were measured and analyzed, and two factors were obtained to classify the H, A, O, and V silhouettes, which were named “hip factor,” and “thigh factor.” To further simplify the process of classifying the silhouettes, the “hip factor” can be simply described as the width of the hip in the image; the “thigh factor” can be described as the angle value from the knee to the edge of the thigh portion of the trouser in the image and the ratio of the width of the knee part to the width of the bottom of the pants. These two factors were combined with a new model of judgment to re-label the dataset for optimization. When the model was trained with the new dataset, the recall rate and IoU is improved by 6% and 5% for the H silhouette respectively. The prediction accuracy of most silhouettes has been significantly improved, for example, the prediction accuracy of silhouette V is 100%. This indicates that accurate definition of silhouette label is important for silhouette recognition.
The dataset is limited in the work, and the data set will continue to be expanded and better models will be trained in future work. The data set mainly focuses on the collection of trousers samples in standing posture, and there is no test and analysis for other trousers samples with other postures in this paper. Therefore, it has limitations in practical promotion, and further research will be carried out on the silhouette recognition of trousers under other postures to improve the practicality of this method.
Footnotes
Declaration of Conflicting Interests
The author(s) declared no potential conflicts of interest with respect to the research, authorship, and/or publication of this article.
Funding
The author(s) disclosed receipt of the following financial support for the research, authorship, and/or publication of this article: The work was financially supported by Open Project Program of Engineering Research Center of Hubei Province for Clothing Information (Grant No. 184084002).