
Abstract
In this paper, according to the one-dimensional heat transfer mechanism between fabric and human body, it is found that different thermal properties affect different heat transfer stages of fabric. Therefore, we used the maximum heat flux qmax as the index to characterize the transient contact cool feeling of fabrics, and measured the thermal properties, various specifications and surface morphology of 40 kinds of summer fabrics. Firstly, we discussed the influence of the above properties on the transient cool feeling. Secondly, according to multivariate stepwise regression, the significant representative variables are selected, and the prediction model of transient coolness and fabric properties is established. Furthermore, the model was verified to explore the subjective and objective consistency. The results show that, in the transient heat transfer stage, the influencing factors that are significantly related to the cool feeling of fabric include fabric thickness, grammage, volumetric heat capacity, thermal conductivity, warp and weft density, and roughness. The main component representative variables of the cooling sensation regression equation are volumetric heat capacity and thickness, and other variables can be explained by these two variables. Changing them is the key to enhance the cooling sensation. The predicted value of coolness is in good agreement with the subjective evaluation of cooling sensation, which has a certain guiding effect on the actual human cool feeling. The purpose of this study is to find out the main factors that affect the cool feeling, and then apply the established cool feeling model to the development of fabrics in summer, so as to meet the thermal comfort requirements of human body’s fabrics.
Keywords
Introduction
As a significant part of “clothing-environment-human body” system, fabric is called the second skin of human body and plays the role of heat transfer medium. It will affect the heat exchange between the skin and the surrounding environment due to the difference of its own transmission performance. 1 The human body needs to use the warmth and coolness of textiles to balance the differences between skin and climate. 2 However, the heat balance is related to the heat flux exchanged between fabric and external environment. 3 Heat flux can be divided into two forms, through latent heat loss of evaporation and sensible heat transmission. 4 The total heat flow can be given by the following equation:

In the equation (1), “q” refers to the total heat flux in a certain time, qcond, qconv, and qrad refer to the heat flux transferred by conduction, convection, and radiation in a certain time. Assuming that the heat transfer is one-dimensional, the system is in local heat balance. 5 The fiber material has sufficiently enough porosity and dimensionless parameter Sp value, 6 which can not violate the hypothesis of uniformity and isotropy. The temperature difference between surfaces is usually lower than 10℃, vertical transmission is the main factor. Therefore, the heat transfer by conduction 7 is mainly considered. The typical heat transfer process can be divided into three stages, in which the heat flux increases at a rapid rate, decreases at a slow rate, finally reaches the equilibrium value, and remains unchanged for the rest of the experiment. 8 In 1987, Hes et al. 9 firstly proposed to use thermal absorptivity of fabrics (effusivity) as an objective parameter expressing thermal contact feeling of fabrics. The detailed analysis of transient heat transfer between a skin and a fabric was published later by Hes and Dolezal. 10 In 1992, strong correlation between the subjective thermal contact feeling of 100 persons and thermal absorptivity of nine different fabrics was confirmed by high Pearson correlation coefficient. 11
In addition, many experts have explored the relationship between fabric properties and heat transfer parameters on the one-dimensional heat transfer level. Tian et al. 12 defined three prediction parameters, namely the peak heat flux qmax, the corresponding time tmax, and the steady heat flux q0, which were used to describe and predict the heat transfer through the thermoreceptor under the skin. Ziegler and Kucharska-Kot 13 determined the heat transfer coefficient of woven fabric by using the thermal conductivity and thickness of fabric. Militky and Křemenáková 14 developed a simple mechanical model to predict the thermal conductivity of fabrics. Bhattacharjee and Kothari 15 put forward a mathematical model to predict the thermal resistance of woven fabrics.
In this paper, we first analyzed the one-dimensional heat conduction of fabrics, then prepared 40 kinds of human contact fabrics in summer, measured the physical index qmax of transient cool feeling and various properties potentially related to coolness, including fabric thermal properties, specification parameters, surface morphology, etc. The correlation between the above properties and cool feeling was discussed, and the main factors were screened out. According to multiple step-by-step analysis, 16 relevant influencing factors were introduced one by one as independent variables, significant representative variables were determined, and the regression equation of principal component influencing factors and qmax was established. The prediction value of regression equation is verified by subjective evaluation of human body, so that the final model can predict the real cool feeling, and provide certain reference for developing and evaluating cool feeling fabrics.
One-dimensional heat transfer theory hypothesis
Heat transfer is caused by temperature difference. Due to the properties of fiber materials, such as the influence of air and the interwoven structure of fabrics, 17 the heat transfer through fabrics is complicated. When the heat transfer in the fabric is studied theoretically, the fabric is considered to have a uniform structure. 18 Heat transfer process can usually be divided into transient and steady state. Figure 1 shows the one-dimensional heat conduction of fabric, human body and environment, where X is the contact direction between fabric and human body. This paper mainly studies the influence of fabric characteristics listed in Figure 1 on heat transfer parameters.

Heat conduction of fabric stimulation.
This paper mainly studies the situation that the fabric temperature is lower than the human body temperature. According to Fourier’s law and one-dimensional heat conduction hypothesis, Figure 2 shows the temperature change of fabric during thermal stimulation. At room temperature, namely T0 is about 20℃, the human skin temperature Ts is about 32℃. The temperature of the fabric is about equal to the room temperature T0, and the surface temperature between the fabric and human skin is ΔT ≈ 10℃, so the contact between the fabric and human body will trigger the thermal stimulation process.

Temperature change of fabric during thermal stimulation.
The transient heat transfer of fabric can be divided into two stages, corresponding to the temperature curve in Figure 2 from 0→Xi and Xi→X1, which is aperiodic and unsteady heat transfer. The first stage is the initial stage, and its characteristic is that the temperature changes gradually from the boundary surface of the fabric to the interior of the fabric. Q1 is the increased heat flux in the first stage, and reaches the maximum Qtop at Ti. With the increase of contact time, the influence of initial temperature distribution gradually disappears, and the fabric temperature decreases. Entering the second stage of transient heat transfer, Q2 is the heat flux conducted by the fabric in the second stage.
The heat transfer of fabric is closely related to the temperature distribution inside the fabric. The fabric is regarded as a semi-infinite object in the unsteady heat transfer stage. The temperature “T” is a function of the thickness direction “X” and the contact time “t.” When the fabric comes into instant contact with human body, the initial temperature is T0. First, the temperature reaches the maximum value Tmax at the thickness of Xi and ti, and then the temperature tends to be stable at the thickness of X1 and t1. Finally, the temperature is Ta, which is expressed by the formula:


Transient first stage: when the fabric is in contact with the skin, the temperature rises instantaneously, and the heat Q1 absorbed by the fabric is:

Where: c, ρ, s, d are fabric specific heat, density, contact cross-sectional area and thickness, and the units are J/kg∙℃, g/cm3, cm2, and cm, respectively.
Transient second stage: fabric temperature decreases. According to the first kind of boundary conditions and semi-infinite object, at the interface X1, the total heat released is:

At 0 →t1, the heat released per unit surface area Q2 is:

Where: a, d, k are the thermal diffusivity, thickness, thermal conductivity of the fabric, and the units are mm2/s, cm, W/(m∙K) respectively.
Steady-state heat transfer stage: Regardless of the core level of human body, only from the fabric, when the fabric temperature is infinitely close to the skin temperature, it enters the stable heat transfer stage, at which time QS 12 is:

Where: R, Ta, T0, k, and X1 are the thermal resistance, stable temperature, initial temperature, thermal conductivity, and thickness when entering stable heat transfer, and the units are mm2/s, ℃, ℃, W/(m∙K), and cm respectively.
The above equation shows that the thermal diffusivity and thermal conductivity of the fabric surface in contact with the skin simultaneously affect the transient heat transfer parameters. After entering the steady state stage, the thermal conductivity of the fabric has a great influence on the heat transfer process.
Experimental study
Materials
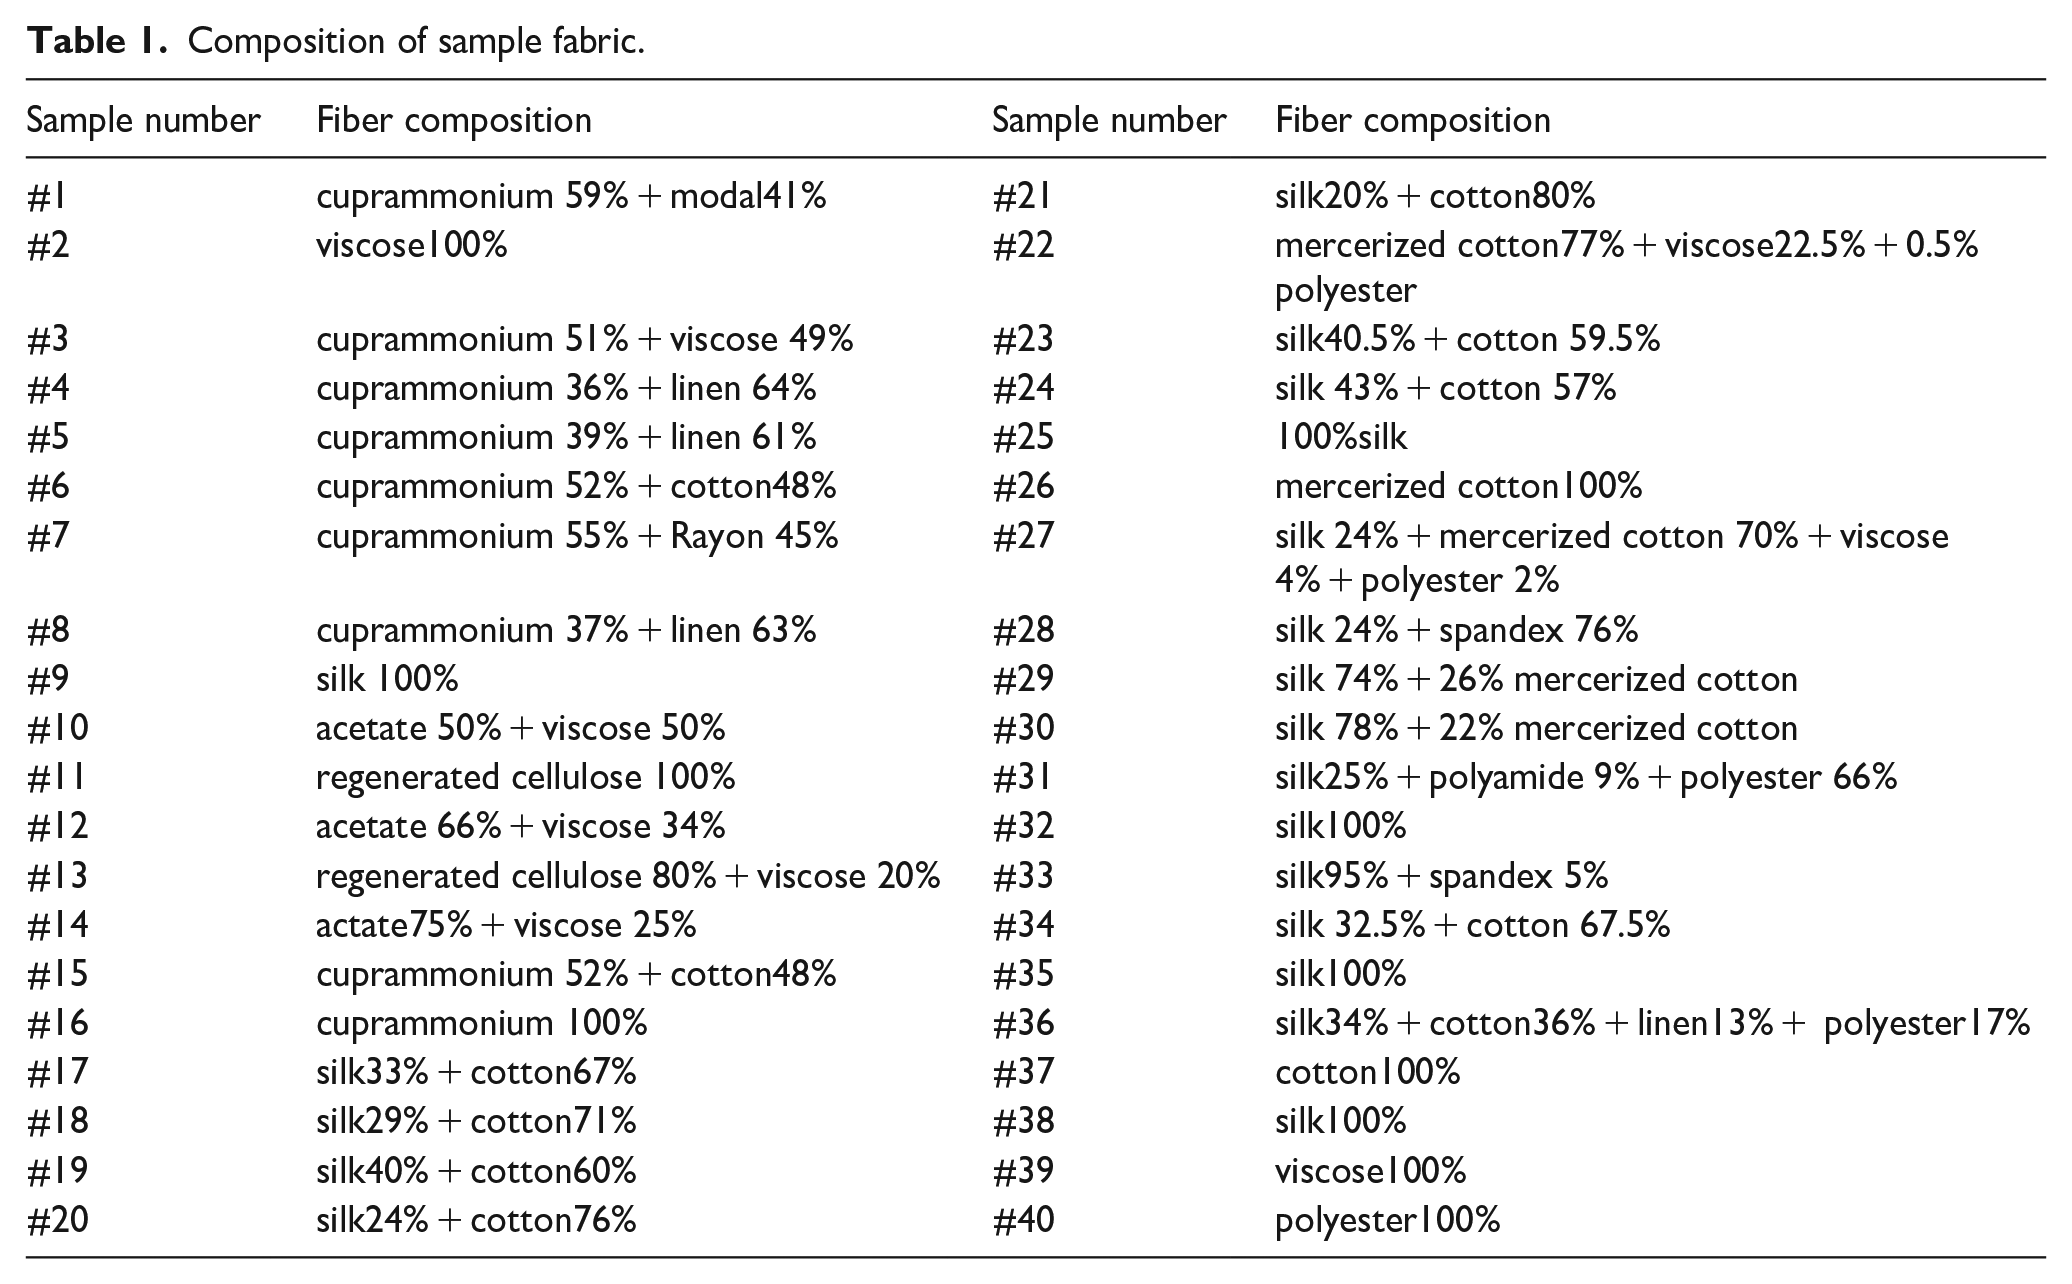
In order to explore the relationship between the cool feeling of summer fabrics and thermal properties, surface properties and specification parameters, 19 we prepared 40 kinds of summer fabrics with different raw materials and blending ratios to explore the cool feeling. They are all human skin contact woven fabrics, as shown in Table 1.
Composition of sample fabric.
Basic performance test
According to GB/T 6529, humidity control and experiment were carried out in this paper. At the same time, in order to study the influencing factors of the instant cool feeling, we tested the basic properties of these 40 kinds of fabrics, including the grammage, thickness, warp and weft density, friction, and roughness. The grammage of fabric is measured according to GB/T 4669-2008, and the thickness of fabric is measured according to GB/T3820-1997. The results show that the thickness of fabric is relatively thin, which belongs to summer fabric. The M293-FTT fabric touch tester 20 produced by SDL Atlas Ltd was used to test the fabric surface morphology, including the warp and weft friction (SFCa, SFCe), the amplitude and wavelength of warp and weft roughness (SRAa, SRAe, SRWa, SRWe). SRA is the average amplitude of the peaks and troughs in the waveform, divided into longitude and latitude, namely SRAa and SRAe. SRW is the average wavelength of peaks and troughs in the waveform, divided into longitude and latitude, namely SRWa and SRWe. According to GB/T 4668, the warp density and weft density of the fabric are measured by the fabric decomposition method. The specific measurement results are shown in Table 2.
Basic performance index of fabric.

Thermal performance index test
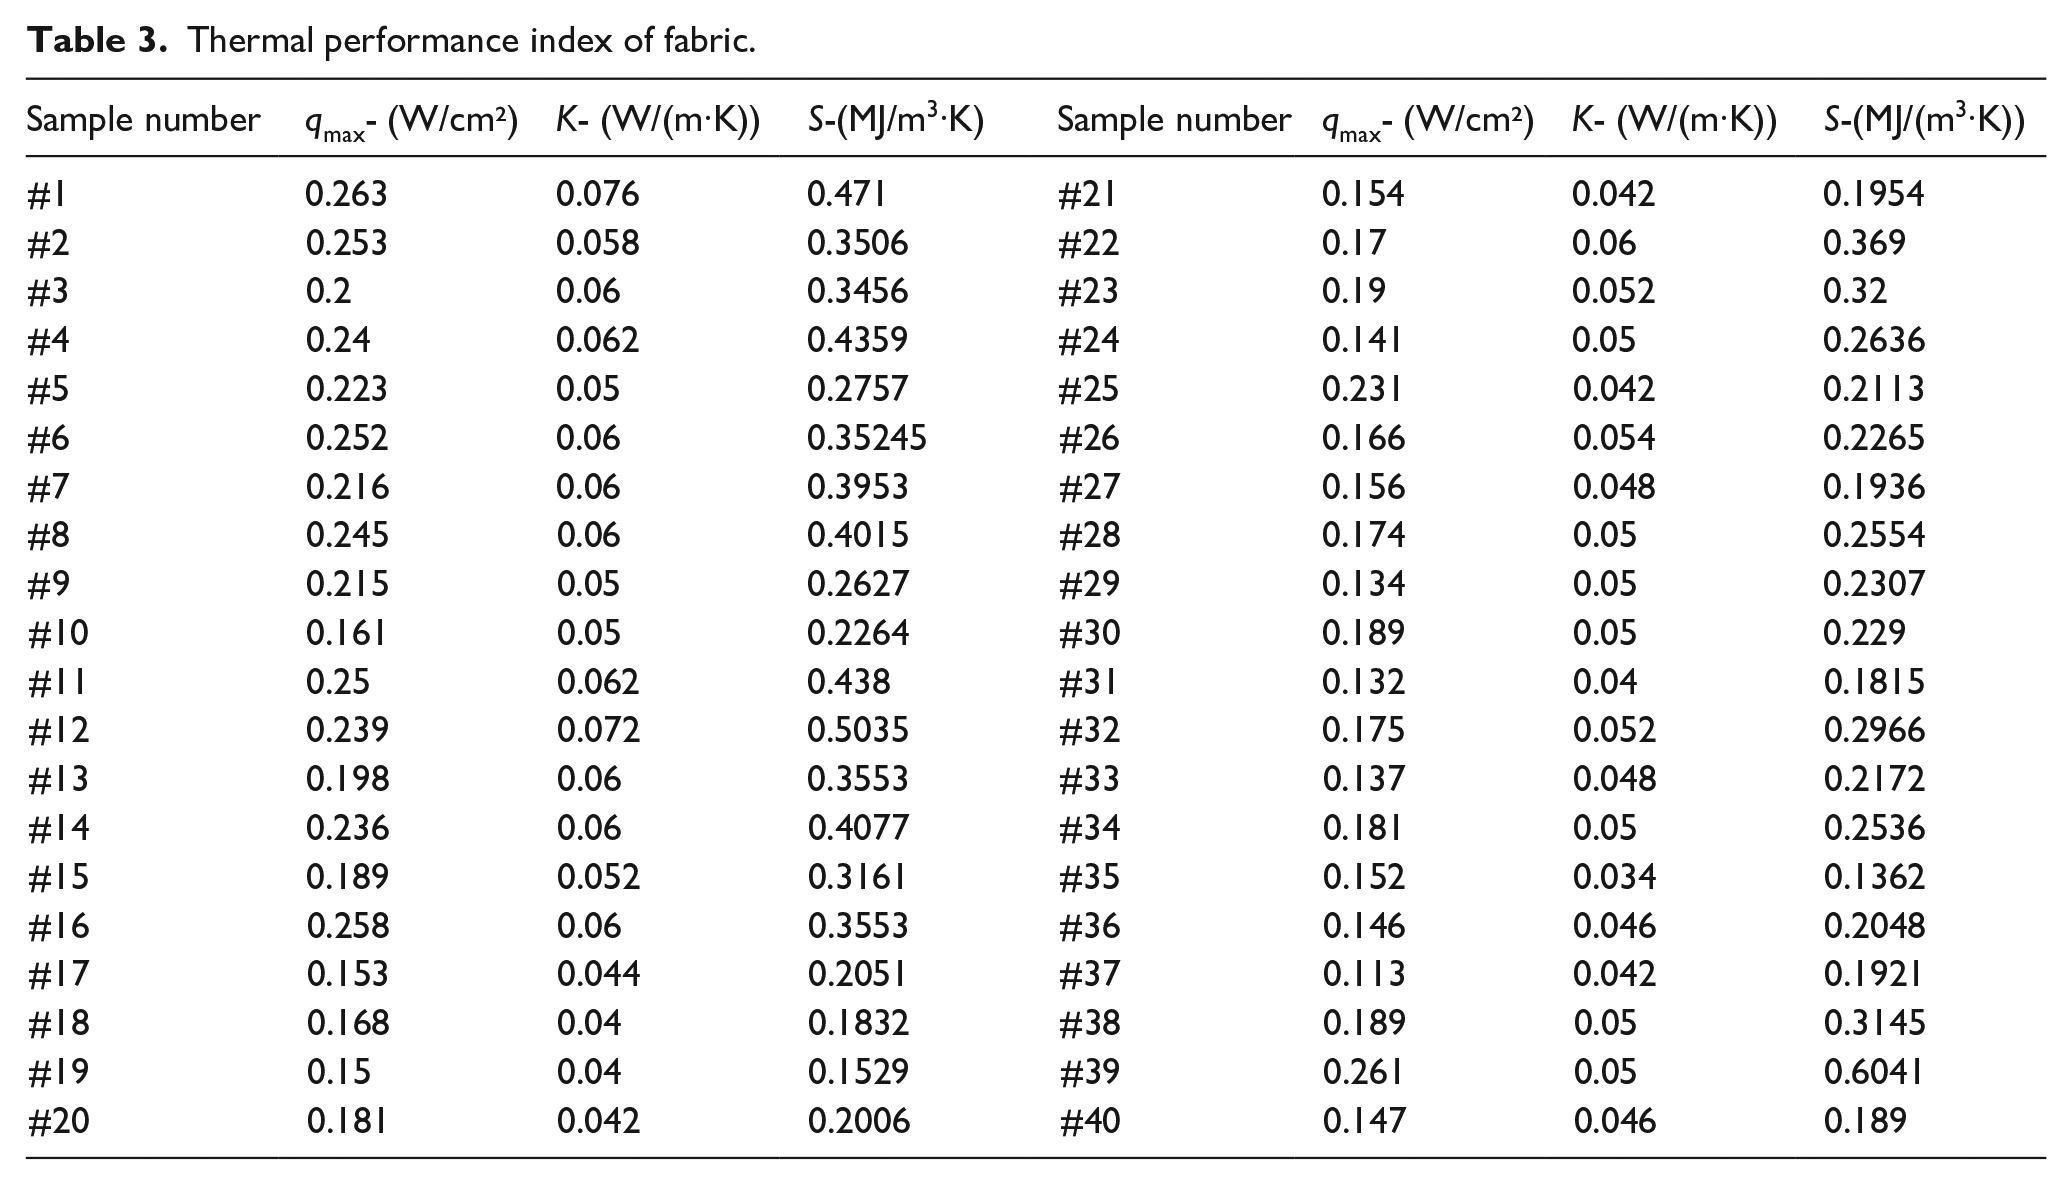
The transient contact cooling feeling of fabric was measured by KES — F7 THERMO LABO Ⅱ cooling and heating tester, and the index is the maximum heat density qmax, and the unit is (W/cm²). The thermal conductivity “K” and volumetric heat capacity “S” of fabrics were measured, and the units are W/(m∙K) and (MJ/m³∙K), respectively. The sample was pretreated and equilibrated for at least 24 h, and all experiments were carried out in an environmental room with a temperature of 20 ± 2℃ and a relative humidity of 65 ± 5%. The experimental results are shown in Table 3. The heat transfer parameters of each sample were tested five times, and the standard deviation of the test is less than 0.01, which indicated that the test results of the test method have good stability.
Thermal performance index of fabric.
Establishment and verification of regression equation of cooling sensation
Single factor correlation analysis
As a whole, the properties of the fabric interact with each other, which in turn affects the coolness to varying degrees. In order to discuss the influence of fabric properties, 21 we have made Pearson correlation analysis between 40 kinds of fabrics’ different properties and qmax, as shown in Table 4.
The Pearson correlation of different fabric properties and qmax..

At the level of 0.05 (double tail), the correlation is significant.
At the level of 0.01 (double tail), the correlation is significant.
As shown in Table 4, there is a certain correlation between the transient cool sensation of fabrics and different properties. qmax has a significant correlation with the fabric thickness (−0.379*), the warp roughness wavelength SRAa (−0.378*), the warp density (−0.390*) at 0.05 level (double tails). qmax has a significant correlation with the grammage of fabric (0.463**), volumetric heat capacity (0.799**), thermal conductivity coefficient (0.694**), and weft density (0.572**) at 0.01 level (double tails).
The correlation influencing factors and transient cool feeling values of 40 kinds of summer fabrics are plotted in the same figure, as shown in Figure 3. As can be seen from the figure, some influencing factors of fabrics show similar trends, which indicates that the properties of fabrics are mutually infiltrated and influenced, and act together on the instant cool feeling of fabrics. 22 And because of the correlation between these parameters, there is no definite relationship (high linear correlation or no correlation) between a certain property of the fabric and the coolness value qmax, and there is a large variation between the data. Therefore, it is necessary to screen the independent variables, get rid of the interaction between the independent variables, and select the significant and principal component representative variables to represent the transient cool feeling of fabrics.

Relationship between transient cooling sensation qmax and properties of 40 summer fabrics.
Establishment of transient cooling sensation model
In order to establish the relationship between the influencing factors and the cool feeling, we selected the performance related to the maximum transient heat flux qmax as the independent variable of the stepwise regression model, and established the prediction model of the fabric transient cool feeling. 23 Figure 4 shows the process of establishing the regression equation of fabric transient coolness.

The establishment process of the regression equation of the fabric’s transient coolness.
When the associated probability of F-statistics is less than or equal to ⩽PIN (critical probability, which is often specified as 0.05), the process of selecting the variable forward continues. 24 After stepping for many times, the variables selected for input are the volumetric heat capacity, thickness of the fabric respectively. The earlier the independent variable is selected, the more significant the impact and the higher the correlation. 25
According to the model summary shown in Table 5, for the two variable predictions using the b method, the R² is 0.740, indicating that the model has high credibility and good effect. Compared with the inclusion of only volumetric heat capacity, the R2ad of adding the fabric thickness is increased, and the residual standard deviation is decreased, indicating that the fitting effect is getting better. After the new variables are included, the change of R2 is statistically significant.
Model summary of transient cool feeling.

Predictor variable: (constant), volumetric heat capacity,
Predictor variable: (constant), volumetric heat capacity, fabric thickness,
F = 52.651, p < 0.01 in Table 6 model, which indicates that the regression coefficient of at least one independent variable is not zero, and the regression model is statistically significant. According to each coefficient, write the regression equation (7) as follows:
Analysis of variance of stepwise regression model.


Where V and T are volumetric heat capacity and fabric thickness, respectively. According to the comparison of absolute values of standardized partial regression coefficients, it is found that the biggest factor affecting the maximum instantaneous heat flux qmax is volumetric heat capacity, followed by fabric thickness.
Figure 5 is a partial regression diagram of each parameter. Figure 5(a) and (b), are respectively the partial regression plot of fabric volumetric heat capacity, fabric thickness with qmax. Figure 5(c) is a scatter diagram of predicted values and regression standardized residuals. This scatter diagram can show that the residual is between −2 and +2, which can explain most of the predicted values. This proves that the regression equation is effective.

Partial regression chart and normalized prediction value of regression: Partial regression diagram of (a) volumetric heat capacity, (b) thickness with qmax, and (c) scatter chart of normalized predicted value.
Figure 6 is a three-dimensional scatter plot and prediction model of qmax values of 40 kinds of fabrics according to stepwise regression variables. Figure 6(a) is a comparison plot of qmax predicted and actual values in two regression variable coordinate systems, where the x, y, and z axes respectively represent volumetric heat capacity, fabric thickness and qmax. The trend of the predicted value and the actual value is roughly consistent, indicating that the regression equation has certain significance for the actual objective cold feeling prediction. 26 Figure 6(b) is a three-dimensional curved surface obtained by regression analysis according to Figure 6(a). It can be seen from that most of the actual values fall on the predicted surface. It shows that the prediction effect of two parameter regression model is good, and it can estimate qmax effectively.

Three-dimensional diagram of transient cooling sensation: (a) three-dimensional scatter diagram of fabrics and (b) complete prediction model.
Correlation analysis of independent variables
We found that the only variables that entered into the equation were fabric volumetric heat capacity and thickness. However, in the previous single factor correlation analysis of qmax, many influencing factors have significant correlation with it, which indicates that all related factors can be explained by these two variables. Table 7 is Pearson correlation analysis of volumetric heat capacity, thickness and other related factors. It can be seen that the volumetric heat capacity is significantly correlated with the square mass (0.565**), thermal conductivity (0.816**), warp density (0.349*), and weft density (0.607**), so volumetric heat capacity is the representative variable of these influencing factors. There is a significant correlation between fabric thickness and warp roughness (0.552**), and the thickness as the representative variable enters the equation.
Correlation analysis of other factors with volumetric heat capacity and thickness.

At the level of 0.05 (double tail), the correlation is significant.
At the level of 0.01 (double tail), the correlation is significant.
Subjective cool feeling verification of human body
In the end, the objective test of the early theory of cool feeling of fabric should be based on the cool feeling of actual wearing. Objective indicators should be able to reflect the real cool feeling effect of fabric contacting with human body, so as to effectively infer people’s physiological and psychological feelings. 27 Subjective evaluation and objective test complement each other and combine with each other to give full play to the overall evaluation of the cool feeling of fabrics.
In this paper, the subjective evaluation content is divided into Ⅰ−Ⅴ grades according to very low, low, general, high, and very high by using the five-point scale method, as shown in Table 8. After training, 20 experimenters (10 boys, 10 girls) with knowledge of related fabrics evaluated the instant coolness of the samples according to the flow chart of Figure 7.
Classification basis of subjective contact coolness of fabric.


Flow chart of subjective evaluation.
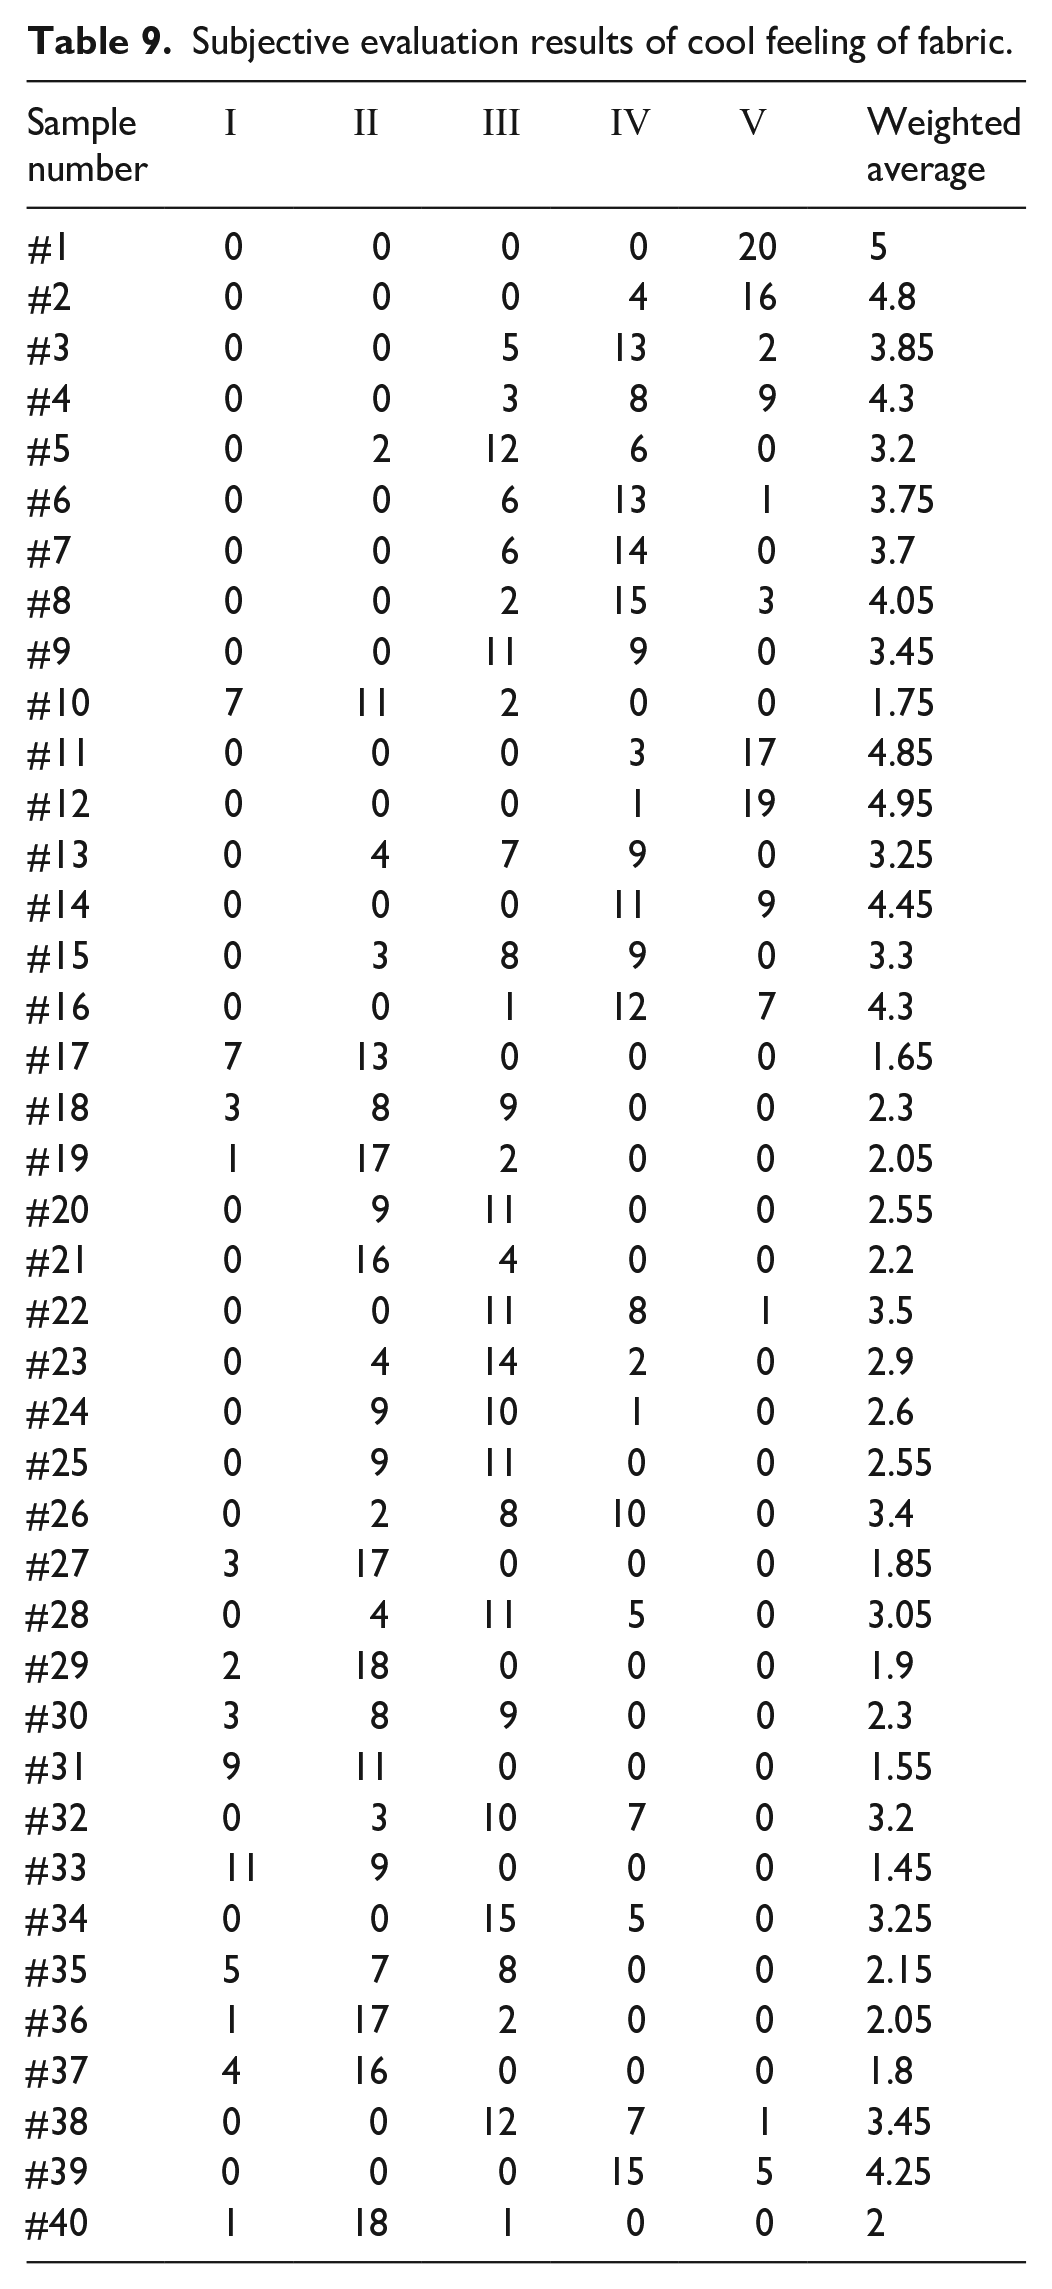
The subjects graded the fabrics by a scoring system, in which: I, II, III, IV, and V scored 1, 2, 3, 4, and 5 points respectively. The total number of people in each grade corresponding to each fabric is regarded as the weight, and marked as U1, U2, U3, U4, and U5. Using the weighted average method, see formula (8), the weighted average value of cool feeling can be obtained, and the results are shown in the Table 9.
Subjective evaluation results of cool feeling of fabric.

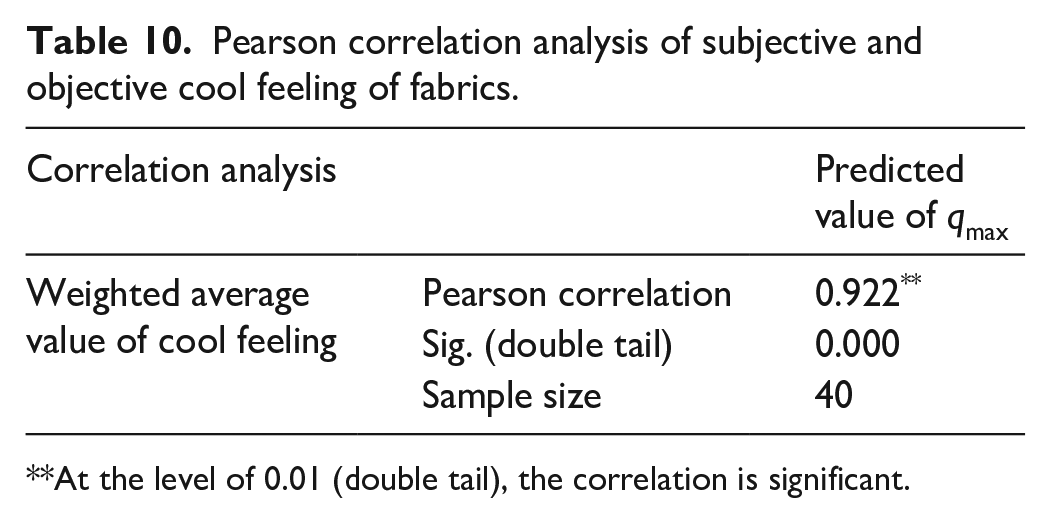
In order to explore the correlation between objective indicators and subjective evaluation of fabrics, we have conducted Pearson correlation analysis on the weighted average of subjective coolness and the predicted value of qmax, as shown in Table 10 below. It is found that the predicted value of qmax has a significant correlation with the subjective coolness value at the level of 0.01 (two tails), and the correlation coefficient is 0.922**. Figure 8 shows the relationship between subjective and objective values, and the trends are almost the same. The two values are in good agreement, and the predicted values can better represent the real cool feeling of human body.
Pearson correlation analysis of subjective and objective cool feeling of fabrics.
At the level of 0.01 (double tail), the correlation is significant.

Predicted value of qmax equation and subjective cool feeling value of fabric.
Conclusion
In this paper, according to the hypothesis of one-dimensional heat transfer in the thickness direction of fabric, it is found that different heat transfer parameters affect the cool feeling in different stages. Therefore, we discuss the influence of various properties including heat transfer parameters on the cool feeling of fabrics. At first, we prepared 40 summer fabrics, and tested the objective physical indexes qmax, fabric specifications, surface properties and thermal properties. We analyzed correlation between the transient cool feeling and different properties, and obtained the main factors affecting the instantaneous cool feeling of fabric. Secondly, using stepwise regression method, the representative variables of principal components are screened out, and the prediction equation of objective coolness is established. Furthermore, exploring the fitting degree of regression equation, and establishing the variance analysis of the model. Finally, through the subjective rating of human body, the one-to-one Pearson correlation analysis is made between the predicted value of the equation and the subjective sense of coolness, and the predicted value of the equation is verified by subjective evaluation of coolness.
According to the experimental analysis, there are many factors that affect the transient cool feeling of fabric, including thermal properties, thickness, grammage, warp and weft density, roughness and so on. The representative variables are volumetric heat capacity and fabric thickness, which contain the influence of other properties. Volumetric heat capacity has the greatest influence, and it has a high correlation with the thermal conductivity, which proves the hypothesis that the thermal conductivity has a high influence on the cool feeling in the transient stage. Therefore, changing the above two parameters is the key point to enhance the transient cool feeling. By establishing a stepwise regression equation between cool feeling and fabric properties, and continuously incorporating the influencing factors into the regression model, an optimized and accurate cool feeling prediction system is established. It can not only predict and evaluate the coolness of fabrics made of different fibers, but also evaluate the influence of different process parameters on coolness. Finally, the subjective cool feeling of human body has a high degree of fitting with the predicted value of the equation, which indicates that the equation has practical application significance. It can guide the prediction of the actual cool feeling degree of fabrics in summer. Due to the limited conditions, the influencing factors involved in this experiment are not comprehensive enough, so the fitting degree R2 of the equation has not reached a higher index. In the follow-up research, we should increase the influence factors, refine the classification, design and plan the experiment, optimize the model constantly, and establish a more effective and accurate evaluation model for the transient contact coolness of fabrics.
Footnotes
Declaration of conflicting interests
The author(s) declared no potential conflicts of interest with respect to the research, authorship, and/or publication of this article.
Funding
The author(s) disclosed receipt of the following financial support for the research, author-ship, and/or publication of this article: This paper has received the support from Zhejiang Provincial Natural Science Foundation of China under Grant No.LGC21E030002 and the Fundamental Research Funds of Zhejiang Sci-Tech University under Grant No. 2021Q005.