
Abstract
In the present study, poly (acrylonitrile-co-methyl methacrylate), P (AN-co-MMA), nanofibers and P (AN-co-MMA) nanofibers with Functionalized Single-Walled Carbon Nanotubes (F-SWCNTs) were produced by electrospinning and became stabilized. Besides, samples were evaluated using Differential Scanning Calorimetry (DSC), Fourier Transform Infrared Spectroscopy (FTIR), a Scanning Electron Microscope (SEM), and X-ray diffraction (XRD). In the sample containing F-SWCNT, the amount of the heat released during stabilization reactions was lower than that with pure PAN copolymer nanofibers. This indicates that the F-SWCNTs prevent damage and sudden release of heat to the nanofibers during the stabilization process. Besides, the carbon nanotubes (CNTs) greatly prevent a decrease in the diameter of the nanofibers the size of the crystals, and the arrangement of the nanofibers during the stabilization process.
Introduction
Carbon nanotubes (CNTs) are hollow cylindrical structures divided into two types of single-walled nanotubes (SWCNTs) and multi-walled nanotubes (MWCNTs).1–4 Double-walled carbon nanotubes (DWCNTs) are formed by two concentric SWCNTs being called “double-walled” nanotubes. The diameter of SWCNTs is 1–2 nm, whereas that of MWCNTs ranges from 2 to 25 nm. 5 The spacing between the layers of graphene in MWCNTs is 0.36 nm. In the study by McDevitt et al., 6 SWCNTs with diameter of 1.4 nm and lengths of 0.2–1 μm were used. The high aspect ratio (the length divided by width) of CNTs presents a large surface area for modification with various functionalities.
CNTs have been widely used as additives to modify properties of different polymers and to produce composites.1–4 In addition, they have unique mechanical, thermal, and optical properties, which are used for reinforcement purposes composite nanofibers.7,8 The addition of these materials alters viscosity, surface tension, and electrical conductivity of the polymer solution thereby affecting microstructural properties and crystallinity of the nanofibers.7,9
Different methods are used to treat CNT accumulation. Accordingly, physical methods use surface-active materials, 10 and chemical methods involve surface modification or functionalization with various chemical groups such as hydroxyl or carboxylic acid, to disperse CNTs in a liquid media and to increase resistance to accumulation. 11
The presence of functional groups in CNTs could increase their reactivity and interaction with the polymer substrate. The polymer wrapping process happens through Vander Waals interactions and chemical bonding (π–π stacking) between CNTs and polymer chains containing aromatic rings. 12 However, functionalizing is not a causative factor in the interactions.11,13
Carbon nanofibers (CNFs) are fibers with diameters in within the nanometer range, 14 with their major properties being high tensile strength, high stiffness, high chemical resistance, light weight, high-temperature tolerance, and low thermal expansion. 15 Catalytic synthesis and electrospinning are the two major techniques used in CNFs production.
The raw material used in manufacturing CNFs is known as a precursor. CNFs are synthesized from many types of synthetic and natural precursors, such as polyacrylonitrile, polyphenol, viscose rayon, cellulose phosphate, as well as phenolic, and pitch-based fibers.16–18 Besides, about 90% of CNFs are made from the PAN precursor, with the remaining 10% produced from other precursors mentioned above. 19
In recent years, (PAN) /CNT composites have attracted much attention. PANs are important polymers that interact well with CNTs. Thermal stability of polymers could be altered by the presence of nanotubes, which leads to crystallinity and mobility of polymer chains, thereby making composites susceptible to application at high temperatures. 10
Eren et al. 20 studied effects of amino-functionalized multiwalled carbon nanotubes [f-MWCNTs] on the structure and properties of composite PAN nanofibers produced by an electrospinning setup with a rotating collector. In their study, the 3 wt.% f-MWCNT loaded PAN/f-MWCNT nanofiber showed the best mechanical properties. Besides, amine-functionalized nanotubes demonstrated the highest tensile strength, modulus, and crystallinity.
Tajaddod et al. 21 studied PAN/SWCNT composites with 50 wt.% SWCNT loading. Accordingly, two types of SWCNTs were used to produce two composites materials with well-arranged PAN-SWCNT interphase structures. Mohamed et al. 22 synthesized a new bifunctional benzoxazine monomer that possessed both coumarin and pyrene groups. Pyrene moiety of the bifunctional benzoxazine monomer enhanced dispersibility of single-walled carbon nanotubes (SWCNTs) in THF, which lead to the formation of highly dispersible coumarin–Py BZ/SWCNT nanocomposites stabilized through π–π stacking between the pyrene and SWCNT units,
Since PAN-containing composite fibers used in producing carbon fibers have to be heat treated, and the diameter of primary fibers has a great impact on properties of final carbon fibers, the diameter of primary fibers and the spinning method are of high importance. The lower diameter of nanofibers produced through electrospinning improves their quality compared to the fibers produced by the solution spinning method. This would increase the number of binding sites of nanofibers thereby improving mechanical properties and electrical conductivity of the nanofibers. Accordingly, electrospinning is the best method for creating PAN/CNT composite nanofibers. 23
Comonomers such as itaconic acid (IA), vinyl acetate (VA), and methyl acrylate (MA) are often added together into a PAN solution to obtain co-PANs of a high molecular weight.24–27 These commoners could enhance stabilization efficiency by decreasing the initiation temperature, 28 improving mechanical properties, 29 and increasing thermal durability of final CNFs. 26 Some new reports on this trend include the synthesis and use of polymers, such as polyacrylic acid-b-PAN-b-polyacrylicacid, 30 poly (acrylonitrile-block methyl methacrylate), 31 poly (acrylonitrile-co-β-Methylhydrogen Itaconate), 32 poly (acrylonitrile-ran-3-dimethylaminopropyl acrylamide-ran-itaconic acid), and poly (acrylonitrile-co-3, dimethylaminopropyl acrylamide) 33 as precursors for synthesis of CNFs.
Given the extensive research on PAN stabilization with MWCNT34–36 and due to the fact that SWCNT is expensive, few studies have been conducted on it. Thus, one of the objectives of this study is to investigate the presence of methyl methacrylate comonomer in it, being provided with polyacrylonitrile along with functionalized SWCNT in the stabilization phase.
Additives such as reinforcing nanofillers (CNTs or graphene sheets), and comonomers have demonstrated impressive strengthening abilities, among which, co-PAN polymers with convenient additives forming inter-chain crosslinking could be the future preference for high-strength CNFs. 37
The main objective of this study is to investigate modified properties of acrylonitrile copolymer with methyl methacrylate comonomer P (AN-co-MMA) of functionalized single-walled carbon nano tubes (F-SWCNTs) in stabilization process. In the present study, comparative analysis was performed for the first time between P (AN-co-MMA) fibers and P (AN-co-MMA) nano fibers reinforced with F-SWCNT P (AN-co-MMA)/F-SWCNT, which were produced by electrospinning and then stabilized. In addition, effects of the F-SWCNT concentration were examined on the morphology, and thermal properties of stabilized composite nanofibers via XRD, SEM, FTIR, and DSC.
Experimental
Materials
P (AN-co-MMA), [(C3H3N)n−-co-CH₂=CCOOCH₂], 94.6% acrylonitrile monomer, and 5.4% methyl acrylate monomer, with the molecular weight of 100,000 g/mol produced by the Polyacryl Isfahan Company were utilized. Besides, F-SWCNT (COOH-SWCNT), were provided from Nuterino with an outer diameter of 1–2 nm, inner diameter of 0.8–1.6 nm, length of 5–30 µm, purity of 90% and carboxyl acid weight of 2.73% (as the functionalized group) with the specific surface area of 380 g/m2, true density ~2.1 g/m3, electrical conductivity
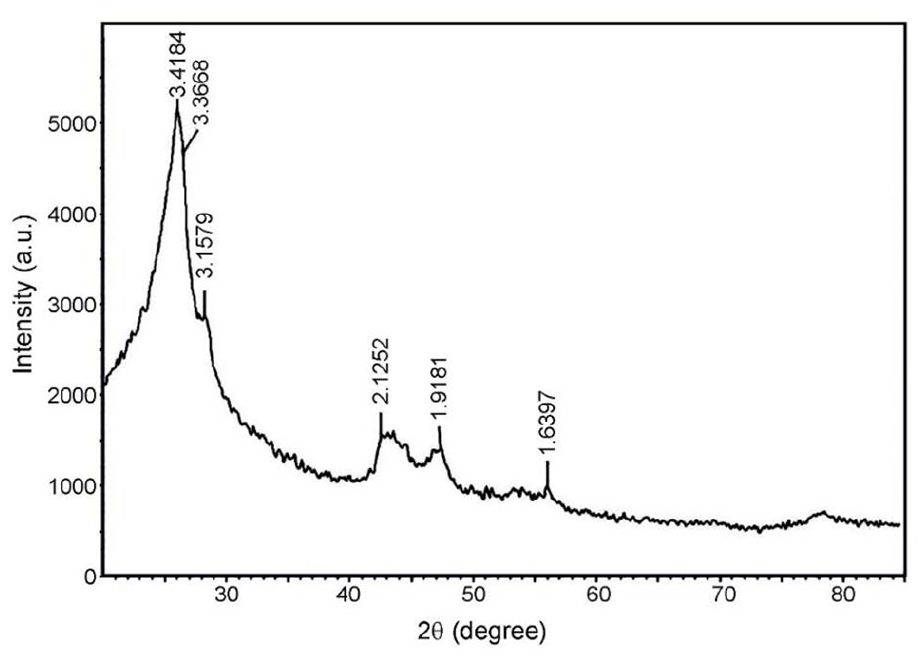
XRD pattern of SWCNTs (synthesized by CVD method). Here, incident X-ray wavelength (λ) = 0.154056 nm and Bragg peaks are obtained with Miller indices.
Preparation
P(AN-co-MMA)/F-SWCNT composite nanofibers were prepared. DMF solvent was used as the PAN solvent. Under the optimized electrospinning conditions of the P (AN-co-MMA) solution determined at a concentration of 12 (w/v%). Another effective factor in determining the concentration is the diameter of the nanofibers. For nanofibers to withstand high temperatures during heat treatment, they must have a diameter greater than 300 nm. Given these two factors, that is, fiber-free bead and the proper diameter, a suitable concentration of 12 (w/v%), the feeding rate:
2 μl/min, the voltage of: 8 kv and the spinning to collector distance of: 18 cm were chosen. In addition, functionalized nanotubes with the COOH group were used for proper dispersion of CNTs in a DMF solvent. Besides, an ultrasonic device was used to disperse the nanotubes. According to the studies and experiments, the best sanitization duration was 15 min. However, if the operation duration was long, the CNTs would be damaged and shortened with their desired properties reduced. 38
In the heat treatment method, the samples were electrospun on an aluminum foil collector for 20 h to reach the acceptable thickness. Web nanofibers containing 0, 0.5, 1, and 2 wt.% of F-SWCNT were produced, which were calculated in terms of the dry polymer mass. In contrast, in the samples containing 2 wt.% F-SWCNT, low incompatibility was observed in the diameter of nanofibers after stabilization, which could be attributed to the high percentage of CNTs. In addition, the 0.5 wt.% F-SWCNT of the nanotubes exerted no appreciable effect on the thermal behavior of the polymer therefore we only worked on the samples containing 0 and 1 wt.% of F-SWCNT.
According to previous studies on the stabilization of PAN, structural changes slowly began to occur at 180°C and continued until the temperature reached 270°C. At temperatures above 270°C, oxidation occurs due to excessive oxygen uptake which is not desirable. Therefore, the temperature range of 180°C–270°C was found to be suitable for stabilization. Since the P (AN-co-MMA) and P (AN-co-MMA)/F-SWCNT samples were compared with each other in the stabilization phase, a uniform temperature range was used to stabilize all of the samples. Using the temperature range mentioned above, 180°C, 230°C, and 270°C were selected for stabilization. The temperature increase rate is one of the major factors in the stabilization phase. Most researchers having studied the stabilization of PAN have reported optimal stabilization to occur upon an increase in the temperature of 1°C/min. It should be noted that samples stabilized at higher heating rates have a brittle and non-uniform appearance, which are not suitable for subsequent transfers 39 and remain at that temperature for up to 1-h after reaching the desired temperature.
Ultrasonic probe: An ultrasonic probe, model HD 3100, with the working power of 50 W was used to disperse F-SWCNT in a DMF solvent. Besides, the probe used was of an acid type and was immersed in the solution at the height of 3 cm.
Characterizations
Viscometer & Electrical conductivity meter: To evaluate viscosity and electrical conductivity of the solutions, a rotary viscometer (Brookfield, DV-II+Pro) and a conductivity meter (Model DDS-307, China) were employed.
Electrospinning device: The Japanese N1235 syringe pump was used to produce nanofibers, and the voltage was supplied by the Gamma high voltage. In addition, a 2 ml syringe and a G22 needle (the needle’s length was 34 mm and the needle’s inner diameter was 0.4 mm and its outer diameter was 0.7 mm) were used for the electrospinning task.
Polarized light microscope: The Japanese FXL/FXA polarized light microscope was used to determine optimal conditions for the electrospinning and observation of the electrospun nanofibers.
Scanning Electron Microscope (SEM): The morphologies of the composite nanofibers were observed using a scanning electron microscope (SEM) (EM3200/KYKY/20 kV) after applying a conductive layer coating (a SBC12-sputter coater) with a fixed collector. The device was used to observe the structure of the nanofibers and measure their diameters.
Besides, Image J software was used to measure the diameter of the nanofibers. For this purpose, diameters of 100 different points of the fibers were measured and the mean (d), standard deviation (STD), and coefficient of variation (CV%) were calculated. In addition, statistical analysis of variance (ANOVA) and the Scheffe test were performed at the confidence level of 95% using SPSS 17.0.
Fourier transform infrared spectroscopy (FTIR): FTIR spectroscopy was used to investigate the chemical structure and functional groups. The device used was Nicolet Magna m 560 IR, made in the USA. To investigate the structure of the P (AN-co-MMA)/F-SWCNT nanofibers after electrospinning and that of the nanofibers at different stabilization temperatures, spectroscopy was performed within the range of the 400–4000 cm−1 wavelength. In addition, to analyze the results of FTIR, E.S.P OMNIC Nicolet software was used.
X-ray diffraction (XRD): The crystallinity and size of the crystals in the nanofibers were examined by a Philips X-ray diffractometer (XRD) model PW1840/01. To obtain the XRD pattern of the nanofibers, a diffractometer with Ni filtered CuKα. Radiation (λ = 1.5418 A°, is the wavelength of the incident’s X-ray beam) at 40 kV and 30 mA was used. Besides, to calculate distances between the planes, the Miller index, (hkl), and the Bragg’s equation were used in accordance with equation (1). 38

Where
The Scherrer method was used to calculate the crystal’s size according to equation (2). 40

Where Lc is the crystal’s size and β represents the full width at half maximum height.
Besides, crystallinity could be calculated using the ratio of the integrated area of all crystalline peaks to the total integrated area under the XRD peaks. In addition, crystallinity of the samples (Xc) was calculated according to equation (3). 41

Where, Ia and Ic are integrated intensities of the amorphous and crystalline phases, respectively
Differential scanning calorimetry (DSC): DSC–60 (Shimadzu Co., Japan) was used for thermal analysis of the samples. Thermal analysis was performed within the temperature range of 40°C–400°C in the atmosphere with an increase in the temperature (10°C/min) for P (AN-co-MMA) and P (AN-co-MMA)/ F-SWCNT nanofibers.
Electric furnace: An electric furnace manufactured by the Nabertherm Controller was used to stabilize the P (AN-co-MMA) and P (AN-co-MMA)/F-SWCNT samples. The 1°C/min rate of temperature increase was used for stabilization purposes.
Statistical analysis: To analyze results of the statistical comparisons between various groups, the student’s t-test was used. Accordingly, all values were reported as the mean ± standard error of the mean. In addition, differences were considered statistically significant at p-value less than 5% (p < 0.05).
Results and discussion
Dispersion study of F-SWCNT
As mentioned before, an ultrasonic probe was used to disperse CNTs in a DMF solvent. To investigate the dispersion stability of CNTs for the production of composite nanofibers, a solution containing SWCNT and 1 wt.% F-SWCNT (F-SWCNT-1) was examined for 1 h and 1 month. After a month, no F-SWCNT residue was observed, and the solutions were completely stable (Figure 2).
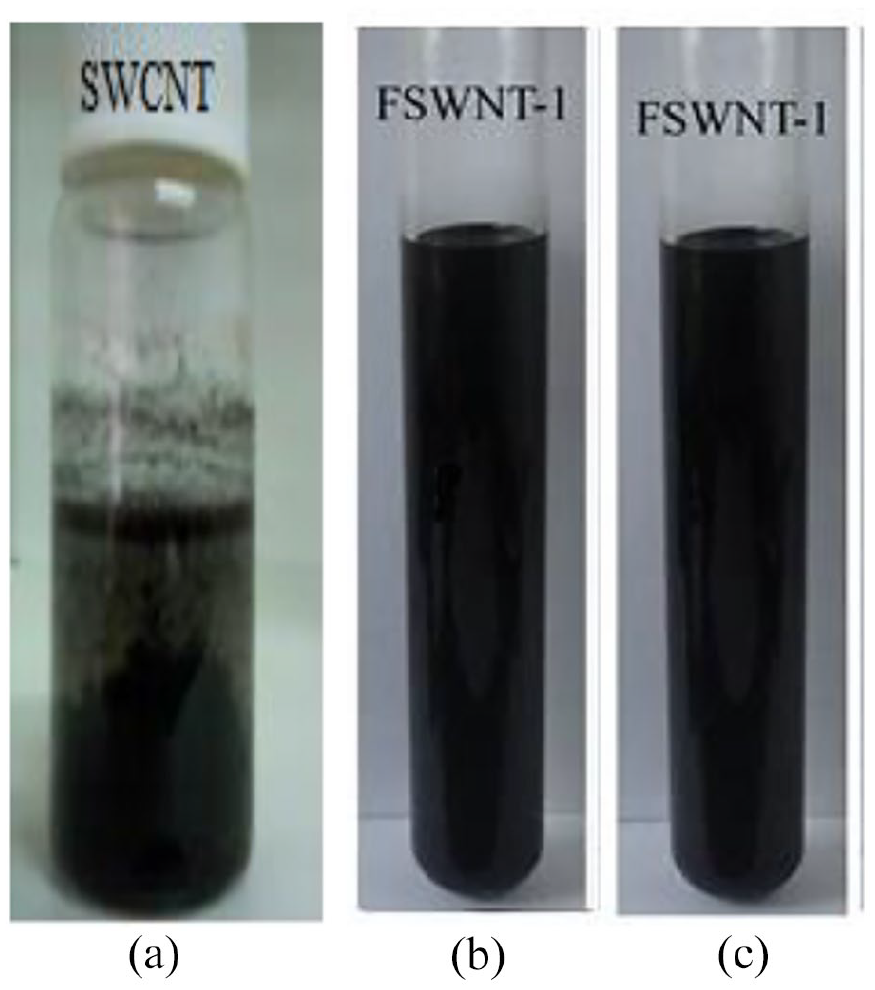
Instability of SWCNT solution dispersion in DMF immediately after ultrasonic (a), stability of F-SWCNT solutions dispersion in DMF in 1 h after ultrasonic (b), and in a month after ultrasonic (c).
Morphology of the electrospun nanofibers
The optimized electrospinning conditions of the P (AN-co-MMA) solution were determined at the concentration of 12(w/v%). In addition, the increase in the amount of CNTs in the polymeric solution resulted in the increasing of the electrical conductivity of the polymer solution (the electrical conductivity values of P (AN-co-MMA) and P(AN-co-MMA)/ F-SWCNT-1 is 0.38 ± 0.02 and 2.53 ± 0.05 µS/cm respectively), which led to a larger electrical current during the electrospinning process in the fluid jet. Therefore, with an increase in load agglomeration, adhesion forces would be overcome, and repulsive forces of the loads accumulated between the nanofibers would be intensified. As a result, velocity of the electrospinning process could increase, so the fluid jet would not have enough time to be optimally elongated by bending instabilities. Thus, the nanofibers’ diameter could increase significantly by adding the CNTs to the solution.42,43 In addition, the CNTs could increase the viscosity of the polymer solution, thereby increasing the viscoelastic force in the electrospinning process as well as the nanofibers’ diameter.44–46 In samples P (AN-co-MMA) and P (AN-co-MMA)/F-SWCNT-1, viscosity values are 419.9 ± 11.4 and 467.5 ± 14.2 cP, respectively. Figure 3 shows that upon the addition of F-SWCNT to the solution, the nanofibers’ diameter would increase. The results of an ANOVA test and the Scheffe test show that an increase in FSWCNT caused a significant change in the nanofibers’ diameter at all levels at the confidence level of 95%.
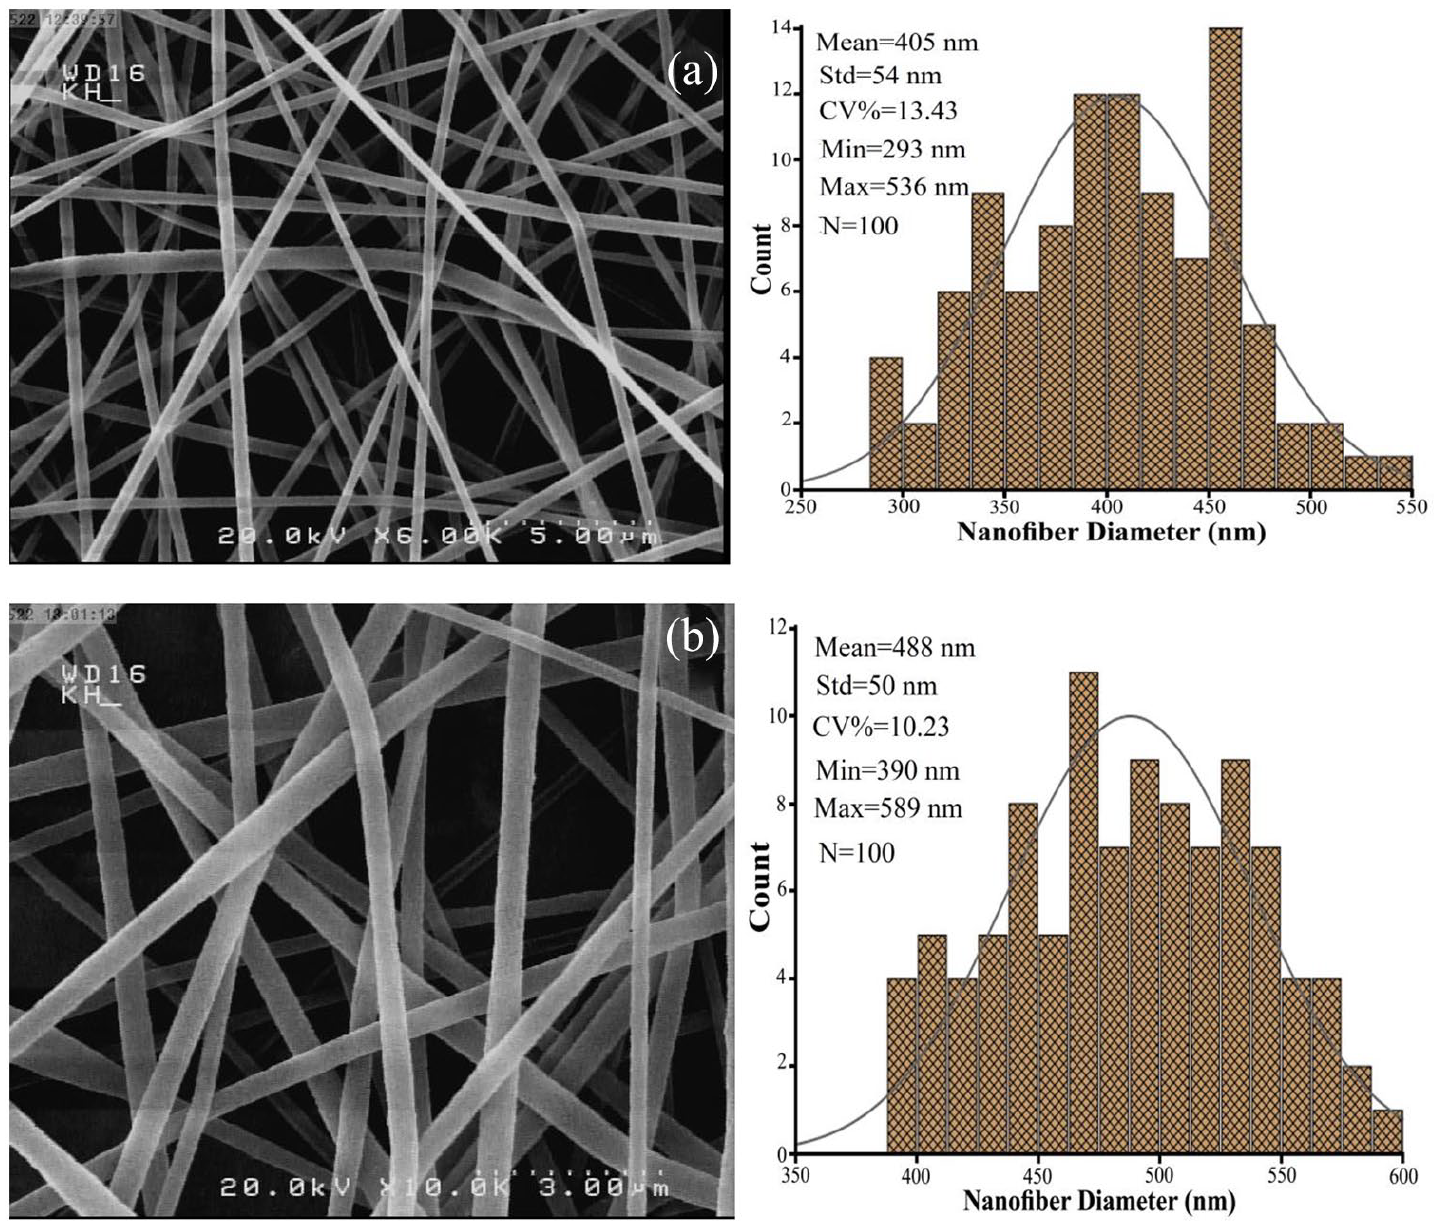
SEM images of: (a) P (AN-co-MMA) and (b) P (AN-co-MMA)/F-SWCNT-1 nanofibers as well as diameter distribution.
Investigation of thermal behavior in nanofibers
The exothermic peak of P (AN-co-MMA) vary between 200°C and 350°C, depending on cyclization, dehydrogenation, and oxidation reactions. Besides, the exothermic peak of P (AN-co-MMA) electrospun nanofibers occurred due to cyclization reactions that could take place at high temperature, thereby leading to the consumption of a small part of nitrile groups. 47
Figure 4 shows DSC diagrams of the samples of the nanofibers produced in the air. The Values of the initial temperature (Ti), final temperature (Tf), peak temperature (

The DSC diagram of composite nanofibers with P(AN-co-MMA)/F-SWCNT and P(AN-co-MMA).
Thermal properties of the DSC diagram of P (AN-co-MMA) and P (AN-co-MMA)/F-SWCNT-1 composite nanofibers.

In the P (AN-co-MMA)/F-SWCNT-1 sample, the initial temperature (Ti) and the peak temperature (
The DSC results are important because they could determine the range of operating temperatures at which the nanofibers are used. Besides, the results highly correlate with the ultimate thermo-mechanical stability and physical strength of the nanofibers. The stabilization stage involves several complex reactions taking place in an oxygen-containing environment. Oxygen penetration in the amorphous regions happens more easily and faster than in the crystalline regions, so stabilizing reactions start from the amorphous regions and then penetrate into the crystalline regions. Besides, the addition of the CNT reduces the mobility of polymer chains and increases their hardness compared to the P (AN-co-MMA) fibers; thus, oxygen penetration in these areas occurs more slowly, with the onset of stabilization reactions delayed; accordingly, the onset temperature of exothermic reactions rises to higher temperatures. 48
The amount of the heat released in the presence of F-SWCNT (2.34 J) decreased compared to pure P (AN-co-MMA) (4.21 J). In fact, the heat released during the stabilization reactions is influenced by two factors, including the type of reactions and the rate of reaction progress. Oxidation releases the highest amount of heat from the stabilization reactions, so the exothermic peak in the DSC diagram of nanofibers is mostly caused by the oxidation reaction during the stabilization phase. 48
One of the factors affecting the rate of reaction progress is the nanofibers’ diameter. The previous section showed that the P (AN-co-MMA) nanofibers’ diameter increased upon the addition of F-SWCNT. In the nanofibers with F-SWCNT, the oxidation reaction could not be complete, thereby resulting in less heat released due to the need for a longer time. In fact, it could be noted that upon adding F-SWCNT, exothermic reactions during the stabilization phase occur more mildly, thereby releasing less heat. As a result, defective areas are prevented in the structure of the final carbon nanofiber. 48
Concurrent with the temperature shifts, broadness of the peak decreases in the F-SWCNT-1 sample. It is well established that the first exothermic peak is attributed to the cyclization reaction of the PAN molecules. Besides, the shifted and broadened peak patterns indicate that the exothermic cyclization reaction of PAN has been facilitated and reduced when the fibers have been accompanied by F-SWCNT.
Investigation of the nanofibers’ morphology and diameter after the stabilization operation
Figure 5 shows SEM images of P (AN-co-MMA) nanofibers and P (AN-co-MMA)/F-SWCNT-1 stabilized at 270°C along with diameter distribution details.

SEM images of stabilized: (a) P (AN-co-MMA) and (b) P (AN-co-MMA)/F-SWCNT-1 as well nanofibers’ diameter distribution.
As can be seen, during the stabilization operation, the diameter of the pure P (AN-co-MMA) nanofibers reached 303 ± 20 from 405 ± 54 nm (a 25% reduction), whereas in the P (AN-co-MMA)/F-SWCNT-1, the diameter decreased from 488 ± 50 to 427 ± 59 nm (a 12.5% reduction). It could be argued that the presence of F-SWCNT has prevented a reduction in the nanofibers diameter during the stabilization phase.
Upon performing the thermal stabilization operation, the fibers tend to be released from the initial stress. This release of stress has caused the fibers to shrink. Upon the addition of F-SWCNT, crystallinity has increased (see Table 4), thereby making the polymer chains unable to move easily and making CNTs resistant to the tensile stress, so they did not change easily. Besides, CNTs could prevent thermal shrinkage of the fibers. The DSC results also revealed that the addition of F-SWCNT made stabilization reactions be performed more mildly with less heat released. Milder reactions imply that the nanofibers have not been exposed to sudden heat release, so their structure has changed less due to heat treatment. 48
Investigation of chemical structure changes to the nanofibers during the stabilization phase
As previously reported, 43 FTIR spectra of P (AN-co-MMA) and P (AN-co-MMA/F-SWCNT composite nanofibers presented different percentages of F-SWCNT. Typical characteristic peaks at 1629 and 2246 cm−1 correlating with bonds C‚C and C, N, respectively, have been recorded for the PAN polymer.49,50 Characteristic peaks at 1631 and 1732 cm−1, which correspond to bonds C‚C and C‚O, respectively, have been recorded for the PMMA polymer.51,52 For P (AN-co-MMA), the presence of peaks at 1730 and 2243 cm−1, and the disappearance of peaks at 1629 or 1631 cm−1, could be seen easily. This indicates that the copolymerization process has been realized by breaking double bonds in both monomers (AN) and (MMA). 50 As it could be seen in the FTIR spectra, all peaks in the PAN have also been observed in the PAN/F-SWCNT spectra, yet the intensity of the peaks has been different in the four samples.
Figures 6 and 7 show the FTIR spectra of the nanofibers, which have been heat treated at three different temperatures. According to the FTIR results, several chemical reactions have occurred during the stabilization phase. Accordingly, the reaction of the nitrile groups (N ≡ C) has resulted in a structure containing the N ═ C group. This group has been formed as a result of the intermolecular cyclization or formation of intracellular crosslinks. The structural formation of the C═C group has been resulted from dehydrogenation. Besides, oxidation gave rise to carbonyl groups (O ═ C). In addition, the index peak in the P (AN-co-MMA) fibers’ structure belongs to the nitrile group (N≡C) with the wave number of 2243 cm−1, which indicates the highest rate of change during the heat treatment process, yet it decreases upon an increase in the temperature. As the height of the peak decreases to 2243 cm−1, a new peak is generated at 1595 cm−1, which matches up to a combination of H–N, C═C, and N ═ C. During the stabilization phase, the peak of the N ≡ C group does not completely vanish. This confirms that a number of N ≡ C groups remain in the fiber structure, which indicates a stable semicircular fiber structure.53,54 Table 2 shows a summery of FTIR spectroscopy absorption of P (AN-co-MMA) and P (AN-co-MMA/F-SWCNT-1 nanofibers by frequency regions during the heat treatment process.

FTIR spectra of raw P (AN-co-MMA) and stabilized P (AN-co-MMA) nanofibers at different temperatures.

FTIR spectra of raw and stabilized P (AN-co-MMA)/F-SWCNT-1 nanofibers at different temperatures.
A summery table of FTIR spectroscopy absorption of P (AN-co-MMA) and P (AN-co-MMA/F-SWCNT-1 nanofibers by frequency regions during the heat treatment process.

FTIR results of the nanofibers indicate that the stabilization reactions are initiated poorly at 180°C. Upon an increase in the temperature, the peak height of the nitrile group decreases to the wave numbers of 2243 and 1730 cm−1, corresponding to the ester O═C groups in the fibers. Besides, the peak in the nitrile group is observed at the highest temperature (270°C). Indeed, if all nitrile groups undergo a cyclic reaction, the N ≡ C peak will be completely eliminated. However, since a cyclic reaction occurs randomly, and some of the nitrile groups are isolated and hard to react with, a small amount of the nitrile groups always remains in the structure of the fibers after the stabilization phase. This, in turn, would result in the formation of semi-circular structures in the stabilized nanofibers.
Upon an increase in the stabilization temperature, the peak heights at 1450 and 2932 cm−1 corresponding to the aliphatic methylene group in the linear structure decrease, and a new broader peak at 1595 cm−1 is formed, which is related to the C═C group in the stable nanofiber structure. Besides, upon the progress in the stabilization phase, a new peak at 810 cm−1 corresponding to the H-C ═ C group is created in the nanofiber structure. The removal of the peaks of the aliphatic methylene group and the emergence of new peaks at 1595 and 810 cm−1 emphasize the conversion of the linear structure to a semi-cyclic structure upon the progress in the cyclization and dehydrogenation reactions during the stabilization phase. 55
The peak state corresponds to the nitrile group in the raw nanofibers at the wave number of 2243 cm−1. At 180°C, the peak state remained fixed, but its height decreased. This indicates that the number of the primary nitrile groups (nonreactive nitriles) decreased to a small extent. Upon an increase in the temperature, not only did the peak height decrease, but its position changed as well. At 230°C, the nitrile group peak had a broader range and a smaller height, yet at 270°C, the peak state changed and moved to a lower wavenumber. This could be caused by the onset of the stabilization reactions during which the primary nitrile groups enter the cyclic reaction, with their amount decreased. At higher temperatures and upon the progress in the stabilization reactions, some of these primary nitrile groups are converted to conjugated nitrile and β-amino nitrile groups as the reactions occur. Accordingly, the peaks of these two groups of nitriles occur at high stabilization temperatures. Besides, since the peaks of these three types of nitrile groups are very close together, the formation of the other two peaks increases the initial peak. Finally, an increase in the number of β-aminonitrile groups makes the peak state shift to a lower wave number.
According to the FTIR spectra, the increase in the peak of the nitrile group at 230°C and the change in the peak state at 270°C in the pure P (AN-co-MMA) nanofibers are greater than those in the composite nanofibers. This indicates that the formation of the β-amino nitrile groups has decreased in the presence of F-SWCNT. As a result, the stabilized F-SWCNT-1 nanofibers would have better properties than pure P (AN-co-MMA) nanofibers.
The extent of reaction (EOR) was used to assess the impact of P (AN-co-MMA)/F-SWCNT on the progress in the stabilization reactions, which was calculated by equation (4). 56 The calculation results for the nanofibers produced at different stabilization temperatures are presented in Table 3.
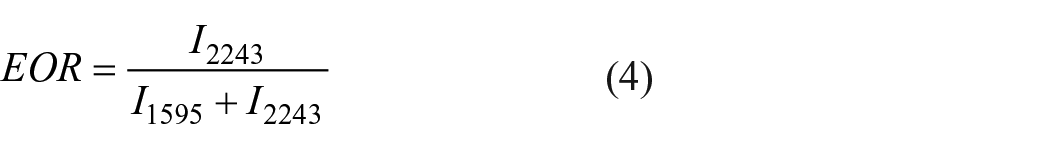
In this equation, I2243 and I1595 are the peak intensities at 2243 cm−1 (being attributed to the nitrile group, with C ≡ N) and 1595 cm−1 (being attributed to the C═C and N═C groups) respectively. Besides, the EOR value varies between 1 and 2.
Extent of reaction (EOR) values for stabilized P (AN-co-MMA) and composite nanofibers.

According to the results of Table 3, the stabilization reactions of the pure P (AN-co-MMA) nanofibers are higher than those of the P (AN-co-MMA)/F-SWCNT-1 sample at 180°C, which indicates that at low temperatures (180°C), the progress in the stabilization reactions is delayed in the presence of F-SWCNT, and the value of the stabilization index is reduced.
As the amorphous regions in the pure P (AN-co-MMA) nanofibers are higher than those in the P (AN-co-MMA)/F-SWCNT-1 sample, stabilization reactions in the pure P (AN-co-MMA) start earlier and progress more due to access to more amorphous regions. 48 At 230°C, the EOR of the pure P (AN-co-MMA) sample is higher than that of P (AN-co-MMA)/F-SWCNT-1, but the two samples have an almost equal EOR at 270°C. It appears that due to the complete inactivation of the stabilizing exothermic reactions at low temperatures, there is no energy required for penetrating the crystalline regions; however, upon a rise in the temperature and initiation of exothermic reactions, the energy required for penetrating the crystalline regions is generated by the heat provided, and the stabilization reactions penetrate the crystalline regions. As a result, stabilization could have been equally achieved at high temperatures throughout the nanofibers’ structure.
However, this situation is observed in the sample P (AN-co-MMA)/F-SWCNT-1. Besides, the results will differ with a change in the sample conditions, including the type of copolymers, the percentage of F-SWCNT, as well as the sample production method through electrospinning with a flat-plate collector as against a rotary collector.
Investigation of crystal structure changes in nanofibers after XRD stabilization
The XRD spectra and properties of the raw and stabilized nanofiber spectra at 270°C are shown in Figures 8 and 9 as well as Table 4, respectively. The PAN nanofiber shows a diffraction peak centered around 2θ angles of 17° and 26°. These two peaks represent the X-ray reflection of (100) of a hexagonal structure and (110) crystallographic planes in PAN. The high diffraction peak at 2θ = 17° corresponding to the (100) crystal plane reflects the spacing among the molecular chains. Besides, the other diffraction peak at 2θ = 26° corresponding to the (110) crystal plane is observed, which reflects the distance between the near parallel molecular pieces. In addition, the crystal structure is destroyed during the stabilization stage due to the formation of the cross-linked ladder structures in PAN fibers, thereby leading to a decrease in crystallinity of PAN fibers.57,58 As the figures show, the intensity of peak 2θ = 17 decreased after the stabilization phase at 270°C, and a new peak was achieved at 2θ = 25, instead. The appearance of this broad peak in the XRD spectrum indicates the onset of the growth in the graphite crystal structure and the conversion of the linear structure to the cyclic structure during the heat treatment.47,56
Characteristics obtained from XRD results for raw and stabilized nanofibers at 270°C.

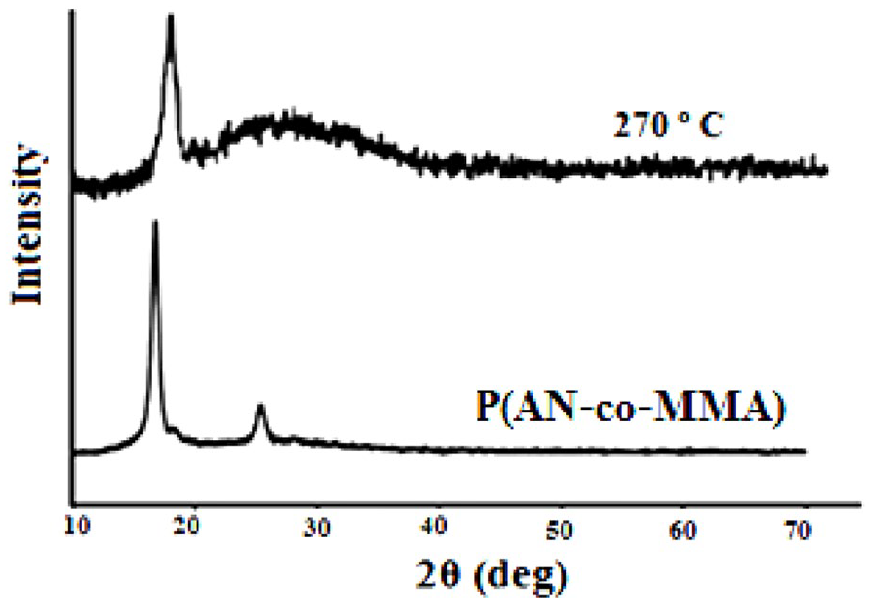
XRD spectra of raw and stabilized P (AN-co-MMA) nanofibers at 270°C.

XRD spectra of raw and stabilized P (AN-co-MMA)/F-SWCNT-1 nanofibers at 270°C.
The values presented in Table 4 show that with stabilization achieved at 270°C, the peak center of the plane (100) did not change much, yet the height and area under the peak decreased significantly. The decrease in the height and area under the peak of the plane (100) in P (AN-co-MMA)/F-SWCNT-1 is greater than that in the pure P (AN-co-MMA) sample. Accordingly, the decrease affects crystallinity of the stabilized nanofibers. As one could see, during the stabilization process, crystallinity of the pure P (AN-co-MMA) nanofibers increased from 44% to 38%, (equivalent to a 13.6% reduction), whereas in P (AN-co-MMA)/F-SWCNT-1, crystallinity decreased from 47% to 24% (equivalent to a 48.9% reduction).
Accordingly, during the stabilization process, crystallinity of the nanofibers decreased, and crystallinity increased in the P (AN-co-MMA)/F-SWCNT-1 sample. In addition, the size of the crystals decreased due to the heat treatment during the stabilization process as well, with this indicating that at high temperatures, the crystalline regions were involved in stabilizing reactions, and the size of the crystals decreased as a result. As a result of the heat treatment, the size of the crystalline particle in pure P (AN-co-MMA) decreased from 26.9 to 11.4 nm (equivalent to a 57.5% reduction), and in the P (AN-co-MMA)/F-SWCNT-1 sample, it decreased from 18.3 to 11.84 nm (equivalent to a 35.4% reduction). The DSC results revealed that the stabilization reactions proceeded slowly in the presence of F-SWCNT, and that the reaction heat was not released abruptly, which caused the stabilization reactions to be triggered more mildly. Besides, carbon nanotubes, like chambers around the crystals, prevented large changes in the crystal size during the stabilization process.
According to Figures 8 and 9, the peak growth of 2θ = 25 is greater in the stabilized P (AN-co-MMA)/F-SWCNT-1 than in the stabilized pure P (AN-co-MMA) sample. This indicates that the crystal sizes of the cyclic structure (corresponding to the peak 2θ = 25) are a little larger in
P (AN-co-MMA)/F-SWCNT-1. In fact, CNTs are embedded in the P (AN-co-MMA) polymer’s substrate, thereby facilitating the growth of the crystals of the cyclic structure during the stabilization phase. 59
Calculated values of Lc/d100 for the two stabilized pure P (AN-co-MMA) and P (AN-co-MMA)/F-SWCNT-1 indicated that the arrangement decreased with stabilization in both samples. In addition, the decrease in the arrangement in the pure P (AN-co-MMA) sample (from 50.63 to 22.07) was more than that in the P (AN-co-MMA)/F-SWCNT-1 sample (from 33.65 to 22.77). In fact, the presence of CNTs preserves the nanofibers’ arrangement during the heat treatment process.
During the thermal stabilization phase, the peak intensity of 2θ = 17 decreased significantly, yet the peak did not interfere with other peaks. Therefore, upon using the intensity of this peak in raw fibers and stabilized fibers, the stabilization index (SI) could be calculated at 270°C. The stabilization index is used to quantify the progress in the PAN fiber stabilization operations as obtained by equation (5). 60

Where,
In this equation, I25 and I17 are diffraction intensities of 2θ = 25 and 2θ = 17, respectively.
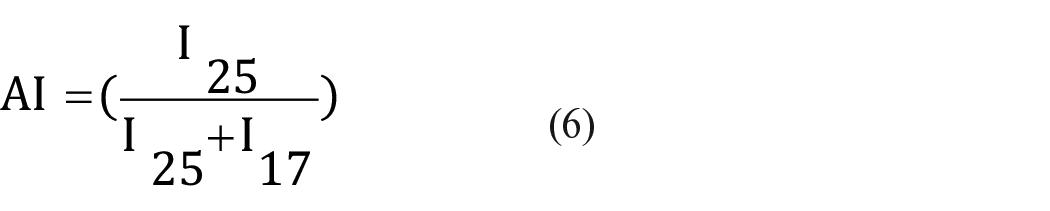
Aromaticity index (AI) and stabilizing index (SI) values of P (AN-co-MMA) and P (AN-co-MMA)/F-SWCNT-1 nanofibers stabilized at 270°C.

As Table 5 shows, values of both stabilization and aromaticity indices were higher in the P (AN-co-MMA)/F-SWCNT-1 sample than in the pure P (AN-co-MMA) samples. Since crystallinity is higher in the sample containing CNTs than that in the pure polymer, the sample containing CNTs exhibits a greater improvement in stabilization at high temperatures. Therefore, stabilization and aromaticity are greater for the sample containing F-SWCNT.
Conclusion
The P(AN-co-MMA) nanofibers and P (AN-co-MMA) with F-SWCNT were produced by electrospinning and became stabilized. The results showed that the nanofibers were produced uniformly with no structural defects. Upon the addition of F-SWCNT, the average diameter of the nanofibers increased.
Besides, the SEM images of the stabilized samples at 270°C showed that the stabilization operation reduced the diameter of the nanofibers, with this decrease having been less significant in the sample containing F-SWCNT. The addition of F-SWCNT to P (AN-co-MMA) enhanced its thermal stability, thereby preventing drastic structural changes during the stabilization process.
The FTIR spectra of the stabilized nanofibers at 270°C showed that the formation of β-amino nitrile groups decreased in the presence of F-SWCNT. The lower the number of these groups in the fiber structure was, the fewer the chains would be disrupted in the stabilized fibers, thereby resulting in less defective carbon nanofibers and better mechanical properties.
The XRD of the stabilized samples showed that the values of both stabilization and aromaticity indices in the sample containing F-SWCNT were higher than those in the pure P (AN-co-MMA) sample. In other words, the improvement in the stabilization reactions at 270°C was higher in the presence of F-SWCNT than in pure P (AN-co-MMA), with the presence of F-SWCNT shown to have largely prevented a decrease in the crystal size and the nanofiber arrangement during the process stabilization.
According to the DSC results, the initiation temperature of the reactions and the peak temperature shifted to higher temperatures in the presence of F-SWCNT. In fact, the presence of F-SWCNT delayed the onset of the stabilization reactions at low temperatures. In addition, the amount of the heat released during the stabilization reactions was less in the sample containing F-SWCNT than in the pure P (AN-co-MMA) samples. This finding indicates that F-SWCNT causes stabilization reactions to be performed more mildly, with less heat being released. As a result, the nanofibers are not damaged during the stabilization process.
Supplemental Material
sj-pdf-1-jef-10.1177_15589250211046243 – Supplemental material for A stabilization of the electrospun, modified polyacrylonitril with functionalized single-walled carbon nanotubes
Supplemental material, sj-pdf-1-jef-10.1177_15589250211046243 for A stabilization of the electrospun, modified polyacrylonitril with functionalized single-walled carbon nanotubes by Fateme, Marjan Abbasi and Akbar K Haghi in Journal of Engineered Fibers and Fabrics
Footnotes
Acknowledgements
The work was supported by University of Guilan, Rasht, Iran.
Declaration of conflicting interests
The author(s) declared no potential conflicts of interest with respect to the research, authorship, and/or publication of this article.
Funding
The author(s) received no financial support for the research, authorship, and/or publication of this article.
Data availability statement
The data that supports the findings of this study are available in the supplemental material of this article.
Supplemental material
Supplemental material for this article is available online.
References
Supplementary Material
Please find the following supplemental material available below.
For Open Access articles published under a Creative Commons License, all supplemental material carries the same license as the article it is associated with.
For non-Open Access articles published, all supplemental material carries a non-exclusive license, and permission requests for re-use of supplemental material or any part of supplemental material shall be sent directly to the copyright owner as specified in the copyright notice associated with the article.