
Abstract
The following analysis deals with the validation study for the already published thermal simulation of the human body-clothing-environment system through wear trials. Three test persons and a clothing system were selected for this study. The simulation process chain includes 3D scanning, clothing fit considering the deformation properties of fabrics, 3D analysis of air gaps between skin and clothing, and thermophysiological analysis of the human body taking into account different metabolic rates. Moreover, subjective wear trials were performed in a climatic chamber to validate the simulation results. The results show good validation for the core body and mean skin temperature, however, discrepancies were observed on comparing the local skin temperatures. The presented simulation approach offers a holistic solution for product development in the areas of sportswear, workwear, outdoor, and protective clothing.
Keywords
Introduction
Thermophysiological responses; mean skin and body core temperatures are the key factors that describe the thermal comfort of the human body. 1 These factors can be influenced by human body interaction with a consistently changing environment, which causes heat exchanges between them. Human body maintains its critical core temperature within a limited range of 37 ± 0.5°C. 2 In this situation, clothing plays an important role by providing the required barrier between the body and the environment. The clothing thermal and deformation properties are the essential clothing parameters. The thermal properties of clothing are responsible for heat and moisture transfer from the clothing, whereas, the deforming properties direct the development of different shapes of air gaps between the body and clothing. In order to examine the thermophysiological wear comfort of any garment, laborious empirical method “wear trials” are usually performed in a climatic chamber under controlled climate and the thermophysiological responses of the test persons are recorded. However, it is not possible to adopt this method for every scenario due to ethical reasons and the bulk sample size of human beings that are required for reliable conclusions. Therefore the intensive research has been made by researchers to replace the empirical investigation method of thermal regulation of the human body through simulation and modeling. This effort has led to the development of advanced thermophysiological human models3–8 and thermal sensation models.9–11 The environmental parameters, activity level (metabolic rate), clothing thermal properties, and sometimes the individual characteristics (weight, height, age) are used as the input for the thermophysiological models. However, the outcomes of these models can be recorded in terms of the body core temperature, mean skin temperature, local skin temperature, as well as the time derivative of these temperatures, which are features of thermal sensation and thermal comfort of the human body.
Microclimate has a very important role in the thermal regulation of any clothing system.12–14 Since microclimate is affected by many factors like continuously changing ambient environment, thermophysiological properties of the relevant body element, and characteristics of the clothing, therefore complex thermal transportation phenomenon exist in microclimate. Previously, many thermal simulation methods for the human body—clothing—environment system have been proposed based on the principle that either the air gap underneath the clothing has a constant thickness or does not exist.15–20 In contrast to this assumption, these air gaps are unevenly distributed very next to the skin of the body, and it mainly depends on the human body shape and clothing style and draping properties.21,22–24
In the first phase of the research work, a thermophysiological simulation method was proposed,25–27 which considers the changing climatic conditions, clothing fit, human activity level, nonuniform air gaps, and thermal and mechanical properties of clothing. The objective of the present work is the next phase of research in which thermal simulations of the human body-clothing-environment system for three different test persons were performed. The simulation results were compared with the subjective wear trial’s results. The subjective wear trial is a useful technique to record the thermophysiological response of the selected test person while wearing certain clothing ensembles and performing specific activities in a controlled environment.
Material and methods
This section is composed of three subsections; the preparation phase, wear trials, and thermal simulation.
Preparation
The selection of outdoor clothing is always based on environmental conditions and the type of outdoor activities (trekking, jogging, hiking, etc.), therefore many outdoor ensembles are available on the market, which serve the required purposes and comfort of the wearers. In this study, a clothing system consisting of a long-sleeve shirt and a trouser was selected for specific environmental conditions (temperature 23°C, relative humidity RH 50%). The following Table 1 shows the details of textile materials that were selected for the clothing system (CS). Each clothing system was manufactured according to the individual body shape and size.
Selected fabrics for the clothing system.

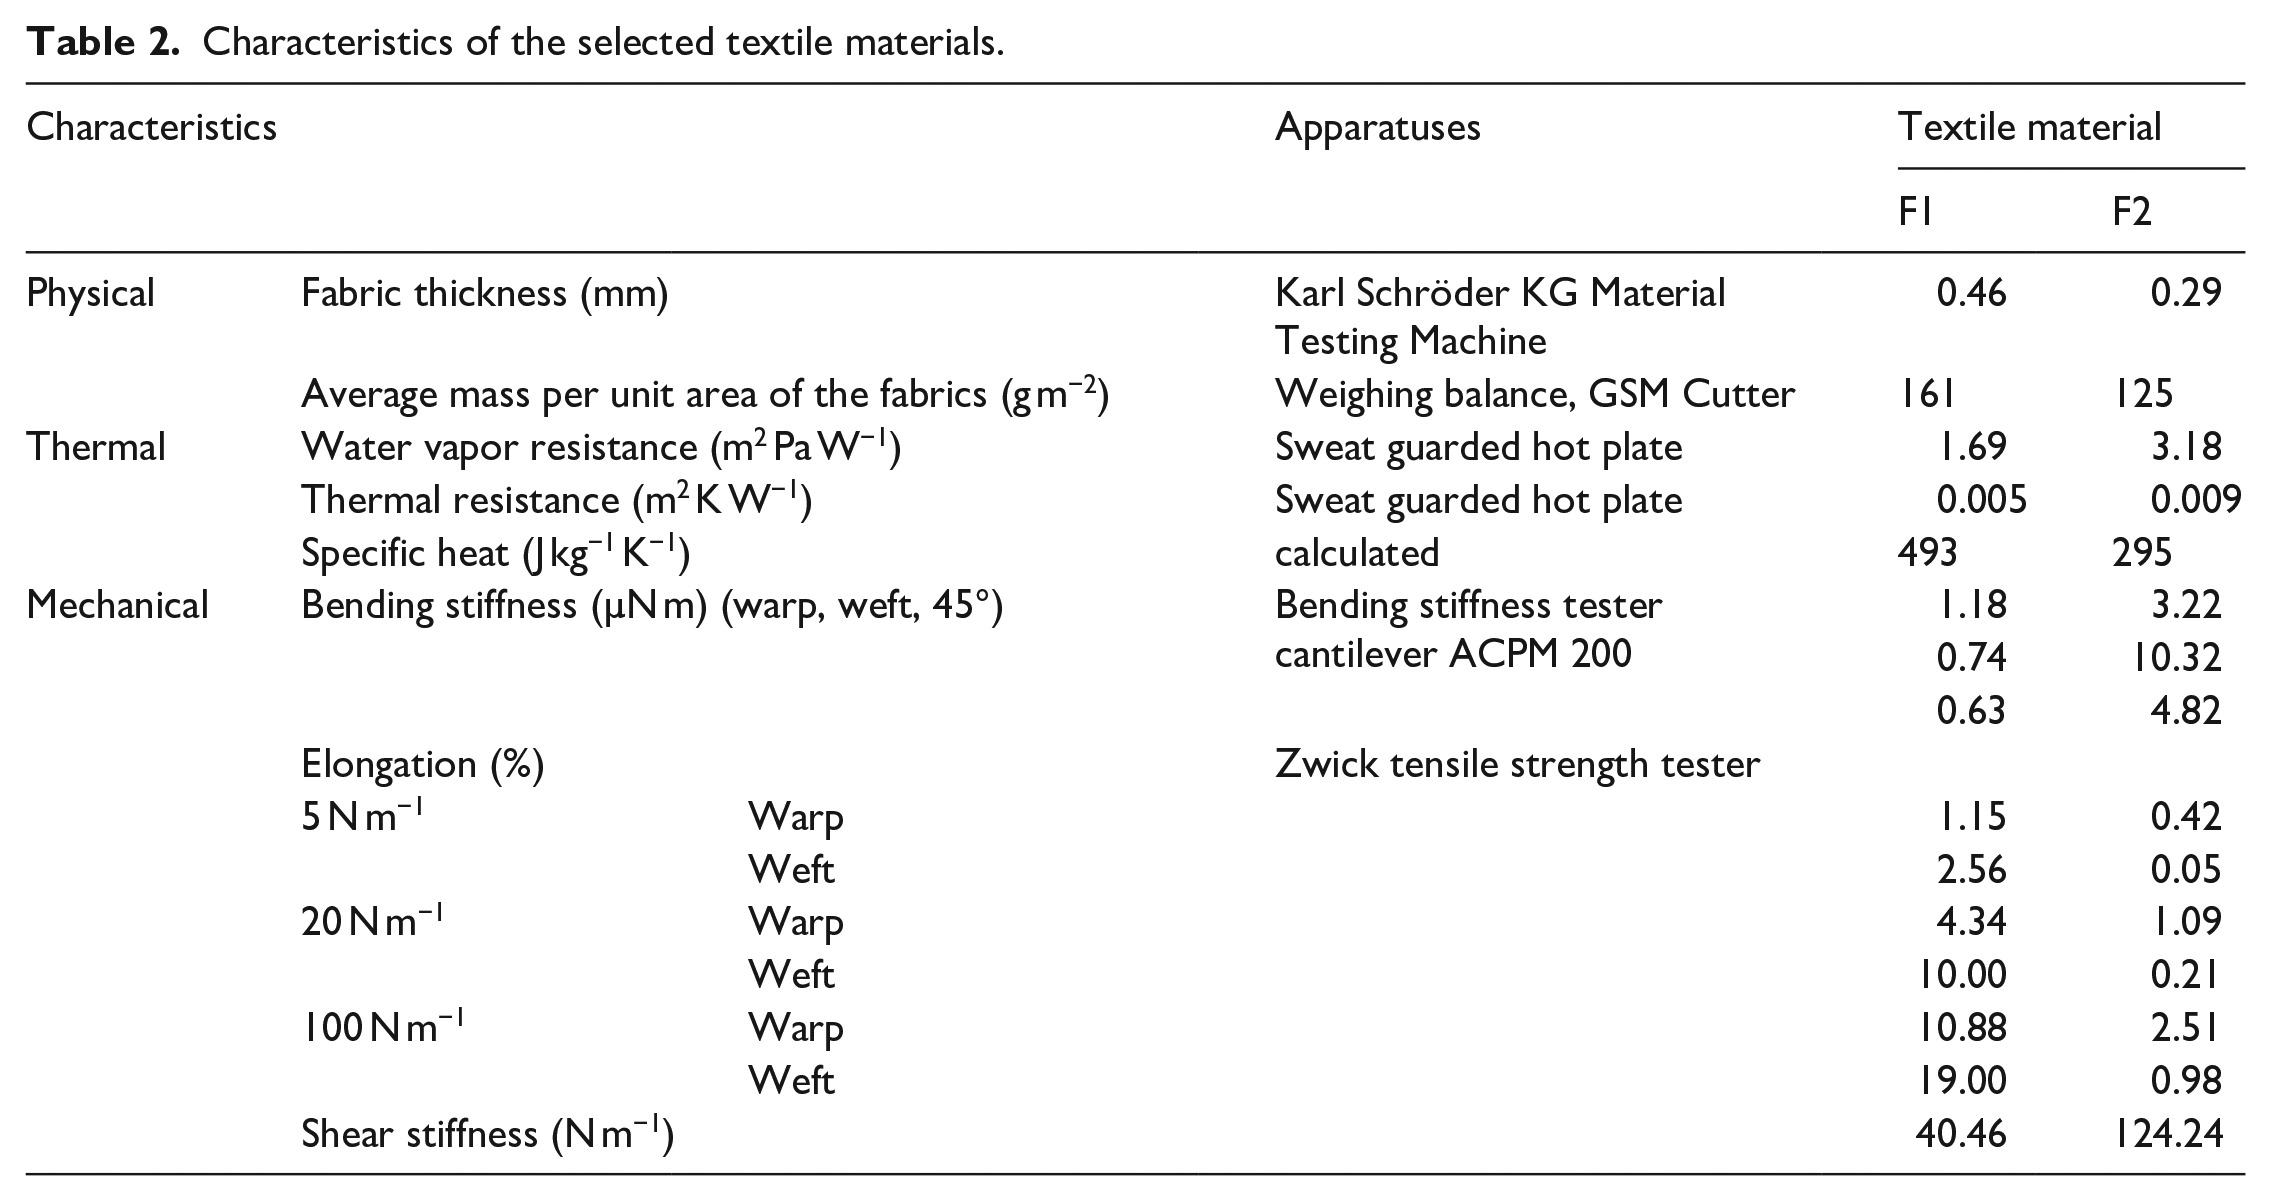
The selected textile materials were characterized based on the prerequisites of the fit and thermal simulation. Table 2 shows the physical, mechanical, and thermal properties.
Characteristics of the selected textile materials.
Three test persons (TP) were selected to perform the thermophysiological simulation and wear trials, who voluntarily participated in this study. The test persons were medically examined and declared healthy. The test persons are different in their height and weight (Table 3).
Weight, height, age, and body mass index of selected test persons.

Since the thermal simulation process needs virtual models of the test persons, the test persons were scanned in standard body posture before sewing the clothing system. The scanning was done with the help of a 3D-body scanner VITUS. 28 A large amount of point cloud was obtained as an output of each scanning that was utilized to develop the polygon models of test persons. The software Geomagic Studio 10 29 was used for the purpose of refining and repairing polygon models in order to prepare them for further simulations. The polygon model that represents the approximate shape of test person is a facet model and consists of a large number of planar triangles. In order to develop a uniform and smooth surface of the models, the surface reconstruction of the polygon model of test persons was carried and consequently, the nonuniform rational B-splines (NURBS) models were achieved. The polygon models of the test persons and the NURBS model of TP-3 are shown in Figure 1.
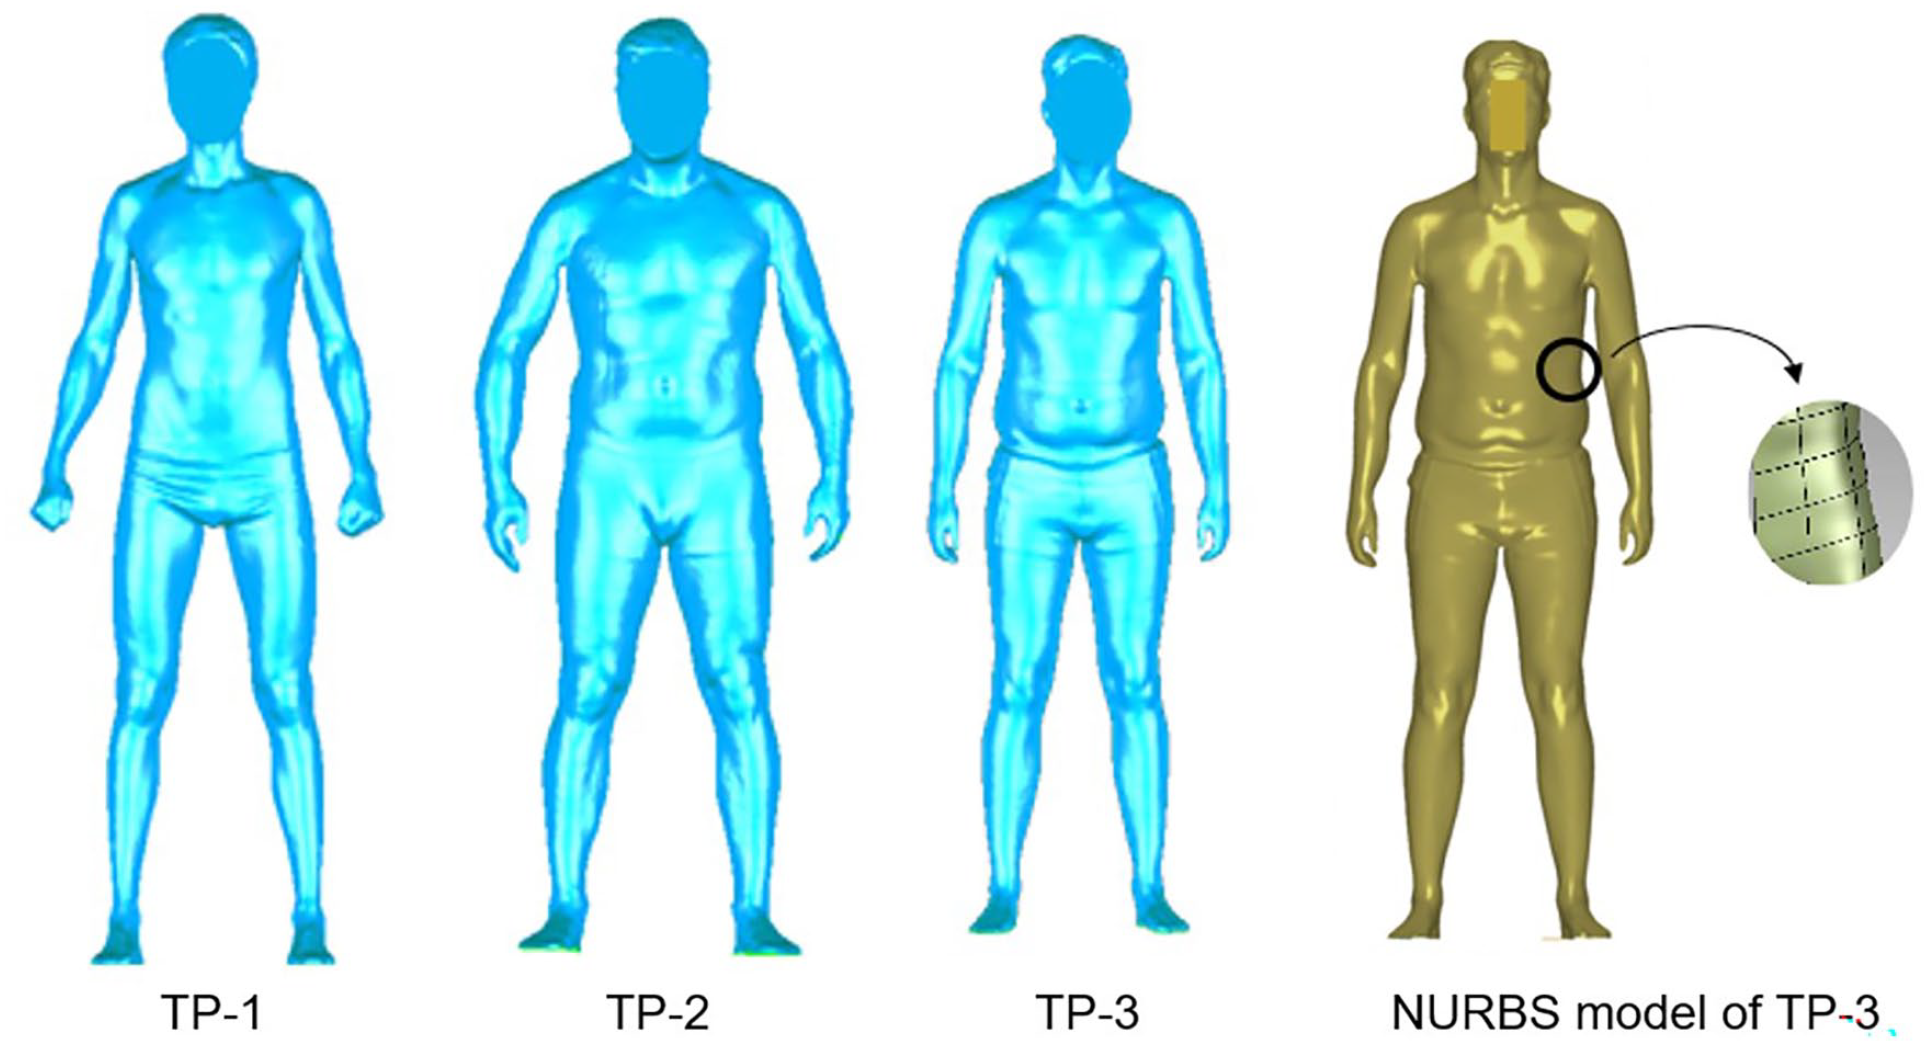
3D polygon models of the test persons (TP) and NURBS model of the TP-3.
Moreover, these virtual models were further used to determine the body measurements according to the ISO 8559 and DIN EN ISO 7250. The 2D patterns of CS were developed by means of 2D CAD software Grafis. 30 Grafis is interactive software that ensures maximum flexibility in body measurements, ease parameters, possibilities for integrated import and export interfaces (like AAMA/DXF, ASTM/DXF, DXF) and most importantly the consideration of individual body measurements during pattern making. 31 Figure 2(a) and (b) shows the 2D patterns of long-sleeve shirt and trousers.
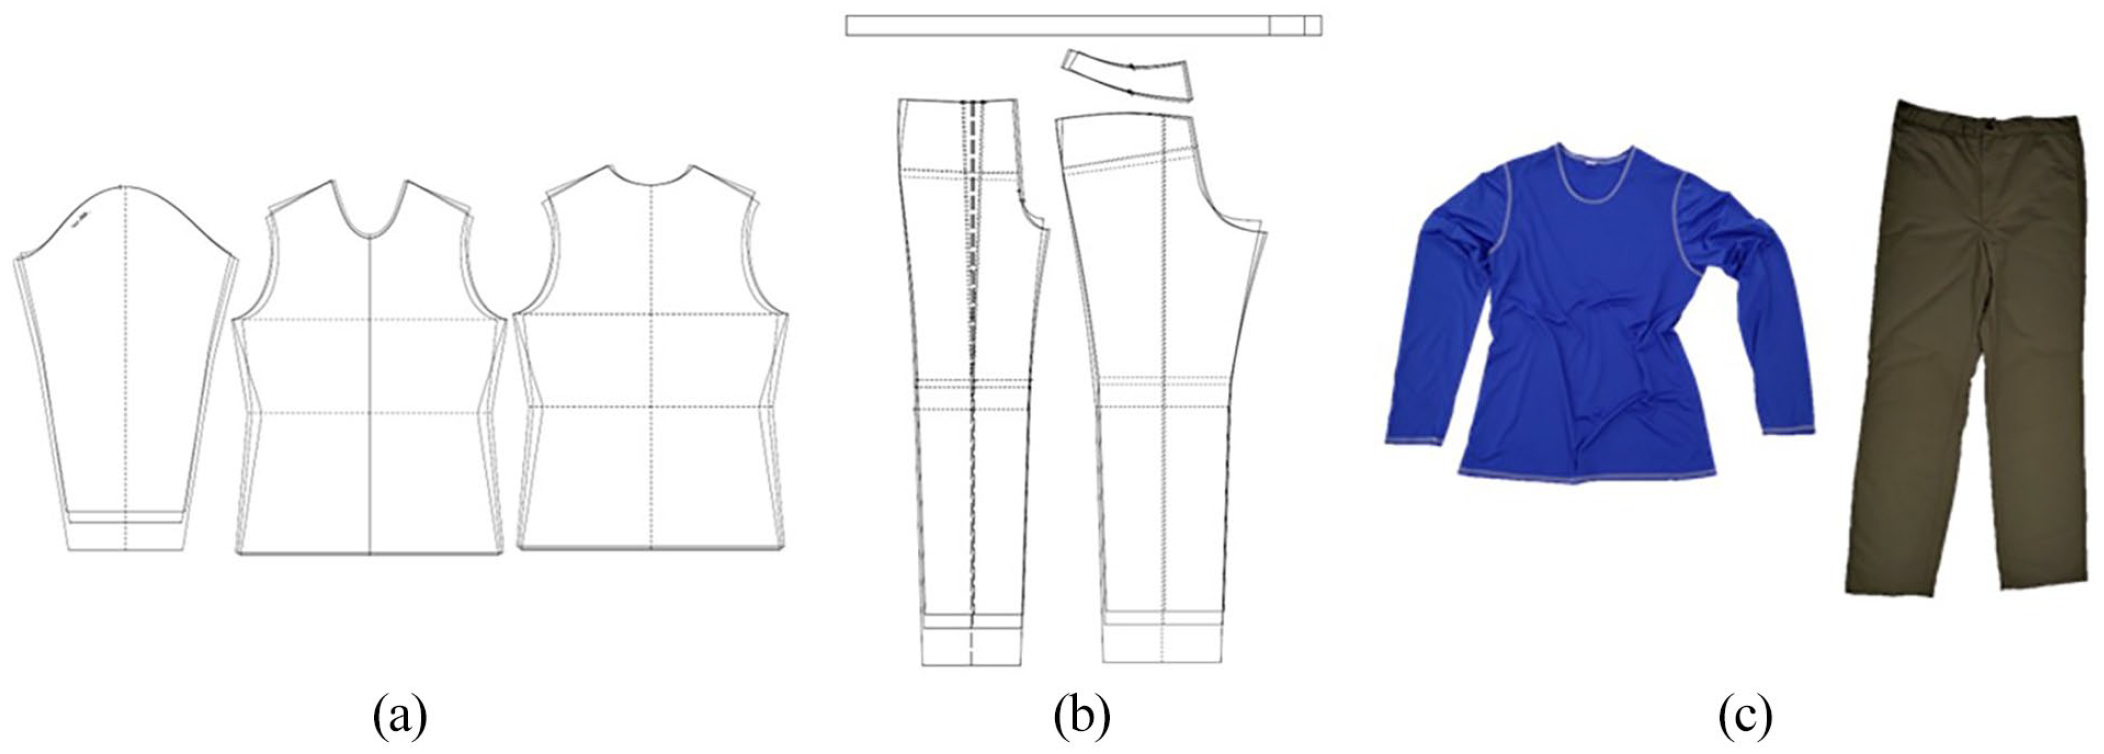
(a) 2D patterns of long-sleeve shirt, (b) of trousers for three test persons, and (c) long-sleeve shirt and trousers for TP-3.
Commercially available software Modaris V8. 32 by Lectra was used in this research work for the fit simulation of the CS. This software gives the opportunity to simulate complex clothing designs by considering the fabric draping properties. The 2D patterns of CS already developed in Grafis and exported as AAMA/DXF file format was imported into Modaris V8. Subsequently, the 3D virtual models of test persons (Figure 1), which were developed by scanning and processed in Geomagic software, were also imported into Modaris V8. After virtual sewing (defining seams according to design) and assigning the deforming properties according to FAST (Fabric Assurance by Simple Testing Systems) 33 to the pattern cuts in Modaris V8, the fit simulation of CS for each test person was carried out separately (Figure 3).

Fit simulation of CS for all test persons.
Besides the virtual sewing and fit simulation of CS, the pattern cuts were prepared for each test person, and garments were sewn for the wear trials as shown in Figure 2(c).
Wear trials
Wear trials were performed at the Hohenstein Institut für Textilinnovation GmbH to analyze the thermophysiological behavior of the test persons. All the wear trials were performed in a climate chamber under predefined environmental conditions (23°C, RH 50%). The wear trials were planned in such a way that every test person has to perform two wear trials on two different consecutive days, if the first one was in the morning then the second one must be in the afternoon and the other way round. The test procedure took 125 min (Table 4) and defined activities were performed by each test person on a motor-driven treadmill (Kettler Track Experience, Ense-Parsit).
Test procedure.

The heart rate was recorded with the pulse belt (Polar Wearlink, can be seen in Figure 4). The temperature and wetness of the skin and microclimate humidity were recorded with the help of sensors MSR 345 Datalogger (MSR Electronics GmbH, Seuzach, Switzerland). The temperature and humidity sensors were attached to nine different locations of the test person’s body according to ISO 9886 34 as shown in Table 5.
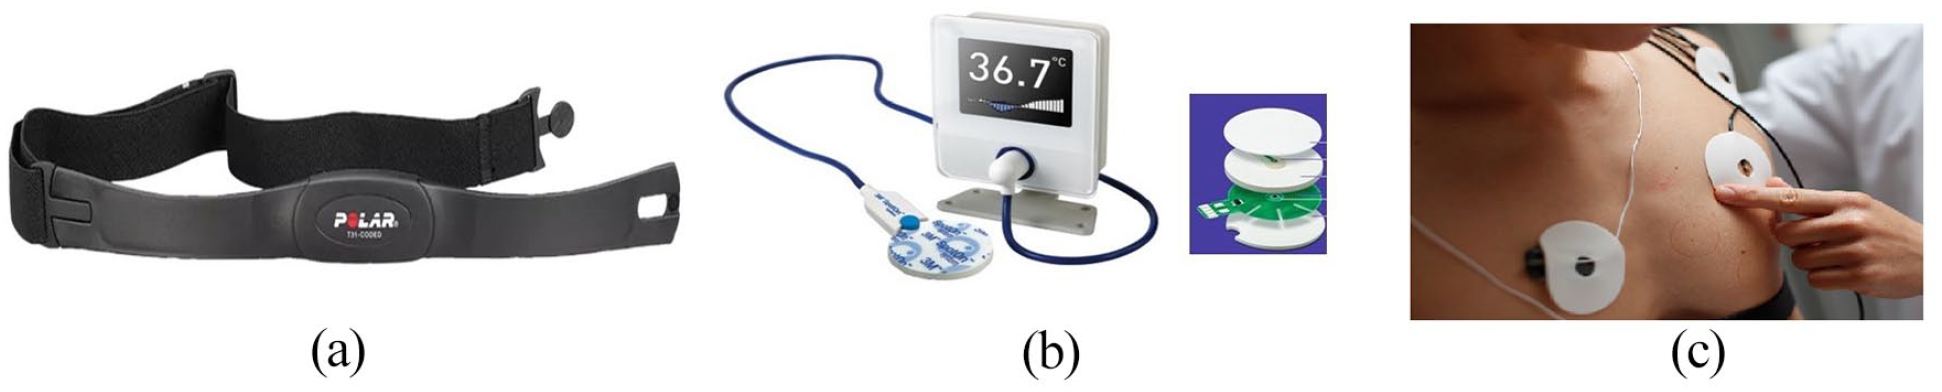
(a) Polar T61-CODED pulse belt (©Polar), (b) SpotON sensor (©3M Medica), and (c) temperature and humidity sensor (©MSR Electronics GmbH).
Details regarding the sensor position during wear trials and weighting factor for overall skin temperature and humidity (ISO 9886).

In order to measure the temperature and humidity of the microclimate, the sensors were pointed towards the microclimate at a distance of 3 mm from the skin. The measurement of the mean skin temperature, the microclimate temperature, and the microclimate humidity were made according to ISO 9886. 34 This standard explains the method for measuring the physiological response (body core temperature, skin temperatures, heart rate, and body-mass loss) of the subjects exposed to a thermal environment. For example, this standard proposed the three weighting scheme, with 4, 8, or 14 measuring points, which gives more comparable results of mean skin temperature. In the present study, the mean skin temperature was measured using the 8 points weighing scheme (Table 5). The body core temperature was measured using SpotOn system (3M Medica, Neuss, Germany, can be seen in Figure 4). The SpotOn sensor connected to the control unit was placed on the forehead and a digital display shows the body core temperature. Moreover, all the test persons were weighed before and after the test to calculate the total amount of sweating that was produced during the test. The amount of sweat entrapped within clothing was derived by the difference in weight of clothing before and after the trial. The clothing was washed and conditioned for 24 h for every new trial.
Thermal simulation
The thermal simulation of the human body-clothing-environment system was carried out in software Theseus-FE. 35 Figure 5 shows the sequence of the main steps followed for executing the thermal simulation as already published in Awais et al.25–27

Step-by-step procedure of thermal simulation.
The 3D virtual models of clothing system and test persons that we achieved from the 3D fit simulation, were further processed and prepared as NASTRAN format for the software Theseus-FE. The 3D virtual models of test persons represent only the anatomical shape of test persons. However, it is very important for the thermal simulation that they can react like an actual human body and induce all the thermophysiological responses for any change in parameters that are responsible for thermal regulations, for example, clothing properties, environmental conditions, and activity level. Theseus FE gives the opportunity to use the manikin Fiala-FE that able to perform all the thermophysiological regulations; the controlling active system (vasomotion, shivering, and sweating) and passive system (convection, conduction, radiation, sweat evaporation, and breathing) of the human body. As a further step, Fiala-FE model was connected with each scanning model of TP. Consequently, the achieved models have the same thermophysiological properties. However, in reality, all the test persons have different thermophysiological properties because they are of different weights, heights, etc. In order to make these models personalized, the weight factor of each test person to the Fiala-FE was calculated with the help of equation (1) and then multiplied with the length of each body part. The new lengths of the body parts were updated in characteristics of each body part of Fiala-FE. Figure 6 shows the NASTAN models and thermophysiological model of each test person.

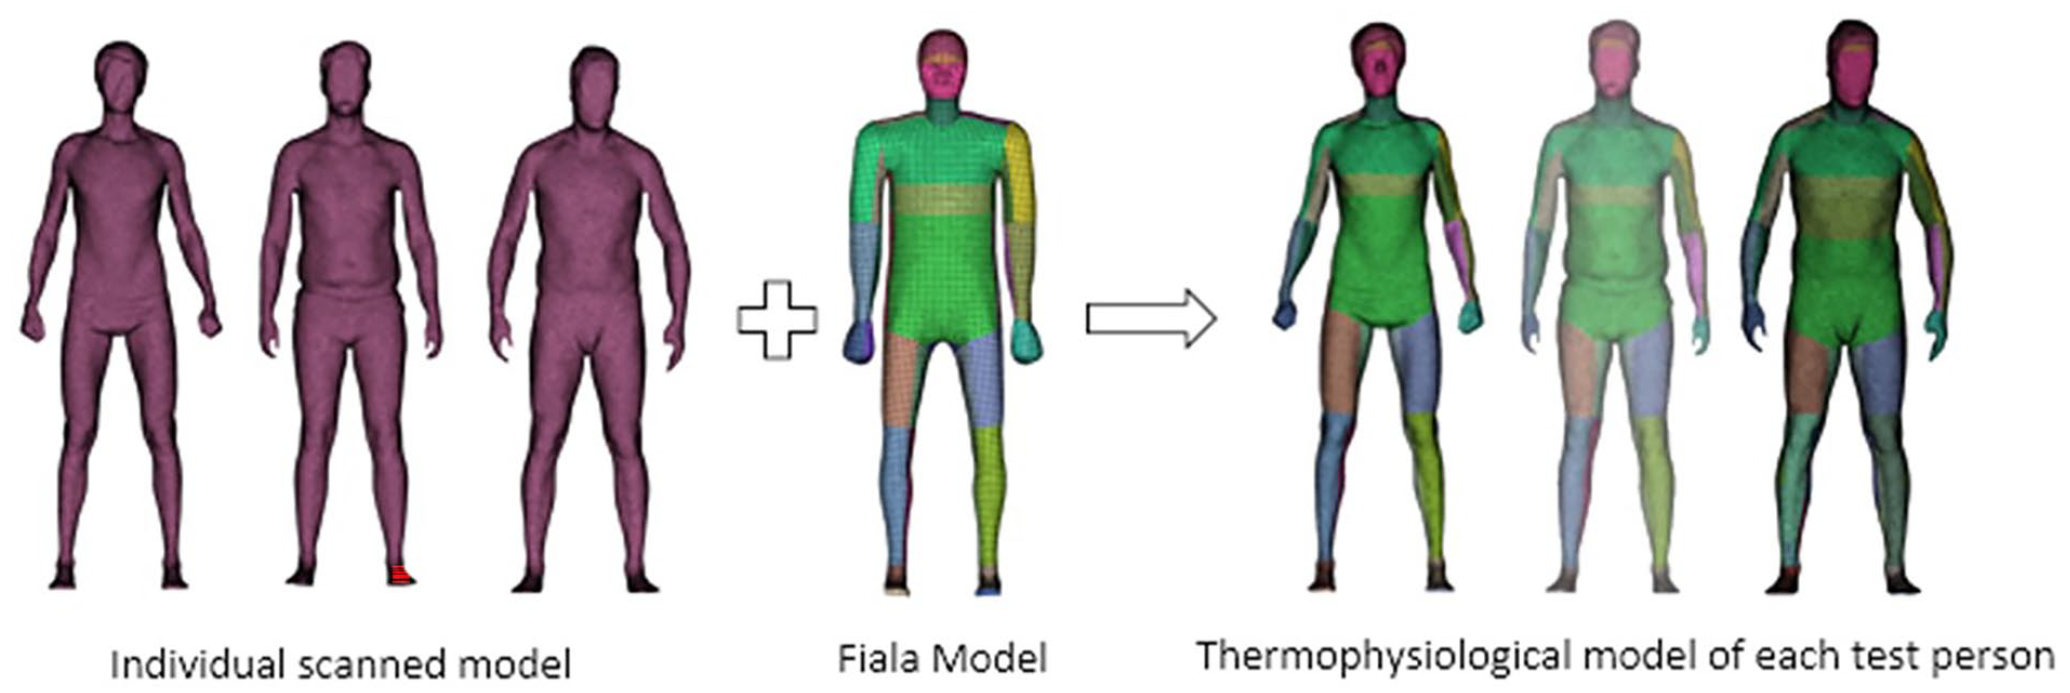
Development of thermophysiological models of the test persons.
The thickness of the air gap has a distinct influence on human thermoregulation and is not uniform over the body. Therefore, there is a need to analyze the air-gaps thickness. The thickness analysis was carried out with the help of software Geomagic Qualified, 29 which allows 3D comparison of complex geometries. For this purpose, polygon models of clothing from results of the 3D fit simulation (Figure 3) and test person (Figure 1) were imported into the software. After the precise positioning of geometries on each other, the 3D distance analysis was done as shown in Figure 7. It can be observed that the air gap thickness is not uniform but instead varies with reference to the shape of the body and draping properties of the clothing. As long-sleeve shirt is a relatively tighter fit as compare to the trousers, therefore upper body parts have air gaps of a thickness of 10 mm or lesser. Whereas, lower body parts have a maximum microclimate thickness of 65 mm at some points.

Air gap thickness analysis of TP-1, TP-2, and TP-3.
On the basis of thickness analysis, air gaps were divided into several air zones depending on their thickness and location on the body. Figure 8 shows the division of the surfaces of clothing and the test persons according to the air zones. Moreover, these air zones had different volumes and thicknesses and were associated with different surfaces of the clothing and body part (each body part has different thermophysiological properties). Therefore, heat transfer due to convection did not occur consistently across the microclimate. Furthermore, it was assumed that these air zones are vertical cavities in which air or fluid ascends along the hot surface and descends along the cold surface.
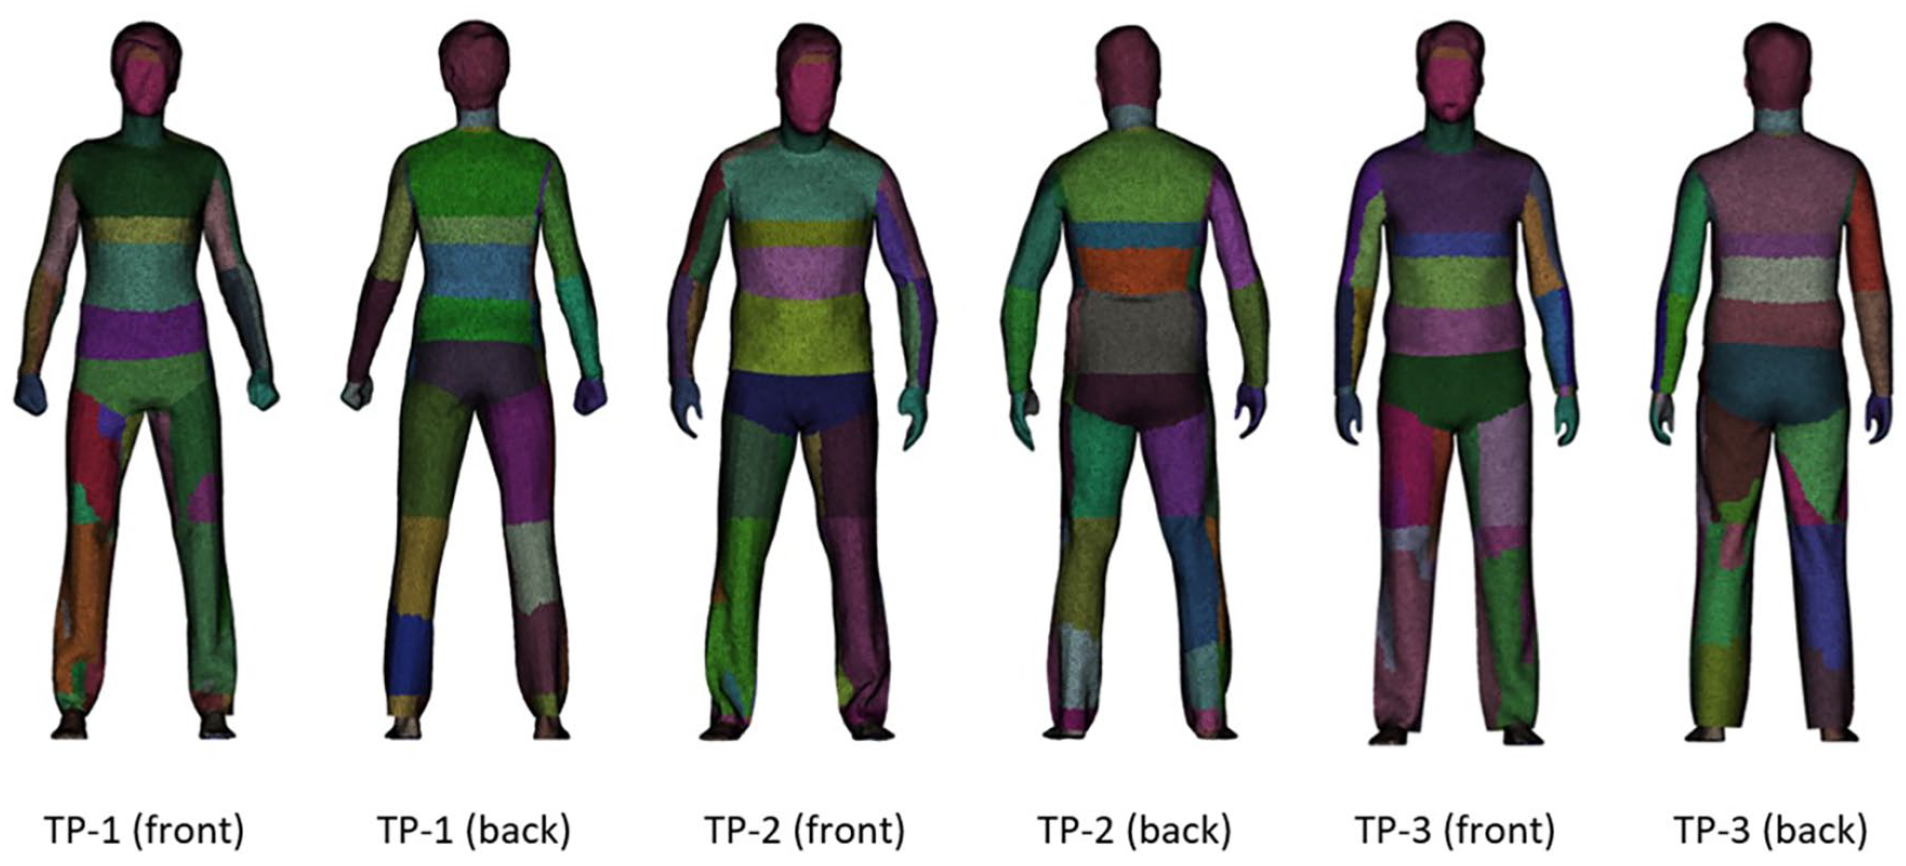
Division of the surfaces of clothing and the test persons according to the air zones.
The heat transfer co-efficient in this scenario can be calculated using the following correlation:

where k is the thermal conductivity of air, L is the thickness of the air gap, and NuL is the Nusselt number, which is a dimensionless quantity and function of the Prandtl and Rayleigh numbers.
Before running the simulation, the following steps were followed to define the parameters and boundary conditions:
The properties of textile materials such as thickness, thermal conductivity, specific heat, and mass per unit area were defined.
The wear trials of the CS lasted for 125 min and every TP had to perform the already defined activities during the wear trial (Table 4). As already discussed, heat production in the human body is due to the metabolism and the metabolic rate, depending upon the body weight and activity level. It means that every test person has a different metabolic rate even when they are performing the same activity, which was calculated with the following equation 36 :

where M is the metabolic rate (W), W is body weight (kg), Lc is carried load (kg), V is walking speed (m s−1), ɳ is nature of the terrain (−), and Gw is walking grade (%).
The metabolic rates from equation (3) were calculated in watts, which were converted into MET, in order to use the values in the Theseus-FE (1 MET = 104 W). Table 6 shows the calculated metabolic rates of the test persons at different activities, which were defined for the specific time period and activity phase.
The wear trials were conducted in a climate chamber of dimensions 320 cm × 230 cm × 220 cm in a controlled environment. Therefore, an environment was on the outer surfaces of clothing and the body parts not covered with the clothing, which has the same characteristics of the climatic chamber; volume 16.19 m3, airspeed 0.3 m s−1, relative humidity 50%, and temperature 23°C.
In order to realize the convective heat transfer between air gaps (air zones) and body surface or clothing inner surface, the convective boundary conditions using heat transfer co-efficient were defined. Whereas, the boundary conditions for the convective heat transfer between environment and outer surface of clothing or unclothed body parts were defined as a function of air velocity. Heat transfer due to radiation was realized by defining the view factor cavity.
Metabolic rates of the test persons during different phases of wear trials.

The software does not consider vapor transportation across the fabric. Therefore, the relative humidity from wear trials was assigned in the air zones for each step of time; that realizes the cooling effect on the skin due to evaporation.
Results and discussion
Figure 9(a)–(c) illustrate the comparison between wear trial and simulation results of the core body and mean skin temperatures. The core body temperature of each TP during simulation is reproduced very well with small differences in comparison with wear trial results. On the other hand, a significant difference of 1°C–2°C can be observed in the mean skin temperatures of wear trial and simulation. However, mean skin temperatures in both cases have almost the same trend except for the ending phase of sitting. Furthermore, it is also noticeable that the mean skin and body core temperatures of all the test persons during the simulation are identical. The reason for this could be the Fiala Model, which is same in all the cases. Although during the coupling of the Fiala Model with a virtual model of test person, they were personalized by multiplying the weight factor of each test person with the segmental length of Fiala model. However, it does not show any significant differences in the results of simulations.

Mean skin and body core temperatures of the test persons: (a) test person 1, (b) test person 2, and (c) test person 3 during the wear trial and the simulation.
Since the outside temperature is lower than the body temperature, therefore mean skin and body core temperature begin to fall with the start of simulation. It is due to heat dissipation from the body to the environment. However, in the second phase, the metabolic rate increases caused by activity (walking with 4 km h−1). Because of an increase in metabolic rate, both temperatures stop to further fall and then start to rise from the middle of second phase. Although the third phase is the resting phase (sitting, 0 km h−1), a little rise in both temperatures can still be noticed (Figure 9). The body heat produced during the activity in second phase is still enough to hold or cause a little rise in both temperatures. As soon as the fourth phase (walking with 6 km h−1) sets in, a steady rise in core body temperature can be noticed throughout the phase, which is caused by the higher metabolic rate. However, mean skin temperature starts to increase in the beginning and then decreases after some time. This decrease in temperature continues until the first half of the fifth phase ends (sitting, 0 km h−1). This is caused by sweating and resultant heat released through evaporation on the skin. This is an effective phenomenon for the heat dissipation, that otherwise sets in if vasodilation becomes insufficient to maintain the core temperature.
The visual comparative results of changes in temperature of clothing surface, local skin, and microclimate for all the test persons during thermal simulations are presented in Figures 10–12. The external environment was kept constant at a temperature of 23°C and 50% relative humidity so that no significant differences in clothing surface temperature can be noticed during the simulation (Figure 10). However, the variations in temperature of clothing surface can be seen between different TP at the same time step. It is due to the different air gap thickness and volume for each TP.

Clothing surface temperature during simulation at some specific time steps.
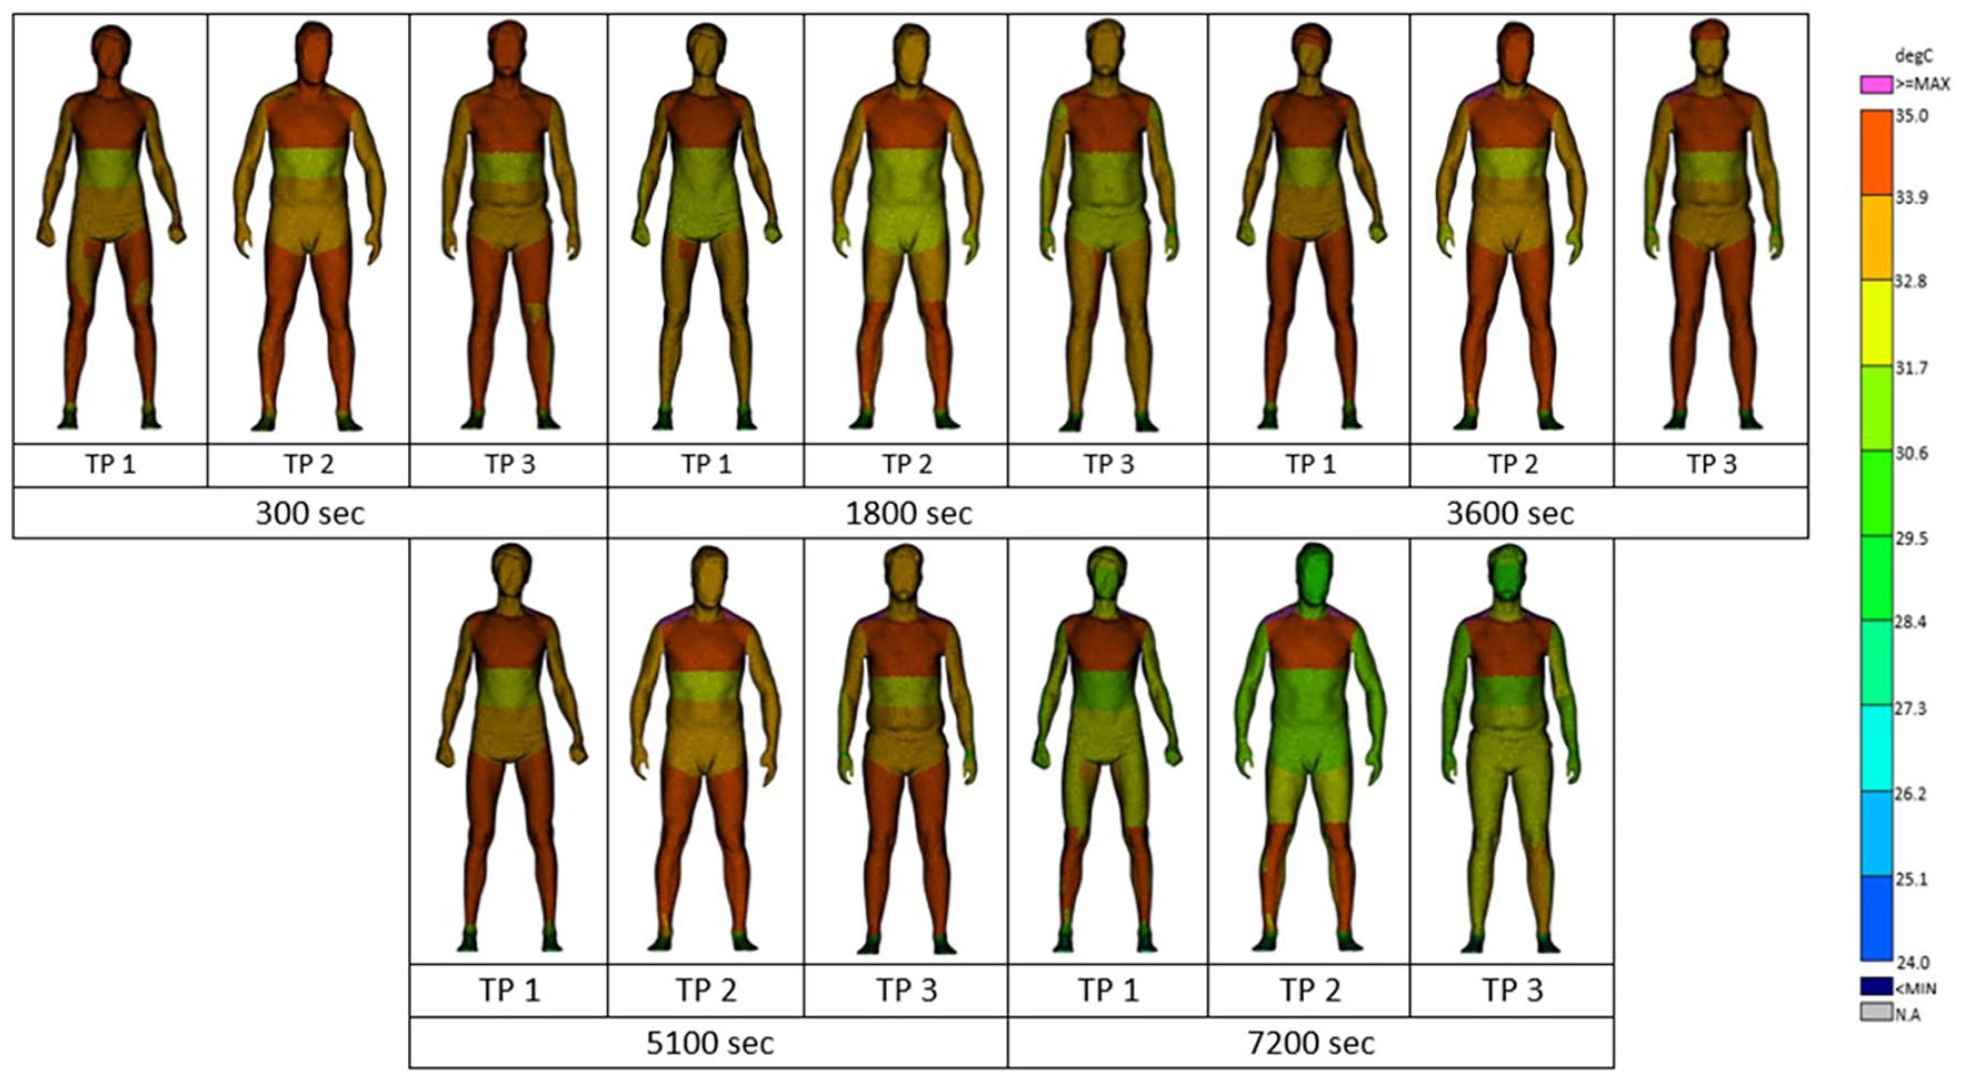
Local skin temperature of test persons during simulation at some specific time steps.
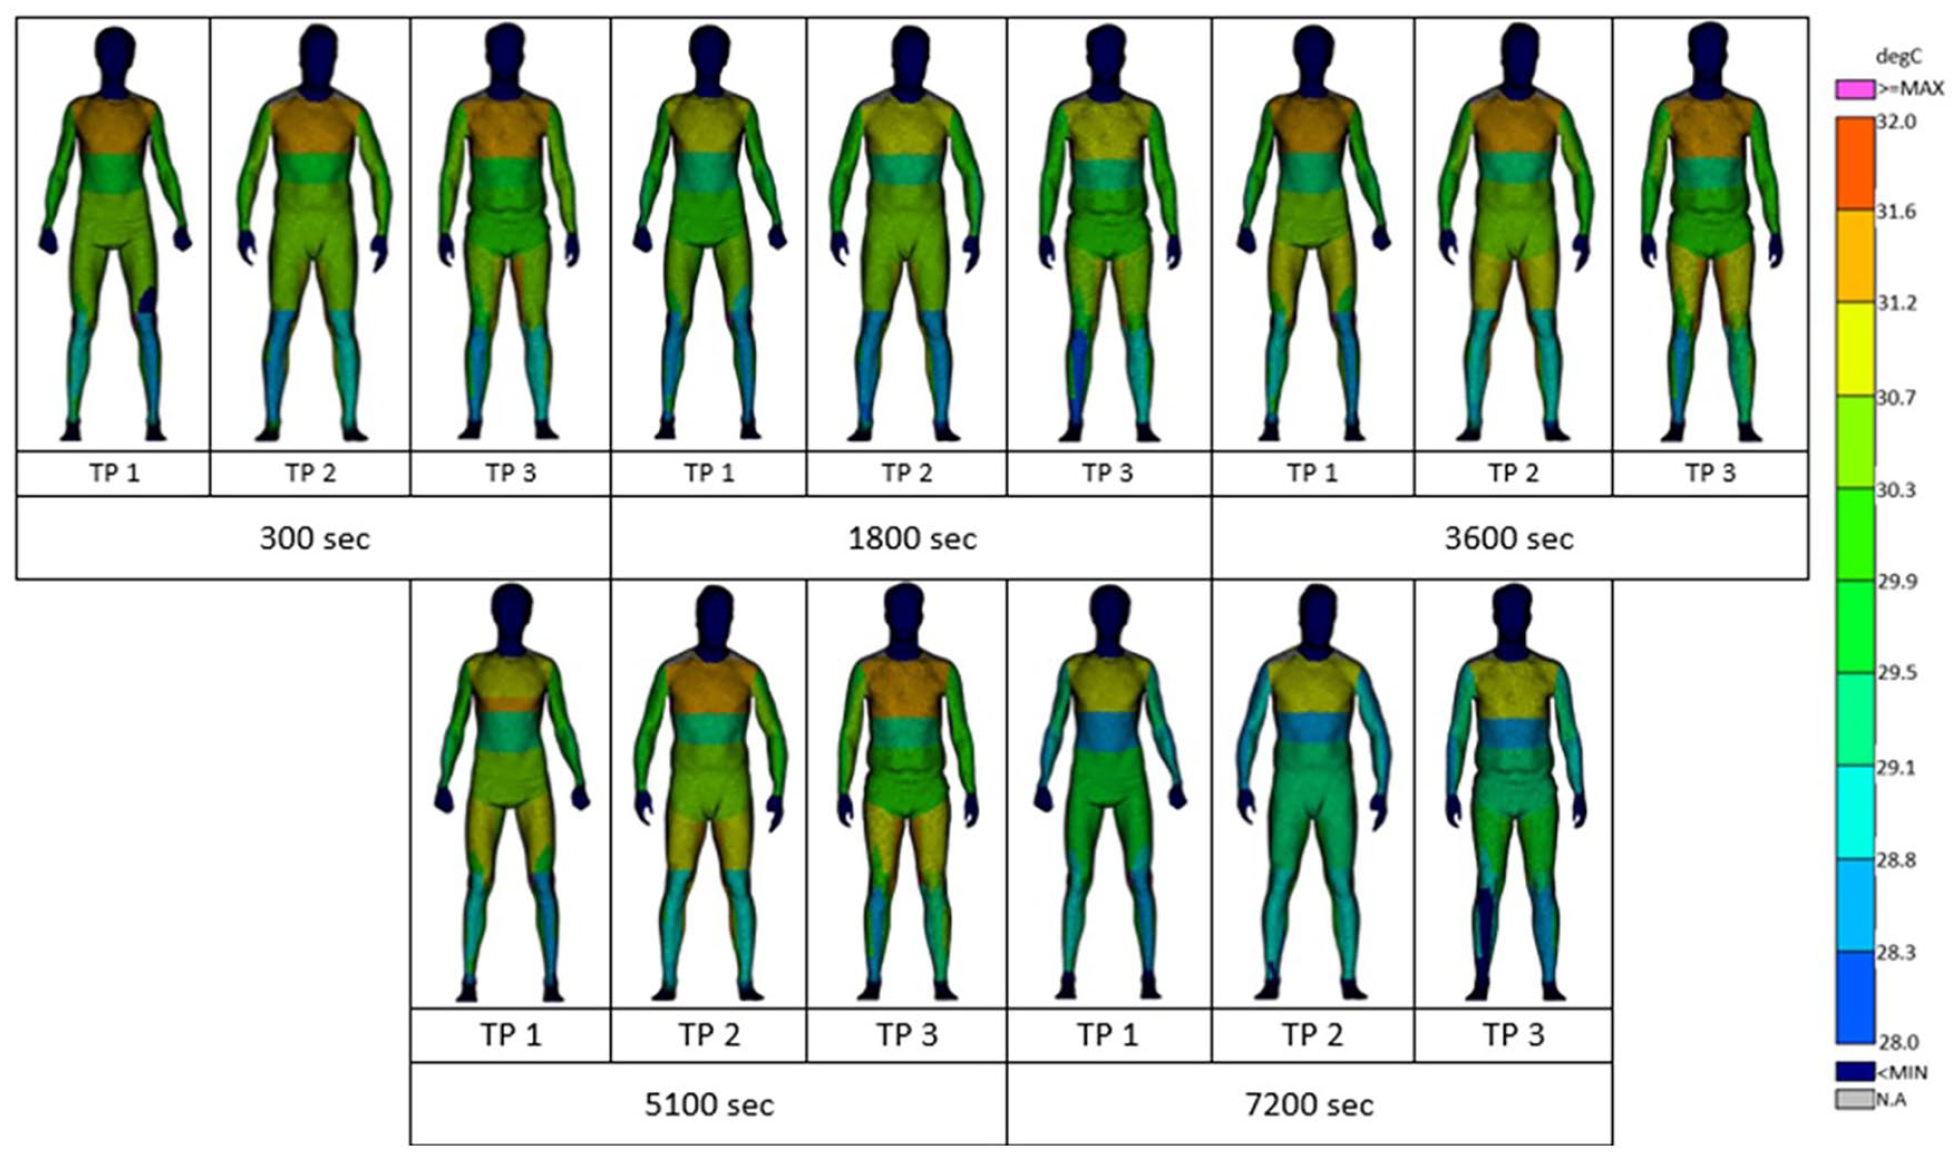
Microclimate temperature during simulation at some specific time steps.
The significant local skin temperature variations between TP can only be seen in places with thicker air gaps. For example, Figure 11 shows that the skin temperature of the chest has almost the same value (with the variation up to 0.5°C) compared to the skin temperature of the calf (lower leg) with a fluctuation up to 2°C–3°C. Furthermore, the heat loss increases from the body with an increase of heterogeneous air gap, therefore the folds that produce at the lower part of the trousers cause more heat loss and also more variation in local skin and microclimate temperatures (Figures 11 and 12) compared to other body places. The same behavior can be observed by the microclimate temperatures in Figure 12 that more folds and thicker air zones cause many variations in microclimate temperatures of the TP.
Figure 13 shows the temperatures of the skin and microclimate at five different locations (chest left, shoulder blade right, upper arm right, thigh front right, and calf left) of the test persons during wear trials and simulations. It has been already discussed that the software considers the fabric as a plastic sheet, which does not allow water vapor to pass through.

Comparison of local skin and microclimate temperatures of test persons during wear trials and simulations at five different locations on the body. I think every thing is mentioned in the figures, however, following text could be add at the end of figure description (although it could be the repetition): (a) skin temperature of chest left, (b) microclimate temperature at chest left, (c) skin temperature of shoulder blade right, (d) microclimate temperature at shoulder blade right, (e) skin temperature of upper arm right, (f) microclimate temperature at chest left, (g) skin temperature of front thigh right, (h) microclimate temperature at front thigh right, (i) skin temperature of calf left, (j) microclimate temperature of calf left.
Figure 13 shows a complex comparison between the simulations and wear trials results, which can be explained as follows:
The results of the wear trials show significant variations with the change of phases of activities, and it can be observed that during the sitting phase the temperature of the skin as well as of the microclimate increases. It is because of the convective heat losses, which happened due to the movement of the body parts. Furthermore, each test person shows different skin and microclimate temperatures. This is because of the different characteristics (weight, height, metabolic rate, etc.) of the test person.
In contrast to the wear trial, there are no significant discrepancies within the simulation results of one test person to another test person. The reason for this is that the Fiala Model has almost the same thermophysiological response for each test person. However, different metabolic rates during the simulation and different segmental lengths did not make significant differences in the thermophysiological output of each test person.
It can be observed that during the wear trial, the microclimate temperatures that belong to the thinner air zone and lesser moving body parts have smooth curves and show very good comparison with simulation results (as shown in Figure 13(b), (d) and (f)). However, thicker microclimates and the microclimates that belong to the moving body parts show an uneven temperature curve and poor comparison with the simulation results (as shown in Figure 13(h) and (j)). It is due to the movement of body parts that produce a pumping phenomenon in the air gap between clothing and the body. This pumping phenomenon exchanges the air of the microclimate with the outer environment and therefore a significant variation can be seen in the temperature of the microclimate. However, the moving of the body parts and pumping phenomenon cannot be realized during the simulation and therefore smooth temperature curves are achieved by the simulation.
Microclimate temperature has a great influence on skin temperature, which can also be noticed in Figure 13. The skin temperature almost has a similar pattern of variation in the microclimate temperature curve. For example, significant microclimate temperature variations in Figure 13(h) and (j) influence the corresponding skin temperatures in Figure 13(g) and (i) respectively, which exhibit a similar pattern of temperature curves. Therefore, the pumping phenomenon in air gaps between clothing and body causes not only microclimate temperature reduction but also decreases the corresponding skin temperature.
Two falls can be seen in the temperature curves of the simulation. The first fall is just after the beginning of the simulation to the middle of the second phase (walking at 4 km h−1), which is because of the sudden influence of the lower environmental temperature (23°C). The second fall in the curve starts from the middle of the fourth phase (walking with 6 km h−1), which is because of the active system of the Fiala model. In order to maintain the core body temperature at 37°C, this active system activates sweating and vasodilation to dissipate the heat from the skin by evaporation and widening the blood vessels.
Conclusion
This research work presents the thermophysiological simulation of three different test persons and a particular clothing system and validation of simulation results through wear trials in a climatic chamber. On comparing the simulations and wear trial results, good validation of the core body and mean skin temperatures were recorded. However, some discrepancies were seen when comparing the results of local skin and microclimate temperatures. The reasons for these discrepancies are due to the following points:
The Fiala model is one of the most reliable and validated human models applied in much research work. However, it cannot be completely personalized according to the selected test person, which causes deviations between the simulation and the experimental results. There is a need for further studies to personalize the model according to the test person.
During the wear trial, the test person has to perform different activities by walking on a treadmill, which causes forced convection on the body moving parts and also a pumping effect in the microclimate between clothing and body. This phenomenon cannot be realized in Theseus-FE, however, they have a great influence on heat loss from the body.
In summary, a simulation process chain for outdoor clothing was validated with some discrepancies that comprise 3D scanning, clothing fit considering the deformation properties of fabrics, 3D analysis of air gaps between clothing and skin, and thermophysiological analysis of the human body taking into account different metabolic rates. This research work discussed the challenges and potentials of the clothing design phase and presented a virtual wear trial to predict thermal wear comfort that can help to avoid the time-consuming laborious methods. Although there are some deviations between the simulation and wear trial results that required further research for improvement, this approach offers a holistic solution for product development in sportswear, workwear, outdoor, and protective clothing sectors for the first time.
Footnotes
Declaration of conflicting interests
The author(s) declared no potential conflicts of interest with respect to the research, authorship, and/or publication of this article.
Funding
The author(s) disclosed receipt of the following financial support for the research, authorship, and/or publication of this article: This work was supported by the institution AiF. The IGF research project 19472 BG of the Forschungsvereinigung Forschungskuratorium Textil e. V. is funded through the AiF within the program for supporting the “Industrielle Gemeinschaftsforschung (IGF)” from funds of the Federal Ministry for Economic Affairs and Energy (BMWi) by a resolution of the German Bundestag.