
Abstract
Feature extraction is a key step in animal fiber microscopic images recognition that plays an important role in the wool industry and textile industry. To improve the accuracy of wool and cashmere microscopic images classification, a hybrid model based on Convolutional Neural Network (CNN) and Random Forest (RF) is proposed for automatic feature extraction and classification of animal fiber microscopic images. First, use CNN to learn the representative high-level features from animal fiber images, then add dropout layers to avoid over-fitting. And the backward propagation algorithm are used to optimize the CNN structure. Random forest, which is robust and has strong generalization ability, is introduced for the classification of animal fiber microscopic images to obtain the final results. The study shows that, the proposed method has better generalization performance and higher classification accuracy than other classification methods.
Keywords
Introduction
In the textile industry and garment manufacturing field, wool and cashmere have always been very important textile materials. 1 Cashmere is always the best choice for producing high-end clothes, as the textile made from this slender and soft yarn is light, soft, smooth, and warm. Due to the low output and high price of cashmere, many products made of cashmere and wool are sold in the market as pure cashmere products, which has seriously affected the interests of consumers. 2 Therefore, it is extremely important for academic field and production to classify a series of fibers with fineness close to cashmere, such as superfine wool and fine wool. 3
In recent years, many scholars have proposed to use fiber image processing technology combined with machine learning methods to identify fibers. The steps of cashmere and wool recognition are mainly divided into: image collection and processing, feature extraction, and pattern recognition. The key to this method is the extraction of features in the fiber image and the classification algorithm used. For fiber feature extraction, morphological features and texture features are mainly used.
In the context of classification, the morphological features used as Bergen et al., 4 Robson et al., 5 Wortmann et al.,6–11 Zhou et al., 12 Yang et al., 13 Peng et al., 14 Shi et al.,15–17 Ji et al., 18 Xie et al., 19 Xing et al., 20 microscopic equipment is used to obtain images, and then image processing technology is used to extract characteristic indexes that distinguish cashmere and wool. For example, fiber diameter, scale height, circumference, area, relative area of scale, relative circumference of scale, ratio of diameter to height, 2 square factors inside and outside scale. After constructing the feature data set, use machine learning algorithm to identify. But this method can only achieve better results for the fiber classification system, it seems to be more troublesome and not efficient enough for fiber feature extraction.
The texture features used are in the context of classification. Liu et al. 21 based on Local Binary Pattern (LBP) and Histogram of Oriented Gradient (HOG) image features, used support vector machine algorithm to achieve recognition. Yuan et al. 22 used an improved (Tamura) texture feature and neural network to identify cashmere and wool fibers, with an accuracy rate close to 81.17%. Li et al. 23 used image preprocessing to convert optical microscopy images into spectrograms, and extracted six comparison features for correlation analysis based on the difference in fiber surface texture structure. Zhong et al. 24 proposed that the numerical characteristics of the projection curve can be used to identify cashmere wool images, with a recognition rate of 90.8%. Lu et al. 2 generated visual words from the local fiber features, and then classified images according to the visual words, so as to achieve the purpose of identifying cashmere and wool fibers. Jiao et al. 25 used gray-level co-occurrence matrix to extract texture information to identify cashmere wool. Lu Kai et al. 26 used support vector machines to classify the extracted Speeded Up Robust Features (SURF) feature data, so as to realize the identification of animal fibers. Xing et al. 1 proposed to preprocess the fiber image through a matched filter, then extract the HOG features of the fiber, and use support vector machines for classification.
Although the above methods have achieved brilliant results, however, most of these methods adopt the given variables and lack the ability to extract the representative high-level features.
Recently, deep learning, as an advanced technology, has been able to overcome the above shortcomings. Therefore, deep learning method has been introduced into animal fiber classification. In this respect, Wang and Jin 27 has used a convolutional neural network to classify fibers, obtaining 92.1% recognition rate. Although CNN has achieved better results, its shortcoming still exists in wool and cashmere classification owing to the disadvantage of the softmax classifier. On the one hand, the Softmax model is a complex function with independent variables, and its operation is similar to the black box model, so the regression coefficients of its independent variables are not easily explained; on the other hand, the Softmax classifier model is more complex, easy to fall into overfitting. Therefore choosing a suitable classifier is very important.
In this article, to solve the problem of limited testing samples and boost the performance, a classification method combining deep learning technology and random forest is proposed to improve the classification accuracy of small data sets and make the classification model more suitable.
Research methods
Sample collection and image acquisition
Two kinds of different cashmere and sheep wool fibers collected from Northern Shaanxi are used for the experiment. When making the fiber observation samples, the same kind of fiber are cut into many pieces. Then place a specimen into the scanning electron microscope (SEM) under a large multiple (10 times), adjust the upper left corner of the sample stage to the display. On the monitor, set the magnification to 1000 times and adjust it to the proper focal length. Along Scan the sample stage horizontally or vertically. In this article, each image contained only one fiber (cashmere or sheep wool) and the majority of the fiber trunk was clearly captured. The fiber micro-image acquisition system is shown in Figure 1.

(a) Microscopic image acquisition system, (b) wool fiber magnified image, and (c) cashmere fiber magnified image.
Overview of the cashmere and wool fiber classification system
Figure 2 shows the overview of the proposed method. The animal fiber classification system is divided into three main stages as follows.

Flow chart of animal fiber classification for the proposed combination model.
Step1: Construction of animal fiber image data set
To make cashmere and wool identification more practical and scientific, the fiber images are captured by scanning electron microscope (SEM). The collecting process may lead to the low contrast and impurities, so the original fiber images needed to be processed by the image enhancement and de-noise to obtain the available fiber images with a better quality. Get region of interest can reduce the influence of the background region on the fiber texture. The wool and cashmere images in the training sample data-sets are respectively used to construct 2000 feature sets that are input to the convolutional neural network.
Step2: Training and generation of convolutional neural network model
Initialize network model parameters include convolutional layer size, pooling size, learning rate, number of batches, and maximum number of iterations. Input the training samples into the convolutional neural network and train the model to update the weights and biases. When the loss value is <0.05, select the appropriate convolutional layer for the feature map and save the model.
Step3: Test the proposed random forest of convolutional neural network model
In the test stage, the same pre-trained deep convolutional neural networks are used to extract the representative high-level features from the test data-sets, then features that correspond to selected dimensions in the training stage are selected as the represented ones, which are then classified by the optimized random forests.
Random forest with CNN architecture for animal fiber ensemble classification
The proposed CNN-RF model is designed by integrating CNN and RF classifier. As shown in Figure 3, CNN is used to extract the representative high-level features (shown on the left side) and then these features are put into a random forest classifier to predict the final animal fiber image classes (shown on the right side). 28 Convolutional neural random forest contains four types of layers: convolutional layer, pooling layer, fully connected layer, and RF classification layer. CNN is multi-layer neural network based on supervised learning. At present, the CNN methods have been widely used in object recognition and image classifications. 29 RF is ensemble learning technique that comprises a large set of independently generated decision tree. 30 The design of each part of the CNN-RF structure is introduced below.

An architecture of the proposed convolutional neural random forest model.
Convolutional neural network feature extractor
In the CNN, the successive alternating convolutional and pooling layers are designed to extract representative high-level features from animal image data-sets. 31 These features can explore more sensitive information of animal fiber images, which is vital for classifying animal fibers. All neurons in the feature maps share same parameters. The number of trainable parameters of networks needs to be reduced and relevant layers also be simplified during the process of generating feature maps. A ReLU activation function is applied on the convolved results for further non linearization, which greatly improved the expressions ability of convolutional neural network. 32 It is assumed that there are K numbers of filters and the input M in the convolutional layer. Generally, the output feature maps of the first layer are calculated as follows.

Where x and f are the convolutional operations and activation function, respectively.
Coordination of convolutional neural network and random forest classification layer
Random forest is an ensemble learning technique that comprises a large set of independently generated decision trees. RF can make decisions according to the input data to overcome the shortage of single classifier and show superior performance with weak classification data. Each decision tree classifier consists of decision nodes (D) (in red color) and prediction nodes (L) (in green color). 33 Each decision node contains a test that splits the data space to a large extent. The prediction node of each tree in the random forest classifier are labeled by the posterior distribution over the image classes. The original data passes through each convolutional layer of the CNN model, and exact information will be loss so that the essence of the original information has been changed. Therefore, the random forest cannot be directly placed in the CNN structure. 34 The fully connected layer provides the output in the form of the feature vector, and it utilizes the all prediction average, which cancels the biases. The most reasonable way is to put the random forest in the fully connected layer. The RF classifier layer in the combination model can be defined as:

Where sign(•) is sigmoid function, which maps abnormal values to 0 and normal values to 1. The classifier mainly requires two defined parameters to generate a classification model: the optimal decision trees number and the split feature parameters used in each node, which are obtained by the grid search algorithm.
Technique for training convolutional neural network random forests model
Table 1 shows the detailed parameters of the proposed convolutional neural random forest structure, which include the numbers of filters in each layer, filter size, and stride. Convolutional layers with a filter size of 3 × 3 (stride 2) are applied to extract the representative high-level features from animal fiber image data-sets. Moreover, this paper uses max pooling layers with a k size of 3 × 3 (stride 2) and also adopts a binary cross entropy as the loss function. According to our field survey, training samples are of high importance in training CNNs, rotations, and mirror flips were employed to times the training data, while testing samples remained unchanged.
Parameters of convolutional neural random forests.

The whole training process is divided into two parts: forward propagation and backward propagation. Firstly, the data in the input layer are transferred to convolutional layer, pooling layers, and a fully connected layer. In order to reduce the risk of overfitting and the cost of weight update at each iteration, a dropout layer is added to the fully connected layer, the deletion rate is 0.4, and the implicit neuron becomes very sparse, thereby reducing the correlation of weights. 35 The training sample obtains the prediction value through forward propagation algorithm, and then iterates through the back propagation algorithm to minimize the loss value of softmax.
Given a sample set

Where w represents the connection weight between layers of the network and b is the corresponding bias. The gradient descent algorithm is updated, the corresponding expressions are as follows.


Finally, the grid search algorithm is used to optimize the RF classifier parameters, such as the number of decision tree and the maximum split features.
Experiment
Performance metrics
In this article, the classification of cashmere and wool images is a binary classification task.
We use a confusion matrix to evaluate the performance of the method. The Table 2 shows the confusion matrix used for the classification of cashmere and wool images. Among them, TP, FN, FP, and TN represent the correct classification as cashmere, the wrong classification as wool, the wrong classification as cashmere, and the correct classification as wool. Although these four indicators show all the information about the performance of the classifier, more meaningful indicators can be extracted from them to illustrate the performance of the proposed method. For example, TPR = TP/TP + FN, FPR = FP/FP + TN, Precision = TP/TP + FN, Recall rate = TP/(TP/FN), f1 score = 2 (precision × recall)/(precision + recall). Among them, the true positive rate (TPR) is the probability that the classification method recognizes cashmere as cashmere, the false positive rate (FPR) is the probability that the classification method recognizes wool as cashmere, the false negative rate is the probability that cashmere is recognized as wool, and the true negative rate is the probability that wool is recognized as wool. Precision refers to the probability of correctly classified fibers in the total fiber, recall rate refers to the ratio of the number of correctly classified fibers to the number of actual fibers, and the F1 score is the harmonic mean of precision and recall rate.
Confusion matrix applied in image classification of cashmere and wool.

In addition, the ROC curve is a curve drawn based on a series of different binary classification methods (cut-off value or decision threshold) with the true positive rate on the ordinate and the false positive rate on the abscissa. The ROC curve can easily find out the ability to classify fibers at any limit value. The area under the ROC curve (AUC) of each model can also be calculated separately for comparison. The classification performance with the largest AUC area is better.
Experiment based on convolutional neural network random forests model
In order to seriously evaluate the performance of the proposed animal fiber classification system, we implemented it in the Python 3.7 programming package. The experiment is to use 2000 image data sets, using random translation, random angle rotation, random size scaling, and random cropping. The image is expanded to 6000 images, and then the training image feature data set is obtained. Each experiment randomly selects 2000 from the sample size as the training feature data set. First, input the image feature data set into the convolutional neural network model to train the model. With the batch size of 200, the training process stops after 500 epochs. As shown in the Figure 4, it can be seen that the training loss is steadily reduced, the training accuracy is steadily increased. This means that the proposed model has learned the training data set. Then the high-level representation features extracted by the trained convolutional neural network are input into the random forest for training and testing.

The curve of training loss and training accuracy.
In order to construct a random forest in the proposed hybrid model, the optimal parameters are determined by applying a grid search algorithm based on the training data set. The breadth search range of each parameter is given as follows: Number of trees = [50,60,. . .100] and maximum depth = [10,20,. . .50]. 6 × 5 = 30 are tried with different combinations. When the number of decision trees is 100 and the maximum depth is 35, the best results can be obtained, and then these parameters are used to train the combination model.
The classification results of cashmere and wool proposed in this paper are as follows. The numbers of TPS and FNS, FPS and TNS are 1032, 25, 26, and 600, respectively. Therefore, the accuracy, recall rate, and F1 score can be calculated. The recognition ability of cashmere and wool is shown in Table 3. This means that the proposed method can correctly classify the two categories.
Classification score summary for CNN-RF.

Experimental results and comparative analysis
The classification model is built using Tensor Flow, an end to-end open-source platform, to construct an optimized random forest, and perform a binary classification of animal fibers based on the representative high-level features extracted by the trained convolutional neural network model. This experimental results show that:
(1) We depicted the ROC charts for the three types of experimental settings, firstly setting a simple random forest (RF) model and secondly a simple convolutional neural network (CNN) model while thirdly developing a CNN-RF method. In the ROC plot, the important parameter is the area under the curve (AUC), that is higher AUC will result in better model. Figure 5(a) shows the ROC plot of simple random forest model and Figure 5(b) displays the ROC plot of convolutional neural network model while the ROC plot of the proposed CNNRF is seen in Figure 5(c). The AUC for simple random forest model is 0.88783 and the AUC for convolutional neural network model is 0.81513 while the AUC for the CNNRF is 0.95971. Thus, the proposed CNNRF is an improved version.
(2) Especially in small samples, RF is better than CNN. On the one hand, the Softmax classifier method directly uses the representative high-level features of the last fully connected layer for classification. Because the difference of animal fiber characteristics, so effective selection of depth features can improve the classification performance. On the other hand, owing to many impurities in images, if the whole image was input to the classifier, it would affect the performance of the feature extractor. Deep learning algorithms have high requirements for training samples, but if there are enough training samples, deep learning algorithms will greatly improve the recognition accuracy.
(3) The AUC value of the CNN-RF methods is set at 0.95971 to achieve a better result than the original Convolutional neural network methods. This indicates that the proposed methods is able to classify animal fiber, as shown in Figure 5(c). The representative high-level features extracted by the convolutional neural network can better represent the characteristics of animal fiber images, and using random forest to replace the single classifier makes the performance of the model more stable.
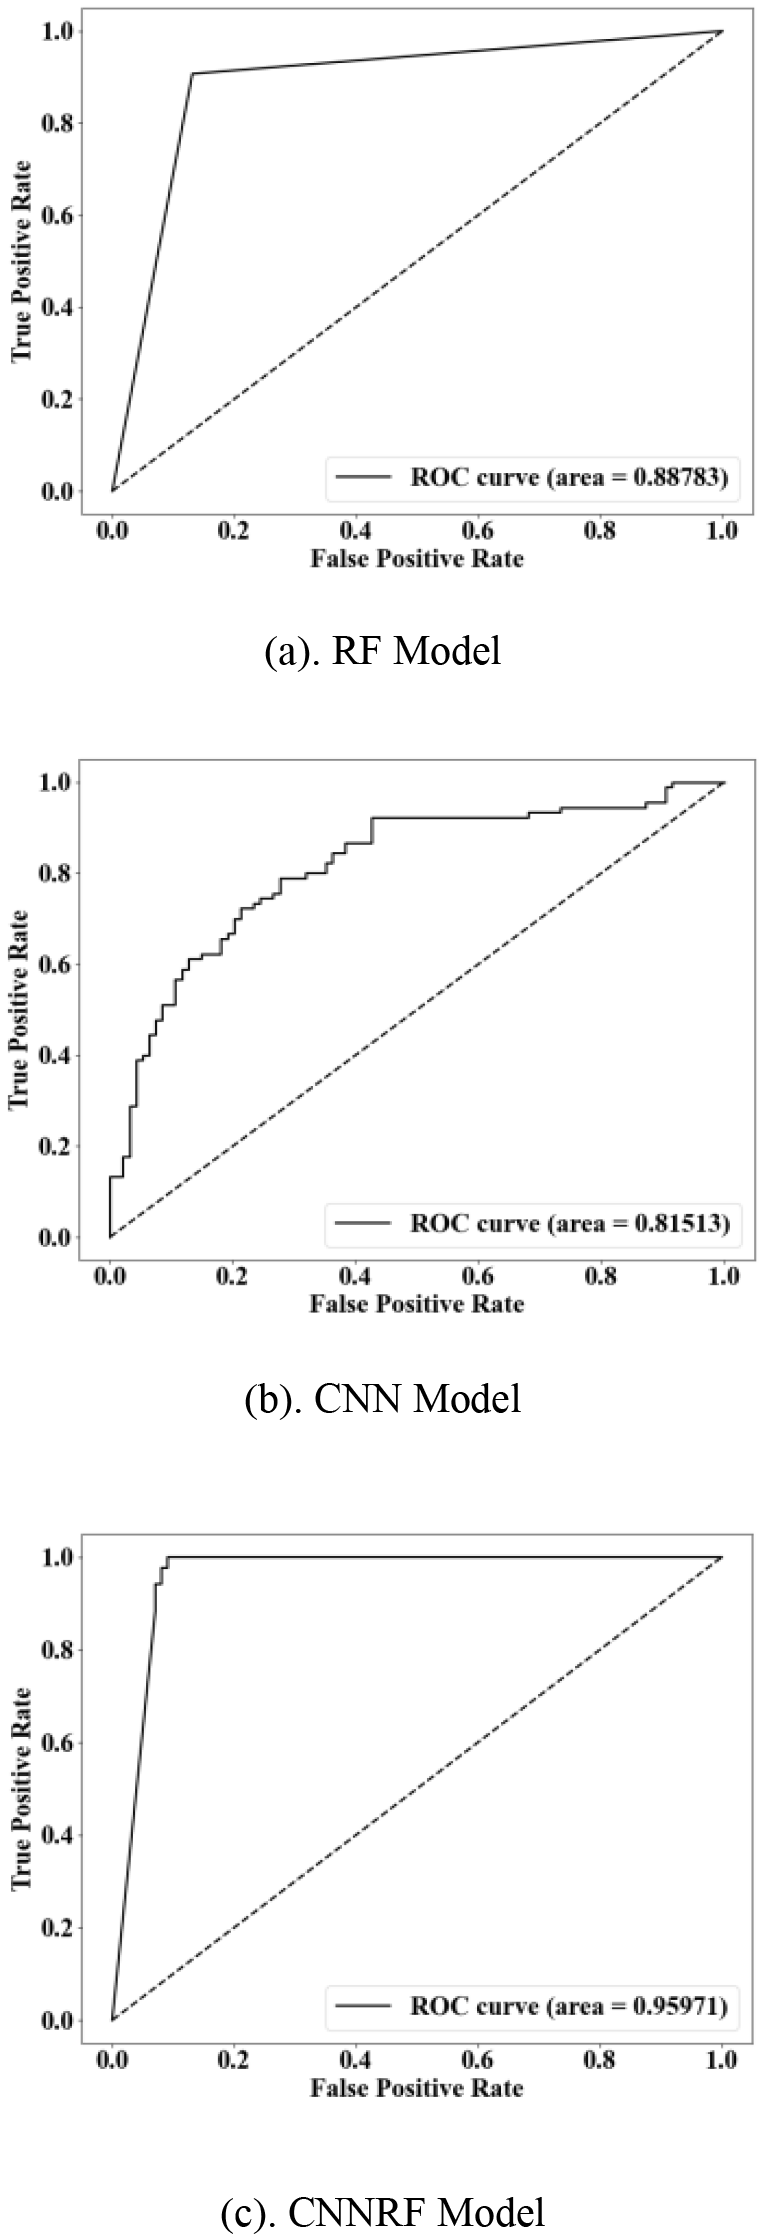
ROC curve for comparative experiments between the combination model and the original model: (a) RF model, (b) CNN model, and (c) CNNRF model.
Conclusion
There still remains a challenging task to accurately detect and classify animal fibers in electron microscope images. We propose a convolutional neural random forest classifier to classify animal fiber images. The model first get the region of interest of the animal fiber images to build its own data-sets, and then trains the CNN model. The trained model has the ability of extracting sensitive and representative multi-level features automatically from animal fiber images data-sets. Finally, the optimized random forest model is used to classify the high-level representation features extracted by CNN. The proposed method achieves a 95.971% accuracy on the cashmere and wool fiber classification system, outperforming the CNN alone and other methods. The proposed method can also be applied to other fiber classification.
Footnotes
Declaration of conflicting interests
The author(s) declared no potential conflicts of interest with respect to the research, authorship, and/or publication of this article.
Funding
The author(s) disclosed receipt of the following financial support for the research, authorship, and/or publication of this article: This work was supported by the program general projects of Shaanxi Provincial Department of Science and Technology Key R & D (No.2019GY-098), the service local science research plan of Shaanxi Provincial Department of education (No.18JC012), Science and technology innovation new town project of Yulin science and Technology Bureau (No.2018-2-24) and Shaoxing Keqiao District West Textile Industry Innovation Research Institute Project (No.19KQYB10).