
Abstract
At present, computer vision system is widely used for the cleanliness inspection for spinneret holes, but it has a high misjudgment rate for many holes with small dirt. In this paper, a method is proposed to improve the accuracy of the cleanliness inspection. The method has four sequential phases. First, the closed contour curve of a standard hole and its curvature are extracted. Based on double-threshold segmentation of the contour curve, line and arc segments are segmented to generate a closed piecewise curve model. Second, the model is fitted to the closed contour curve L1 of the hole to be inspected based on a nonlinear least squares principle, and the distance curve that represents the shortest distance between the closed piecewise curve L2 constructed from the aligned model and L1 is calculated based on the nearest neighbor search algorithm. Third, the dirt detection curve L3 is generated from the distance curve weighted by a blended weighting curve. Final, based on a global threshold combining with unevenness elimination of L3, the cleanliness index is calculated based on the segmentation and location of dirt, and is used to judge whether the hole is qualified or not. The experimental results of four databases demonstrate that, the proposed method provides better performance compared with the traditional method.
Introduction
Chemical fibers are mostly made of crystalline polymers. The fused polymer is ejected from the spinneret hole under the conditions of high temperature and high pressure, and the chemical fiber is formed after cooling and crystallization. After a period of use, the spinneret must be cleaned ultrasonically and dried, and it is necessary to inspect whether there is any remaining dirt before the spinneret is reused. Otherwise, the dirt will lead to abnormities of filament performance, which means that the cleanliness inspection of spinneret holes is an important procedure during the quality monitoring process of synthetic fiber production.
In recent years, computer vision technology has been widely used in the textile industry.1–8 For the research of the automatic inspection of spinneret holes, Yin et al. 9 and Tan 10 proposed the self-correcting position control system. Tan 10 studied many image processing algorithms for hole focusing and inspection. Komatsu et al. 11 proposed a critical dimension measurement of a hoe pattern. Nagasu et al. 12 used low-frequency sound for inspecting micro-holes with diameters of less than 100 µm. Cai et al. 13 proposed a roundness measurement with the least square circle fitting method for the processing of geometric feature recognition of holes. Zhang et al. 14 extracted the geometrical characteristics of round holes to judge whether them are blocked or not. Yang et al. 15 designed a high-precision calibration model for spinneret inspection system. Yang et al. 16 analyzed the influential factors of the measurement accuracy. Yang et al. 17 acquired the clear image of large spinneret by increasing number of auto-focus. Gu et al. 18 proposed an inspection route planning method based on improved ant colony algorithm. Wang et al. 19 achieved the judgment of block by area threshold method and calculated the shaped degree for non-circular spinneret hole. Chen et al. 20 developed a low cost digital spinneret inspection system with opencv toolkits. Chen et al. 21 developed an inclination measurement by using the imaging based autofocus method. Chen et al.22,23 established a path generation method for circle-type, rectangle-type and ring-type spinnerets. In the last 10 years, American ASPEX Co. Ltd, Japanese TORAY Co. Ltd, Chinese Academy of Sciences et al. have already developed spinneret automatic inspection systems for industrial applications.
This paper focus on the problem of the cleanliness inspection for the holes, but so far, almost all the proposed method are based on the characteristic indexes such as area and perimeter to determine whether the hole is clean or not. We know dirt inside the hole will cause the index value to be abnormal. However, due to the fluctuation of area and perimeter index values caused by machining errors beyond the sensitivity range of the detection of tiny dirt, this method is only effective for holes with large dirt whose contour is significantly different from that of a normal hole. Therefore, the cleanliness inspection for the holes with tiny dirt, especially for special-shaped holes, has always been a difficult question.
To solve this problem, we proposed the approach based on the template matching error analysis method. Firstly, we extracted the standard contour template of the hole, and defined the distance curve as the error distribution of the alignment between the contour of the standard template and that of the hole to be inspected. Secondly, the dirt detection curve from the distance curve weighted with a blended weighting curve was defined. Finally, the cleanliness index was qualified based on the segmentation and location of dirt on the dirt detection curve. However, if the contour curve is used as a rigid-template aligned to that of the hole to be inspected, especially for complex-shaped holes, the local fitting error between the template and the deformed contour curve caused by machining errors can easily lead to a false-positive dirt identification. Therefore, according to the mechanism of the contour curve of hole mainly based on the combination of line and arc segments, we proposed a closed piecewise curve model with parameterized control points for non-rigid registration to the contour curve of the hole to minimize the errors, which can not only ensure the overall rigidity of the segments in the model, but also avoid their excessive deformation. The proposed method can improve the accuracy of the cleanliness inspection and be suitable for the most shapes of holes with various degrees of dirt distribution.
As Figure 1 shows, our approach includes six steps: (a) Extracted the closed contour curve
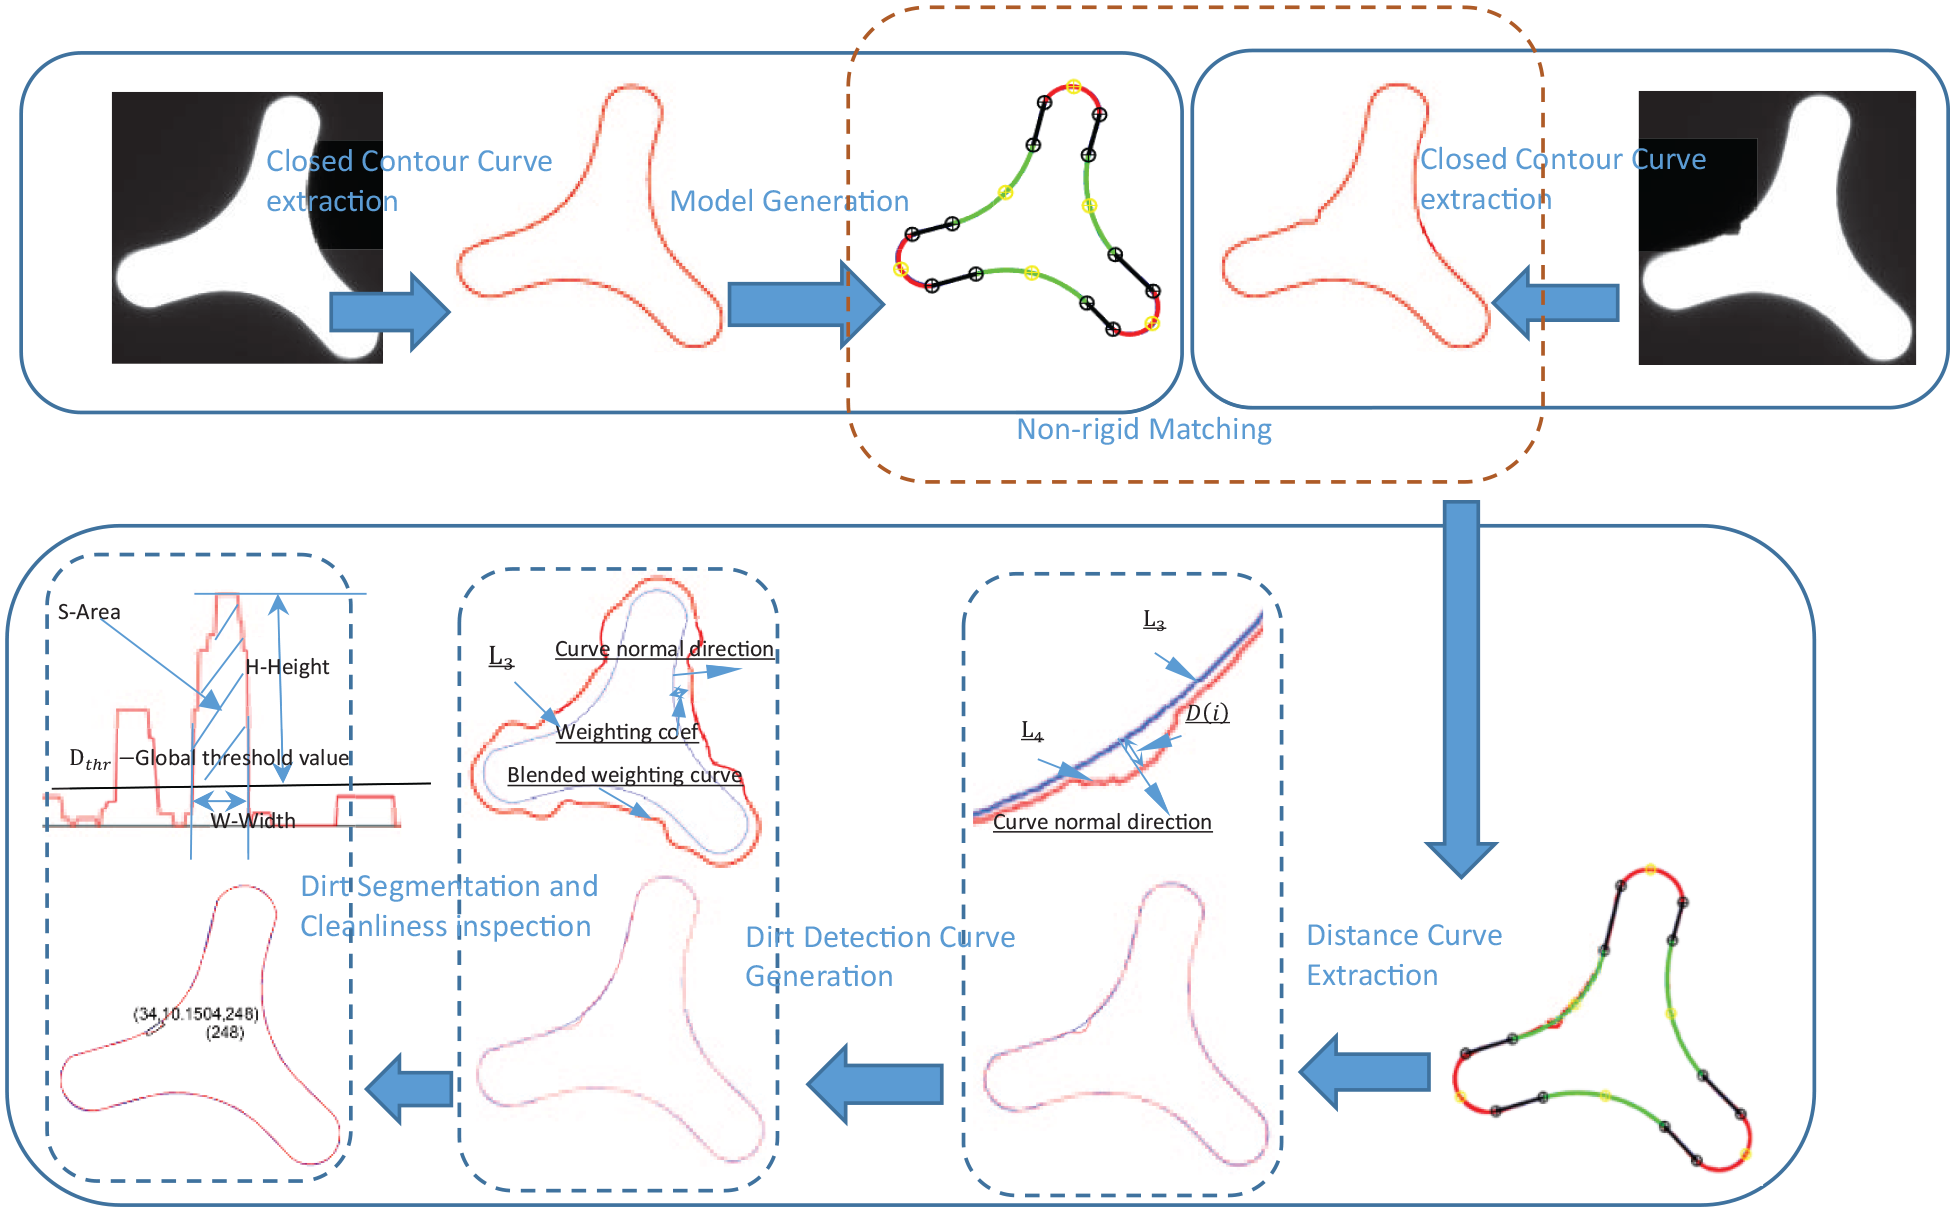
Flow chart of the proposed method.
Image acquisition
Our Image acquisition system includes motor control unit, image acquisition unit, light unit, etc. The motor control unit was adopted with three-axis ADLINK servo motor control system, the acquisition unit was adopted with Basler 500M industrial camera (2592 × 1944 × 8 bit and 15 frames/s) and a 14× zoom lens, and the light unit was adopted with upper LED lighting for focusing and back LED lighting for acquisition. The software was compiled with C++ on a Windows system.
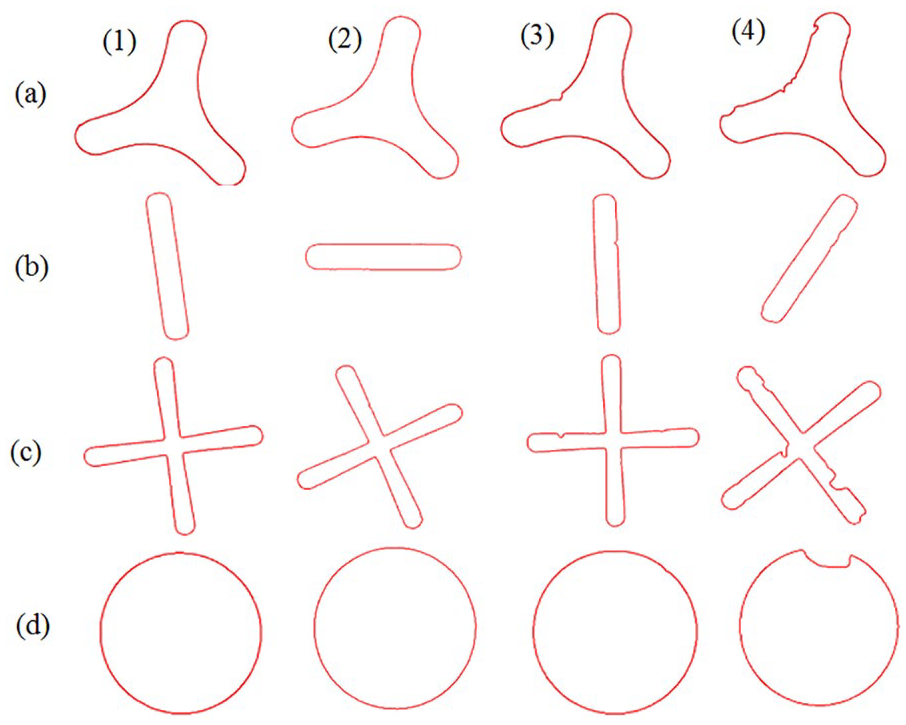
In this paper, four types of small image database were collected. Each database belongs to a same spinneret plate. Among them, DB1 has 36 images with Y-shaped holes (DPI = 1.4594 µm / pixel, 0.5 mm (petal length) × 0.18 mm(petal width), including 26 clean holes), DB2 has 268 images with flat-shaped holes (DPI = 2.3681 µm / pixel, 0.4 mm(petal length) × 0.06 mm (petal width), including 255 clean holes), DB3 has 22 images with cross-shaped holes (DPI = 1.9692 µm / pixel, 0.45 mm(petal length) × 0.1 mm (petal width), including seven clean holes), DB4 has 51 images with round holes (DPI = 2.3681 µm / pixel, 0.18 mm (diameter), including 37 clean holes). The holes in DB1 to DB4 have been identified with clean or dirt by experienced inspectors, and all images in each database have been cropped to the appropriate size. Figure 2(a) shows the working diagram of the system when the upper and back light sources are turned on. Figure 2(b) shows the back and front image of the spinneret plate. Figure 2(c) shows the front and back project lighting image captured from a round hole with sharp-shaped large dirt. Figure 2(d)–(g) show four images of DB1 to DB4 respectively, in which column 1 is the standard clean hole, which is used as the image for model generation, column 2 to 4 are holes with clean, tiny and large dirt, respectively, which are used to analyze the effects of cleanliness inspection lately.

Image acquisition: (a) acquisition system, (b) images of the spinneret plate, (c) images of round hole with sharp-shaped dirt, and (d)–(g) four images in DB1to DB4 respectively.
Method of cleanliness inspection
Closed contour curve reconstruction
The edge of a clean hole is smooth and it will become irregular if there is dirt in the hole. The brightness of the dirty inside of the hole changes with the size of the dirt and its distance from the edge of the orifice. It is difficult to find a suitable fixed threshold for various dirt segmentation, because even small changes of threshold will lead to a shift of the segmented boundary. However, due to the properties of non-maximum and zero-crossings, the edge detector can locate the edge more precisely than the global thresholding method. We used the canny method
24
to extract the hole boundary, in which two thresholds are used to detect strong and weak edges, and the true weak edges are detected more likely and robustly, which is especially suitable for detecting the tiny dirt. Here, we used
Reconstructed closed contour curve: (a)–(d) correspond to the results of Figure 2(d)–(f).
Model generation
Let
Calculation of the curvature
Let

Examples of the model generation process: (a) illustration of curvature calculation, (b)–(f) the curvature curve, line and arc segmentation, fitted line and arc segments and the reconstructed model generated from Figure 3(a1), respectively, and (g)–(i) the reconstructed model generated from Figure 3(b1), 3(c1), and 3(d1), respectively.
Closed piecewise curve model with parameterized control points
Let


Where
Figure 4 shows examples of model generation with parameters set as
Non-rigid registration of the model
Let

We used the ceres-solver optimal method (http://ceres-solver.org) to solve equation (5), and the optimized control point set was obtained as

The non-rigid registration of the model: (a) the result of alignment of the model in Figure 3(a3) to Figure 4(f), (b) the CPCM from the aligned model in (a), and (c) zoomed-in view of (b).
The distance curve
We redefined

Note that
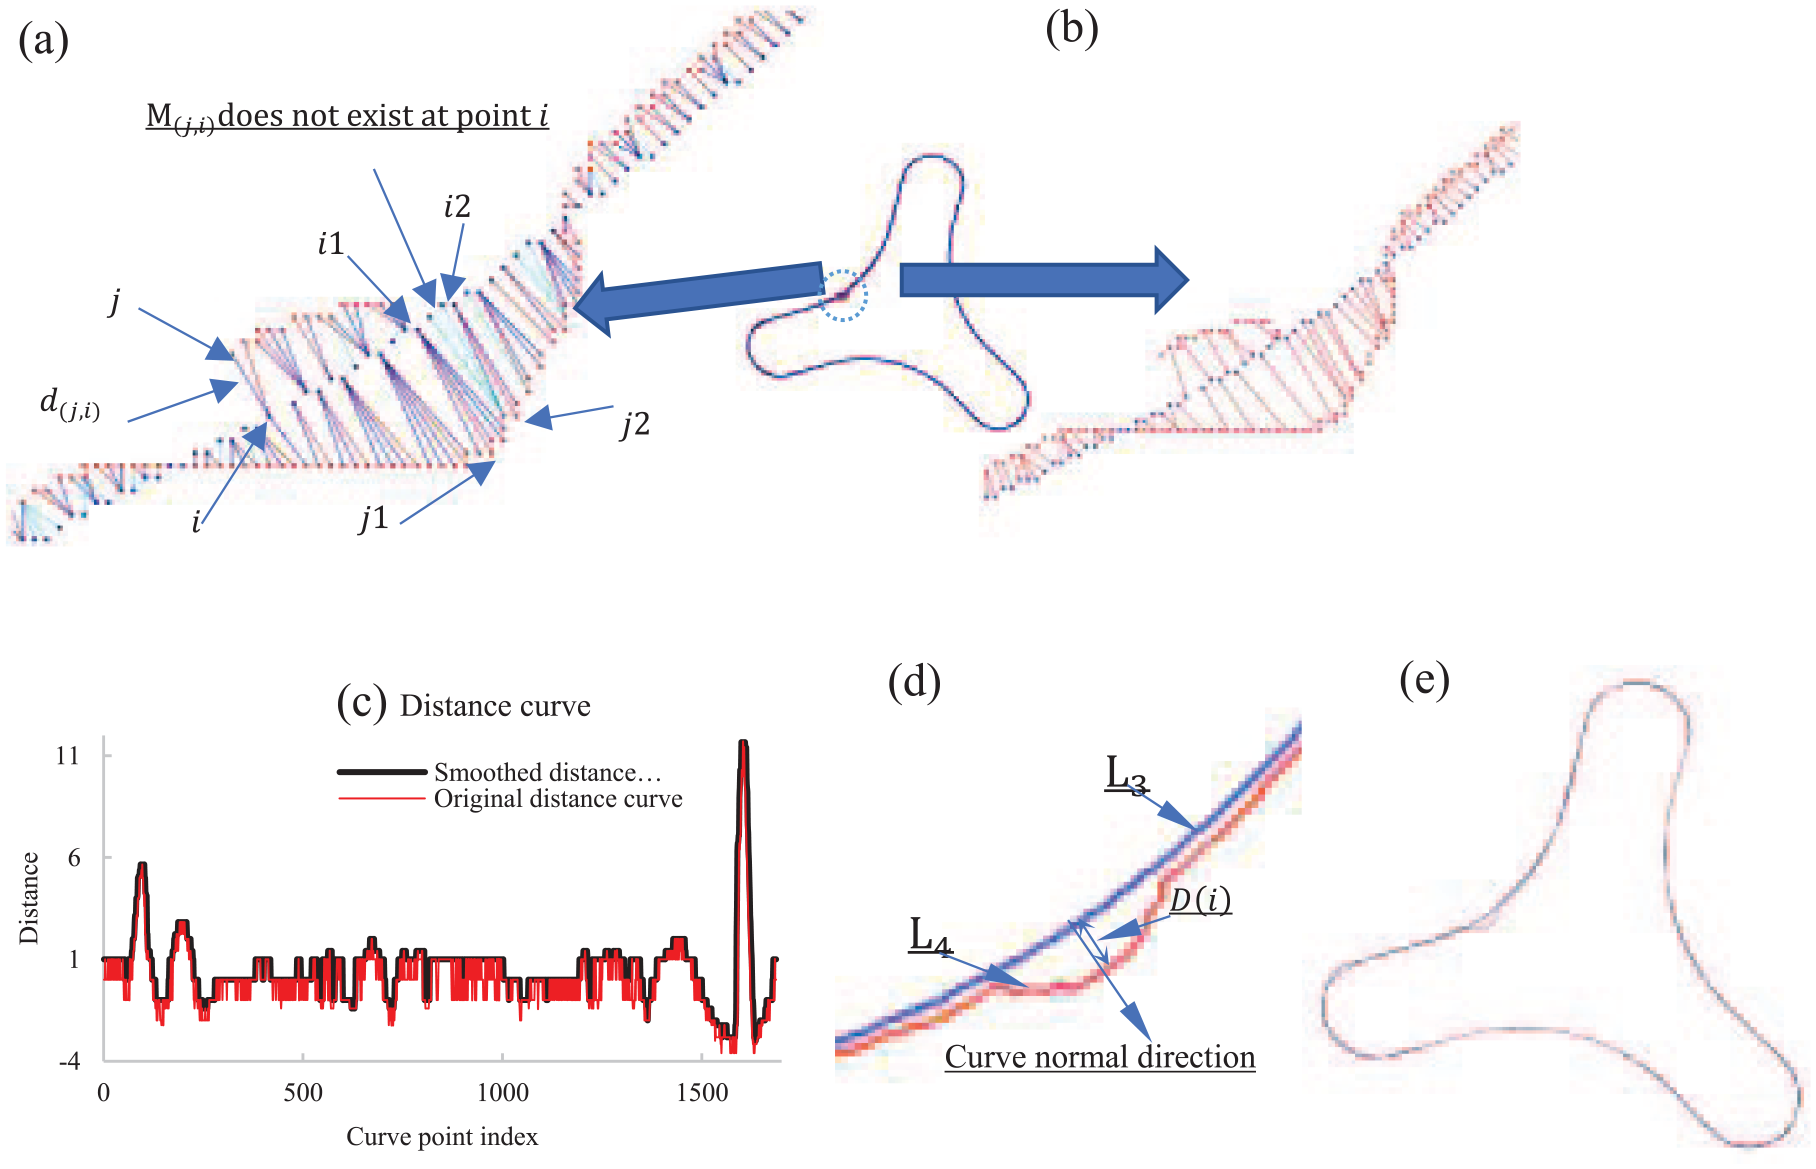
Distance curve calculation: (a) overview of distance curve calculation with local enlargement, (b) the calculation results of (a), (c) the 1D distance curve L4, (d) the illustration of the 2D distance curve constructed from L4, and (e) the 2D smoothed distance curve of (c).
The dirt detection curve
A smaller curvature often leads to a larger mechanical processing error, which results in a larger error between


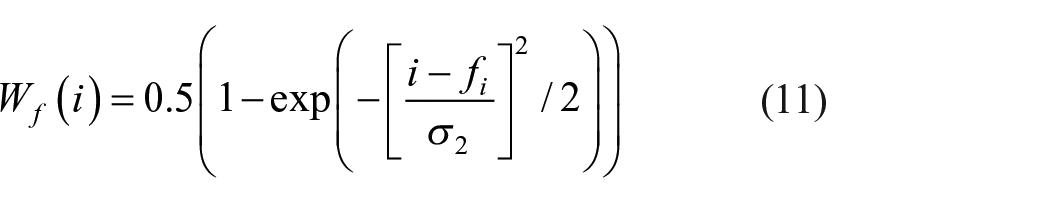


Figure 7 shows the calculation of the dirt detection curves in Figures 6(e). In Figures 7(b), the distance from each point on the blue curve along the normal direction to the red curve is its blended weighting coefficient. From the comparison between Figures 6(e) and 7(c) we can see that the false singularity blob caused by the nonlinear fitting errors is mainly suppressed by the blended weighting function.

The dirt detection curve: (a) the weighting curves of L4, (b) the 2D blended weighting curves of L4; (c) the 2D weighted dirt detection curves of Figure 6(e), shown as red line.
Dirt segmentation and cleanliness inspection
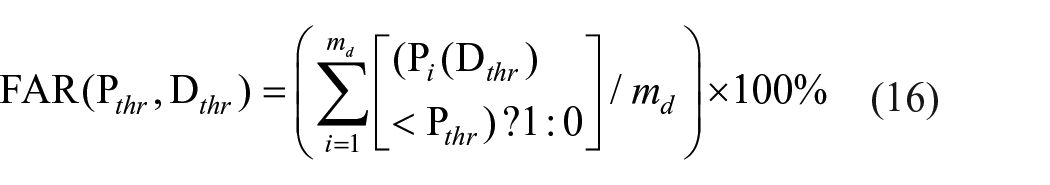
Generally, the distance curve and the dirt detection curve of a standardized hole are approximately smooth and flat, and the dirt appears as a singularity blob in the detection curve, which can be segmented and located by a global distance threshold. However, due to the machining error of the spinneret, plate deformation and abrasion of the hole after many times of use, local distortion will occur at the contour curve of the hole, which leads to baseline unevenness in the dirt detection curve, as shown in Figures 8(a). This unevenness makes the global thresholding method unsuitable for dirt segmentation. Therefore, we adopted the top-hat transform
25
to eliminate the irregularity of the baseline in the dirt detection curve, as shown in Figures 8(b). Figure 8 shows the results of dirt segmentation and location in Figures 7(c). The model of dirt segmentation and its parameter definition are shown in Figure 8(d), where W, H, and S are the width, height, and area of dirt respectively and

In Figure 8(e), the cleanliness index of the hole is shown in the center in parentheses, the same as below. Meanwhile, the location of dirt is labeled with the black wireframe, and the dirt parameters are shown as (W, H, S) next to it. Let


Where

In the factory,
The segmentation and location of dirt: (a) and (b) baseline estimation and its elimination for Figure 7(c), respectively, (c) the 2D curve of (b), (d) the illustration of dirt segmentation and its parameter definition, and (e) the dirt segmentation and labeling for (c).
Results and discussion
We firstly listed part of holes in DB1 to DB4, and aligned every contour curve of clean holes to that of its standard hole. Then we optimized the
Distributions of aligned contour curve of clean holes
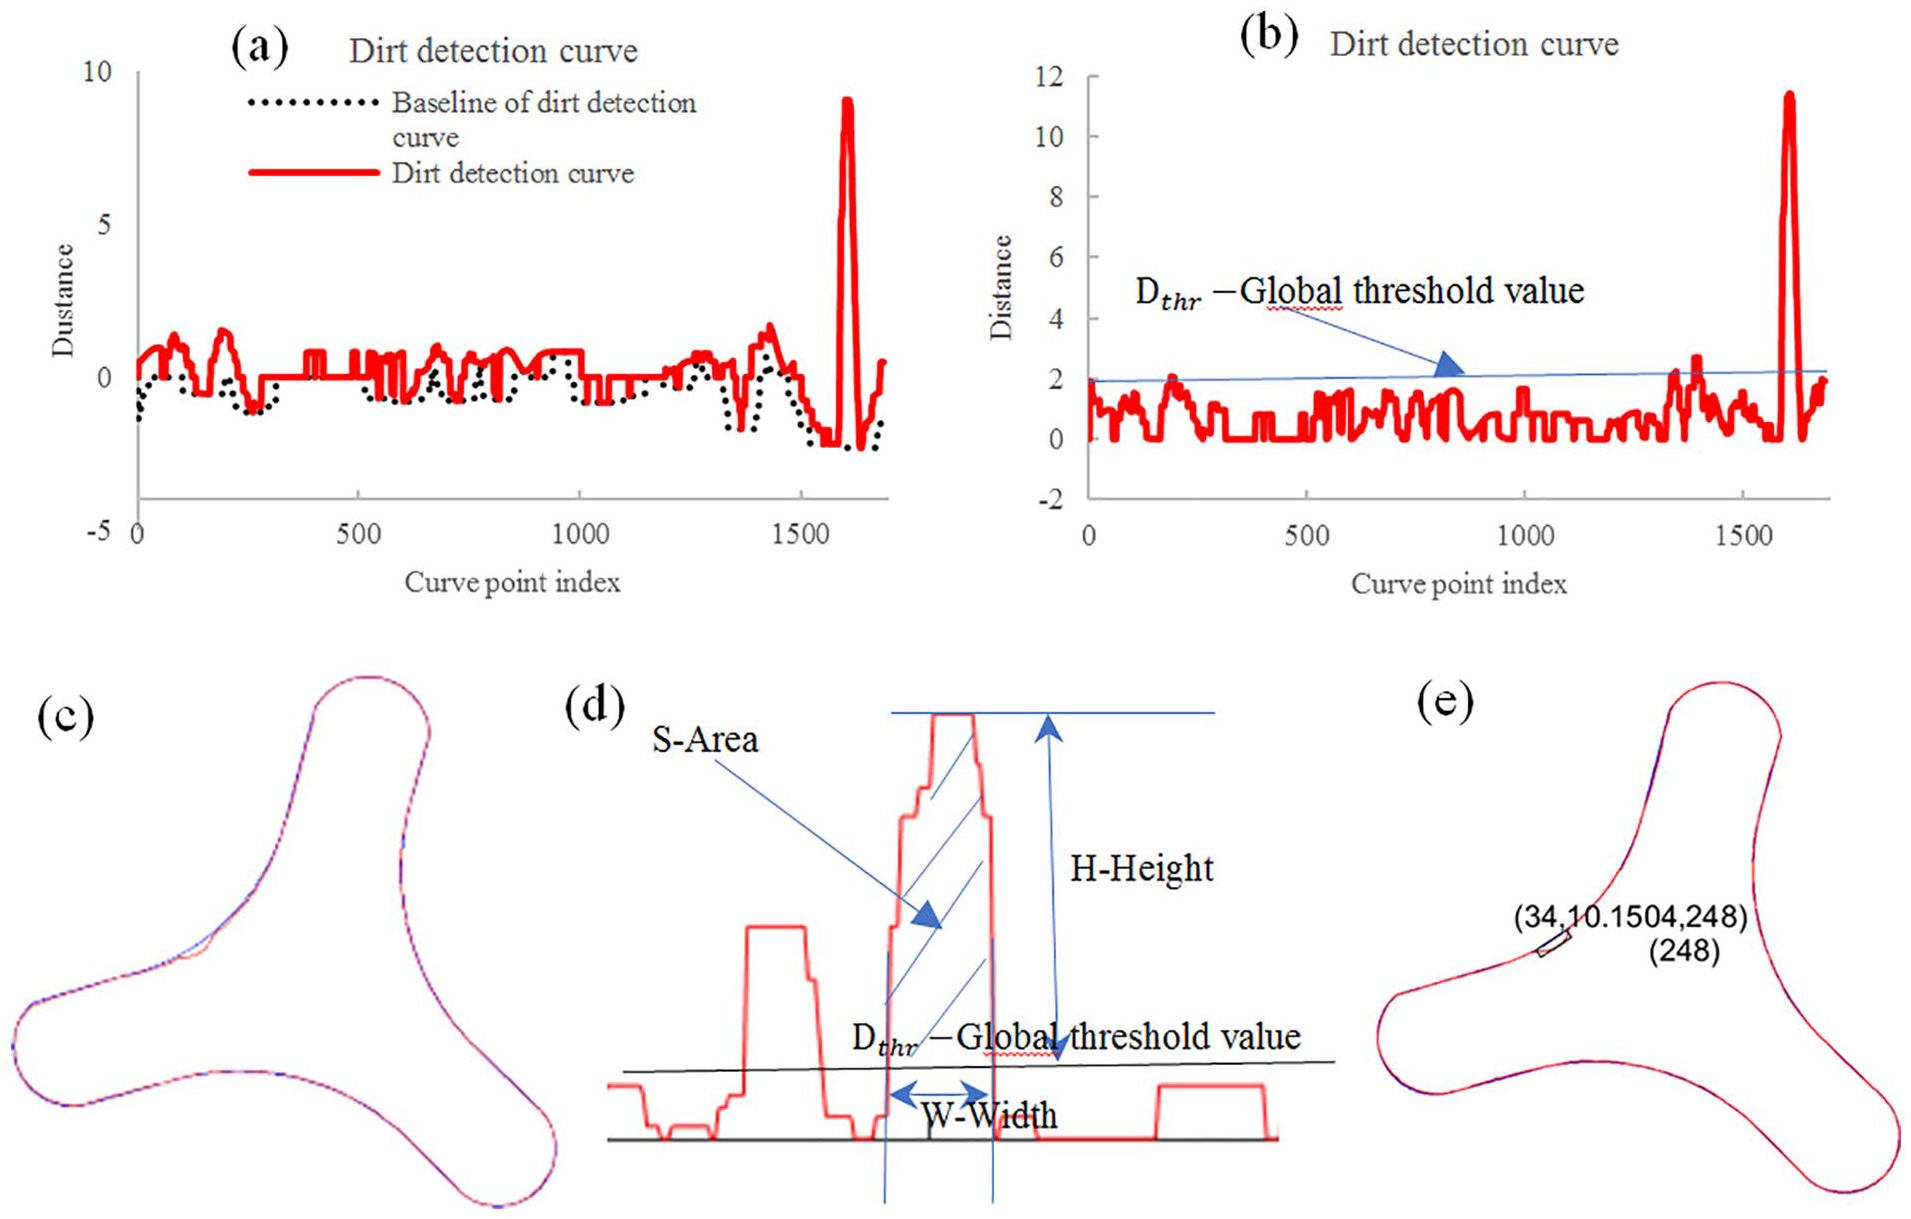
Part of the clean holes in DB1 to DB4 collected in this paper are shown in Figure 9(a)–(d), and the dirty holes are shown in Figure 10(a)–(d). We aligned the contour curve of the clean hole in each database to that of its corresponding standard hole rigidly, and the deformation of each hole due to machining errors can be visually observed. Figure 11 shows the error distributions between the aligned contour curve of clean holes and that of its standard hole (shown as red line in the enlarged area in Figure 11(a)–(d)).
Part of clean holes: (a)–(d) corresponds to DB1 to DB4, respectively.

The holes with dirt: (a)–(d) correspond to DB1 to DB4, respectively.

The error distribution of the contour curve of clean holes: (a)–(d) correspond to DB1 to DB4 respectively.
Optimization for
and
Figure 12 shows the optimization curves of TRR-
Optimized parameters and the accuracy of identification for the proposed method.


The optimization curves: (a)–(d) correspond to DB1–DB4 respectively.
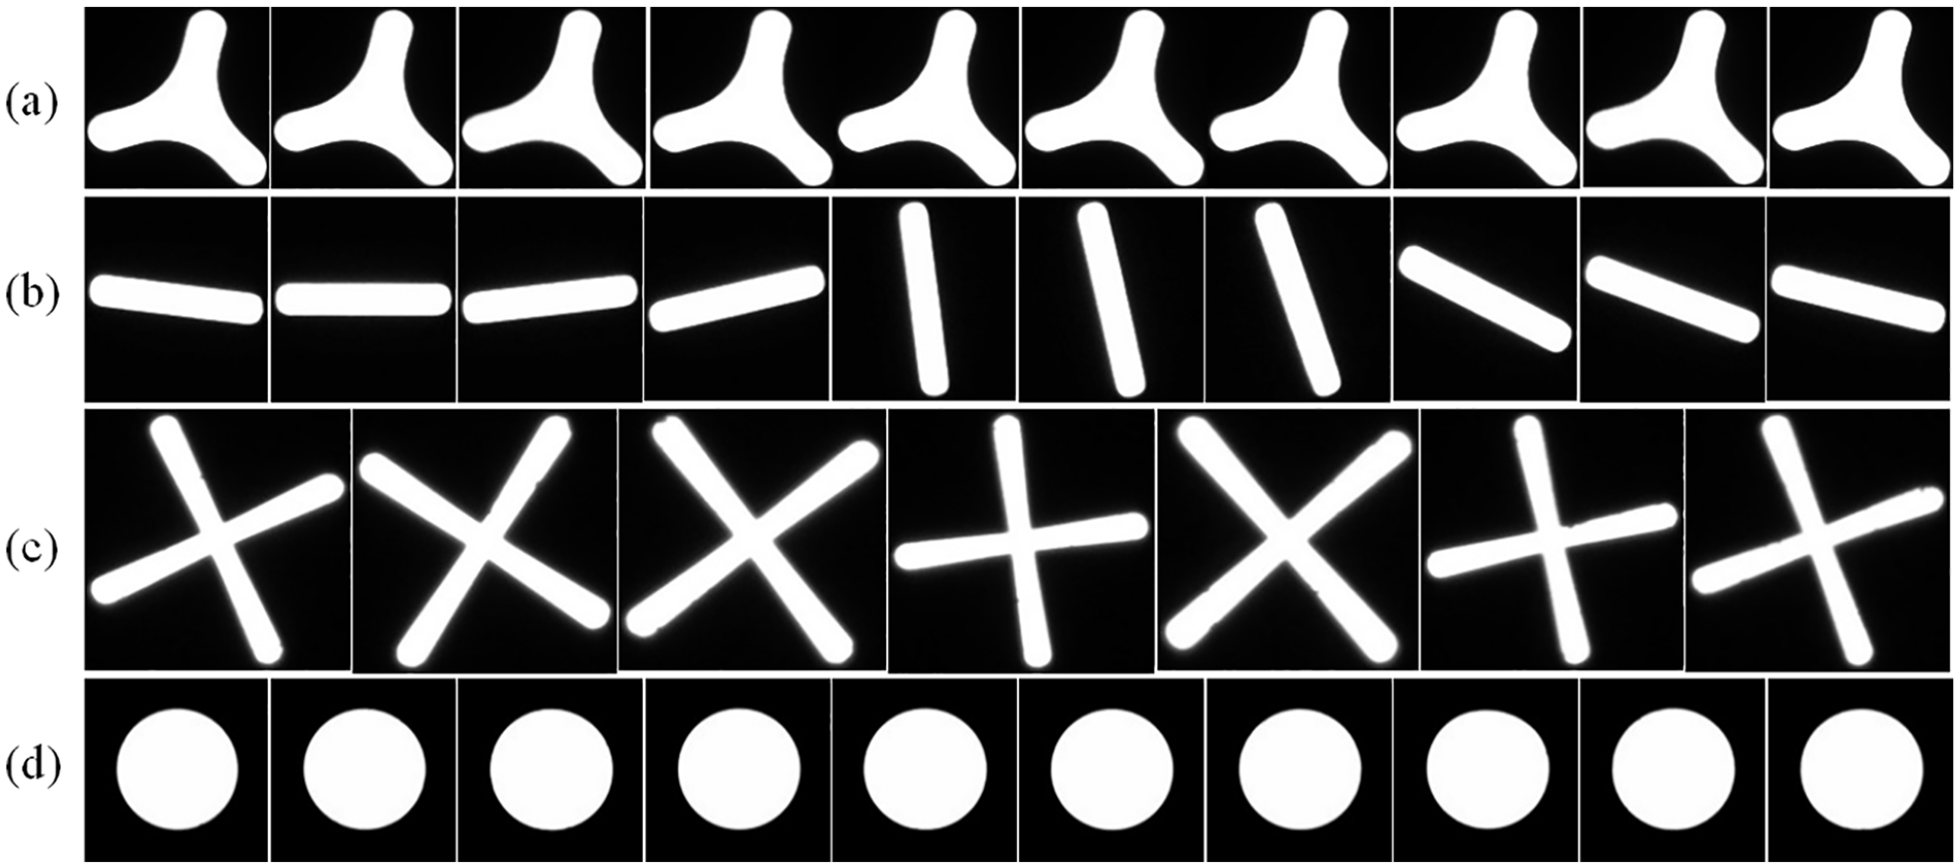
(a)–(d) The histograms of cleanliness indexes in DB1–DB4.
Analysis of the dirt inspection
Figure 14 shows the cleanliness inspection results of holes in Figure 3 with optimized parameters, in which we can see that this method can satisfy the requirements for cleanliness inspection of holes with various degrees of dirt. In Figure 14(a) to (d), the holes are clean identified by manually, and there is no dirt detected except for a small dirt with a very low cleanness index in Figure 14(c), which indicates that there may be errors in subjective evaluation or the rule of judgments for complex-shaped holes may be relaxed. From Figure 14(e)–(g) we can see that, for holes with tiny dirt, the non-rigid registration of the model can accurately relocate the control point to the target position of the contour curve, and the dirt can be recognized correctly both in the line and arc segments. Especially for the round hole in Figure 14(g), the curvature difference between the two arcs in
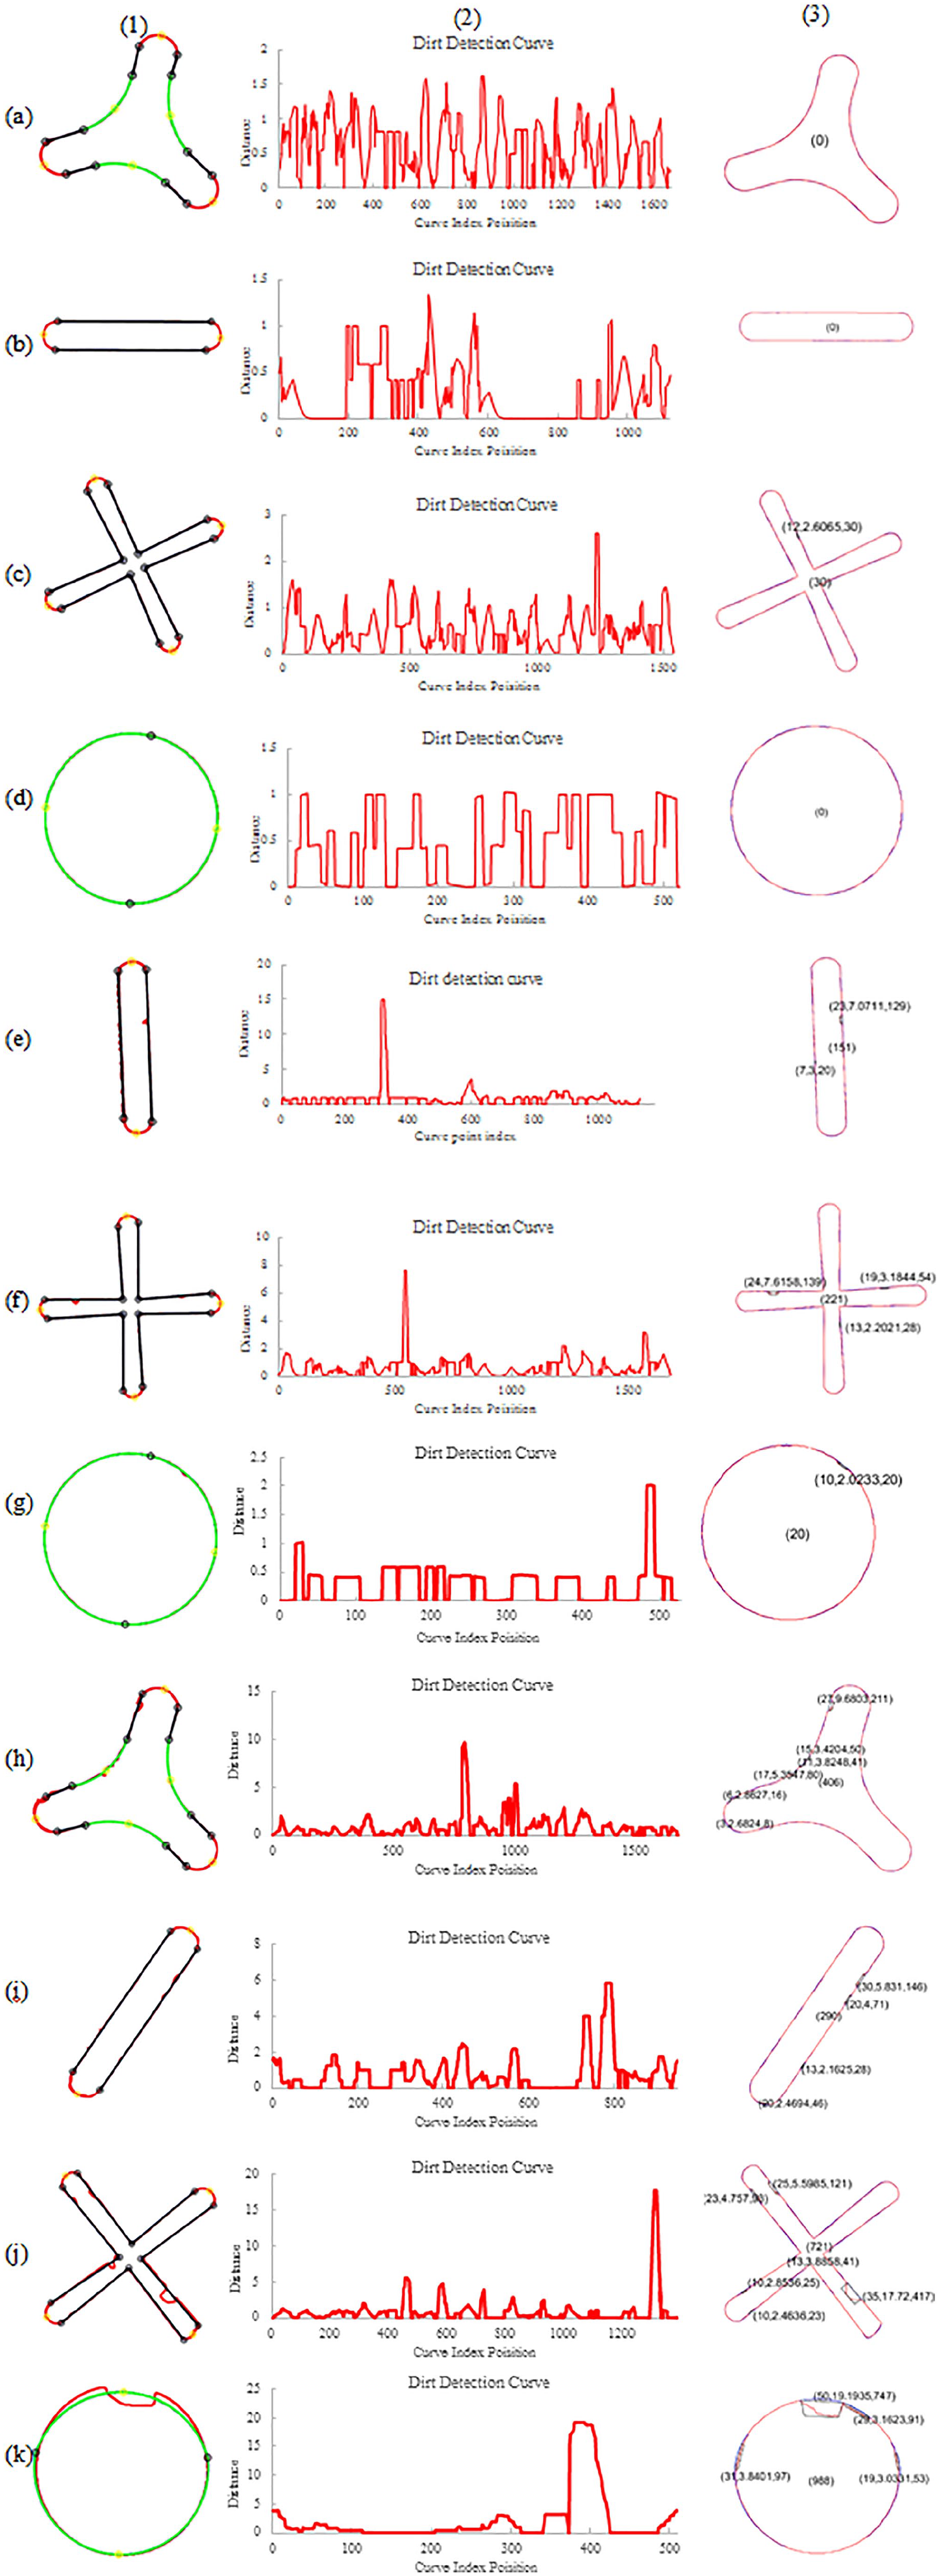
Cleanliness inspection results: (a)–(d) and (h)–(k) correspond to the results of column 2 and column 4 in Figure 3, respectively, (e)–(g) correspond to the results of (c2), (c3), and (c4) in Figure 3, respectively. Column 1: non-rigid registration; Column 2: dirt detection curve; Column 3: dirt segmentation and labeling.
Identification based on the traditional method
We defined the curve length of

Where

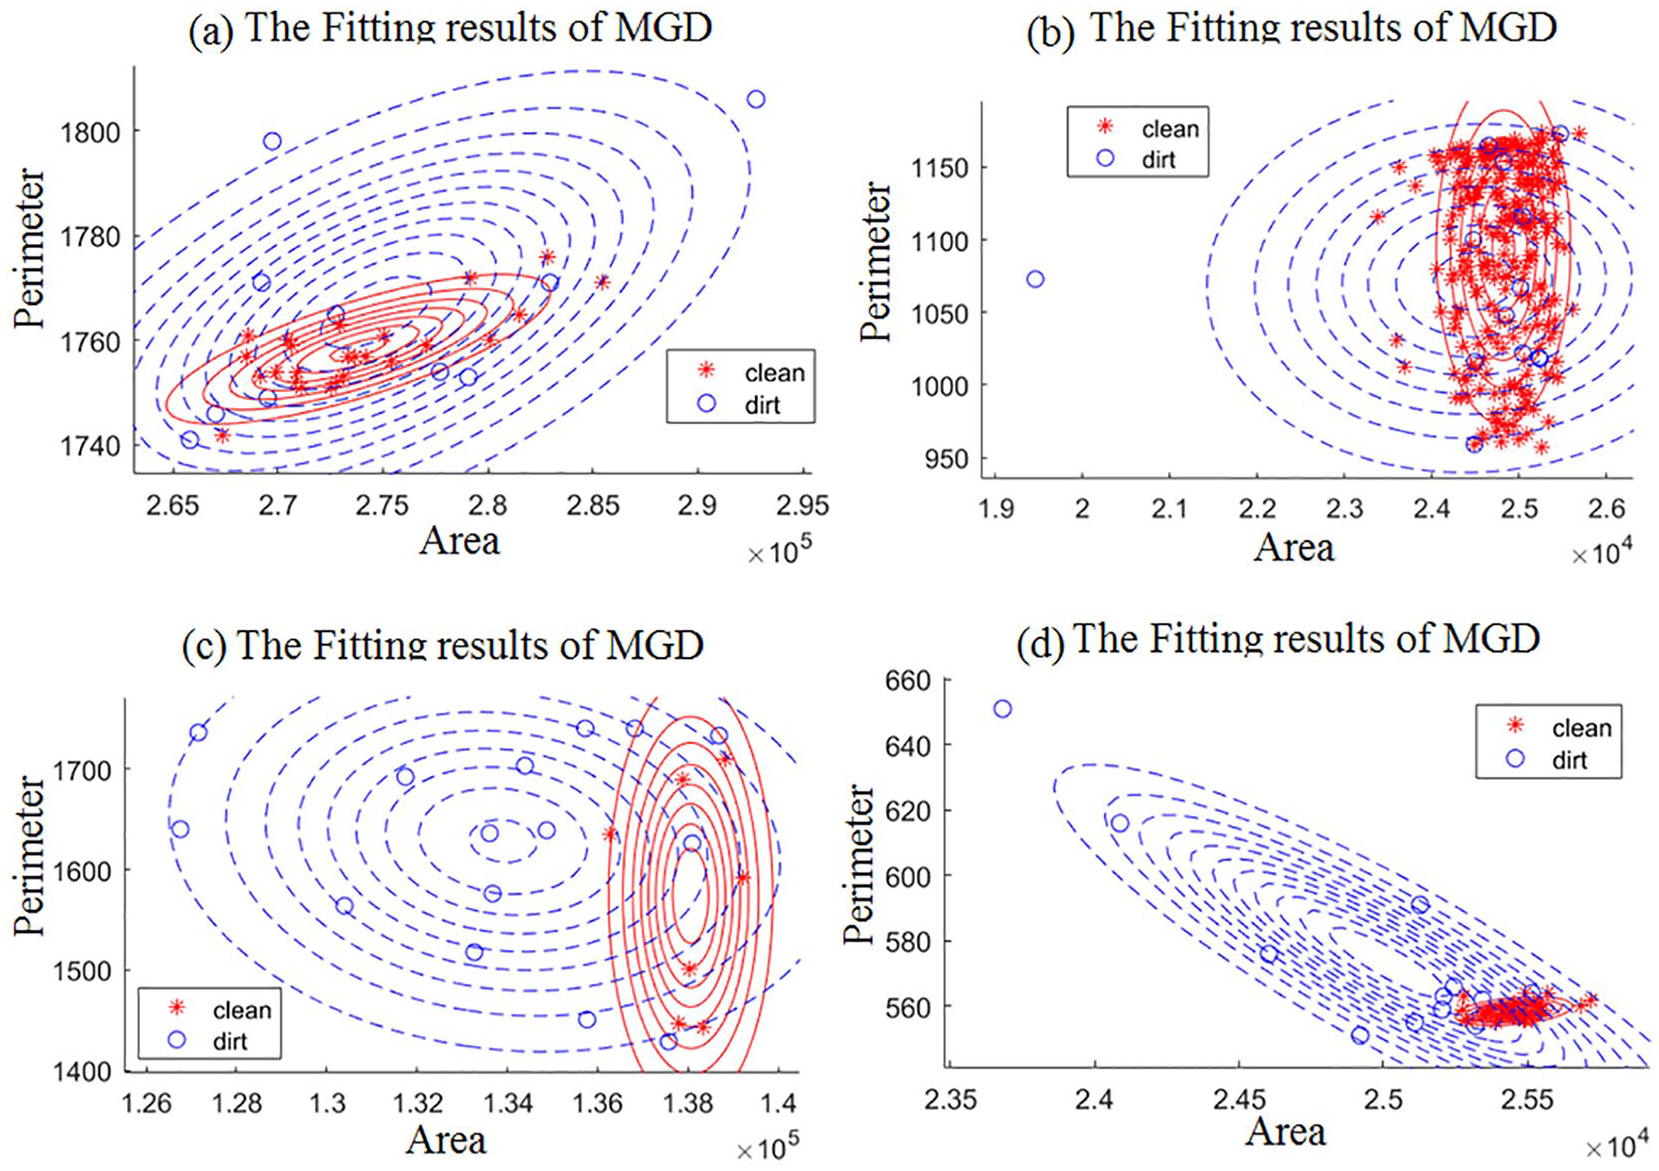
The fitting results of MGD: (a)–(d) correspond to DB1 to DB4 respectively.
Fitted parameters of MGD.

Table 3 shows the values of FAR, FRR and TRR calculated from equation (21) to (23) in DB1 to DB4. We can see that in DB2 only Figure 10(b6) that blocked nearly in half was identified as dirty hole, and half of the dirty holes in DB1 were mistaken for clean holes, and in DB3 and DB4 the low FAR is due to the low overlapped area of two fitted MGD.
The accuracy of identification based on fitted MGD.

Comparison of the accuracy between the proposed and traditional method
By comparing Tables 1 and 3, the average values of TRR, FAR, and FRR for the proposed method are 97.2, 12.3, and 0, respectively, while those for the traditional method are 82.5, 51.2, and 9.7. We can see that the performance of the proposed method is advanced and much better than that of the traditional method. In Table 3, high FAR and FRR indicate that it is difficult to identify the hole is clean or dirty using only the parameters of area and perimeter. In actual inspection, high FRR will seriously reduce the work efficiency and high FAR will significantly decrease the product quality. Under the guarantee that FRR is zero, several holes with dirt within the critical range can be ignored. Hence, our proposed method can meet the requirements for cleanliness inspection in factory.
Application for complex-shaped spinneret holes
Here two types of complex-shaped spinneret holes were collected to verify the performance of the proposed method. One is 3C-shaped holes with three unconnected C-shaped holes, and anther is caterpillar-shaped holes, which are composed of continuous arcs and lines. The results of their cleanness inspection were shown in Figures 16 and 17. We can see that, the models of CPCM were correctly reconstructed and aligned to the contour curves of dirty holes, and the tiny dirt was located based on the dirt detection curve and their cleanliness index were given. Since most of the spinneret hole shapes are not more complex than those listed in this paper, it can be inferred that the proposed method can meet the requirements of the cleanliness detection for vast majority of irregular-shaped spinneret holes.

The cleanliness inspection for 3C-shaped spinneret holes: (a)–(d) correspond to the dirty hole image, the aligned CPCM, the dirt detection curve and labeled cleanliness index.

The cleanliness inspection for caterpillar-shaped spinneret holes: (a)–(d) correspond to the dirty hole image, the aligned CPCM, the dirt detection curve and labeled cleanliness index.
Conclusion
In this paper, we proposed a method to improve the accuracy of the cleanliness inspection. This method generated a closed piecewise curve model and aligned it to the contour curve of the hole. The cleanliness index was calculated from the distance curve representing the distribution of dirt by the model of dirt segmentation and parameters definition. The outcomes of this research work are as follows:
(a) Four types of small image databases are collected by our acquisition system;
(b) Our experiment produces good performance in cleanliness inspection of spinneret holes;
(c) For round and special-shaped holes, we achieve the accuracy of 0% for FRR and 12.3% for FAR, which provide a much better performance than the traditional method;
(d) Moreover, our method can be extended to the cleanliness inspection for the most shapes of holes and the geometry parameters of hole can be calculated in terms of its closed piecewise curve model in the future.
Footnotes
Declaration of conflicting interests
The author(s) declared no potential conflicts of interest with respect to the research, authorship, and/or publication of this article.
Funding
The author(s) disclosed receipt of the following financial support for the research, authorship, and/or publication of this article: This work was supported in part by the Shanghai Municipal Science and Technology Commission under Grant No. 18030501400.