
Abstract
This paper investigates on a computational simulation of Twaron® fabric against ballistic impact. It proposed a hybrid shell element model considering the strain-rate-sensitive failure criterion. This model innovatively provided a resolution of the yarn level to better capture the unique properties of the woven fabric, such as yarn crimp, sliding contact between yarns, stress transmission on yarns and yarn broken. The fabric is modeled using a hybrid shell element analysis approach aim of reducing the complexity and computational expense while ensuring accuracy. The response characteristics of fabric under high velocity ballistic impact are studied by applying a 3D finite element program DYNA3D in this paper and the experimental investigation had been taken by Shim et al. According to the computational and experimental results, transverse deflection distribution and stress transmission of fabrics are presented. The ballistic limit, energy absorption, remaining velocity are calculated by simulation models and compared with the experimental results. This approach is also validated by comparing it against a 2D uniform shell model and a 3D interlacing shell model. The results show that the hybrid model can accurately reflect the buckling and fluctuation behavior of fabrics and has a relatively few computational consumption at the same time.
Introduction
Modern bulletproof vest commonly consists of several layers of fabric or other forms of textile fabric that resist high-speed projectiles by dissipating and absorbing their kinetic energy. 1 They are widely used in protective clothing owing to high strength to weight ratio, scalability and their good impact resistance. Kevlar and Twaron are common used in the manufacture of such high performance fabrics. While extensive ballistic impact tests should be attempted at the design processes of those high performance fabrics. It would cost most of the design time and much more expensive. Noticeably, with the advent of supercomputing, there are many attempts to numerically simulate the shock resistance of woven fabrics. 2 Various simulation techniques and influencing factors for shock response of woven fabrics have been summarized in the reviews presented by Tabiei and Nilakantan 3 and Cheeseman and Bogetti 4
It is a common method to model the fabric as a one-dimensional bar element network. Shim et al. 5 and Cunniff and Ting 6 used this bar element network to establish a yarn model for the fabric. In order to reflect the crimping of yarns, the non-coplanar component with kinks were modeled using the bar elements by Zeng et al. 7 Johnson et al. 8 and Shahkarami et al. 9 also applied the bin-connected bar elements to research the interlacing yarns. Another method commonly used by researchers is to idealize fabrics into two-dimensional shells or membranes. Simons et al., 10 Phoenix and Porwal, 11 and Lim et al. 12 modeled yarns using such idealization of fabrics to simulate the overall fabric behavior in ballistic impact applications. Despite fabrics have some points of similarity to membranes, this method loses details of fabric structure and certain characteristics, such as yarn slipping and unraveling of yarns. To address this issue, full-size discretization of yarns was carried out using detailed solid elements by Feito et al., 13 Duan et al.,14,15 and Chen et al.16,17 Owing to the advantages of using solid elements to model yarns, physical modeling of anisotropic material properties, friction between yarns and fluctuations in woven fabrics can be physically modeled. However, the main drawback of this approach is the increased computational cost attribute to the large number of elements required as acknowledged by Duan et al. 14
In recent years, multi-scale modeling techniques have emerged that try to solve the contradiction between computational accuracy and precision of modeling. Nilakantan et al. 18 provided a hybrid element analysis method in which yarns near the impact zone was discretized by the solid element, and the yarns in the surrounding region is transferred to the shell elements. The thin shell elements at the point of impact and the near-grid uniform orthotropic film at the location far from the center are used to simulate the yarn by Barauskas and Abraitiene. 19 However, they did not consider the influence of strain rate sensitive properties of the materials and a large computational expense of their models were still necessary.
Aramid fiber is strain rate sensitive and this property plays a significant role in impact applications. Previous studies20,21 had shown that the strength, stiffness, failure strain and stress of aramid yarns were significantly dependent on the strain rate. In simulation techniques, Shim et al. 5 inferred that the material model incorporation of a velocity dependent could better predict the energy absorption of the fabric. Other computational models of polymer woven fabrics that incorporate rate-dependent constitutive models include these works.7,12,22,23 Nevertheless, the friction properties between warp and weft yarns are ignored. The interface contact between them are quite different from the physical model so that it will contribute to part of the error and discrepancies.
In order to improve the precision of modeling and develop a more realistic modeling method as while as reducing the computational requirements, a lot of researches are still needed to carry on. To this end, this paper presents a hybrid shell element model based on a “center-cross” modeling method. That is, yarns are discretionally modeled using 3D undulating shell elements within the center of the intersection which extends all the way to the fabric boundary, while uniform shell model in the other global region. As a comparison, the single 2D uniform shell model and 3D interlacing model are established and analyzed. Strain rate sensitive properties of the materials are considered in all the models proposed. The aim of the hybrid model is set to accurately reappear the actual results of the ballistic tests and has a relatively few computational consumption at the same time.
Finite element modeling
Finite-element model
LS-DYNA that an explicit nonlinear finite element analysis code is used to simulate the ballistic impact of a rigid sphere onto a single layer Twarons CT716 fabric. Initial geometry of the impact event is shown in Figure 1 as follows: a rigid sphere, with a mass of 9 g and diameter of 13 mm, impacts onto the center of a square fabric at normal incidence, and the dimensions of the fabric are 120 mm × 120 mm. Solid elements are used for spherical projectile and 2D uniform shell elements for the fabric. Two opposite ends of the fabric are clamped and the fabric is subjected to impact by the projectile at different speeds. In order to simulate stress wave propagation in the fabric from point of impact to the free and clamped edges and back. Both the spherical projectile and the fabric are modeled in full.

The geometry of the impact event in 2D uniform shell model.
As a comparison and improvement program, a 3D interlacing model using undulating shell elements is established to provide an actual morphology of the interwoven yarn architecture as shown in Figure 2. That is, each warp is alternately passed under and above the orthogonal weft yarn according to the relevant information from the micrograph of the Twarons CT716 fabric cross-section. This model is able to illustrate the sliding, crimping, rate dependent properties and failure of yarns during impact.

The geometry of the impact event in 3D interlacing model.
However, it is too computationally expensive to simulate the complete fabric model involved in yarn discretization. In order to solve the contradiction between computational requirements and precision of modeling, hybrid element model based on a “center-cross” modeling method is developed as illustrated in Figure 3. The yarns are discretionally modeled using 3D undulating shell elements within the center of the intersection which extends all the way to the fabric boundary, while uniform shell model in the other global region.

The geometry of the impact event in hybrid element model.
Material model
Table 1 as following listed the relevant specifications of the Twaron® CT 716 fabric. Like most polymer materials, Twarons fiber is strain rate sensitive and it is essential to combine this characteristic into the constitutive equations of the material. The applicability of the Material Type 19 in DYNA3D has examined in terms of simulating fabric under impact conditions. This Material Type provides the option for the expression of Young’s modulus, tangent modulus, breaking strain and stress which are all represented as a function of strain rate in the form of load curves.
Specifications of the Twaron® CT 716 fabric.

There are few experimental data for Twaron CT 716 yarns at different strain rates. Fortunately, Tan and Zeng et al. had presented the relevant mechanical properties of Twaron CT 716 yarns under quasi-static and rate-dependent tensile tests. 24 Here, the data reported by Tan and Zeng as shown in Figure 4 is employed in the load curves of Young’s modulus, failure stress and failure strain. The load curves are fitted linearly from the data in Figure 4. Material parameters of projectile and yarns in the numerical model are summarized in Table.2.
Material parameters of projectile and yarns in numerical model.


Rate-dependent mechanical properties of Twaron CT 716 yarns 24 : (a) Young’s modulus, (b) failure stress, and (c) failure strain.
Coefficients of friction and contact
Through a simple test that pulled a steel block out of flat sheets of Twarons, Lim et.al determined the friction coefficient between steel and Twarons. 12 From their experiment, the coefficients of kinetic friction and static between steel and Twarons were determined as 0.28 and 0.30, respectively. To obtain friction performance between textile yarns, another experiment for pulling a yarn against another one with given loads was carried on by Rao et al. 15 From their works, the coefficients of kinetic friction and static between yarns were determined as 0.19 and 0.23, respectively.
Mesh density
The perfect mesh size should be good enough to seize the deformation details and desired results without expending unnecessary resources. Four-node plane stress elements are the most commonly element type used for finite element analysis. The mesh sizes for the target (120 mm × 120 mm) are investigated as follows:
(1) Total of 3600 elements for the 2D uniform shell model of the fabric armor.
(2) Total of 2,81,689 elements for the 3D interlacing model.
(3) Total of 91,364 elements for the hybrid element model.
Results and discussion of single elements modeling
In ballistic impact experiments, initial velocity and remaining velocity of the projectile are usually measured and the ballistic resistance performance is usually analyzed based on the energy absorbed by the fabric. As a simple, effective and high precision method, Lambert-Jonas equation 25 is a widely used in the ballistic impact cases. This method is suited to research the materials that damaged by shear stress and the ballistic penetration resistance of woven fabric. Lambert-Jonas equation can be expressed as:


where VR is the remaining velocity of projectile, VI is the initial projectile velocity; By definition, V50 is the ballistic limit velocity, at which there is a 50% probability that the fabric will be penetrated. If the projectile did not penetrate the fabric, the value of VR is chosen as 0,
Thus, the ballistic limit velocity can be approximately written as:
Results and analysis of the single uniform shell model
An experimental investigation into the responses of a woven fabric Twaron CT716 subjected to a spherical projectile impact has been undertaken by Shim et al. 26 Initial impact velocities ranging from 127 m/s to 147 m/s are utilized to calculate the ballistic limit velocities and the absorbed energy by the fabric. Results of computational and experimental analysis are presented graphically as plots of remaining velocity, ballistic limit velocity and absorbed energy in Figure 5. The graphs show reasonable agreement between simulation results and experimental results to some extent. However, the remaining velocity obtained by the computational analysis is higher than experimental results so that the absorbed energy and ballistic limit velocity are both lower than the corresponding experimental data. This is why the friction between yarns should be investigated during the ballistic impact of a rigid body onto a fabric. It proved reversely that just this friction prevents the relative motion between each yarn and thus resists the reduction of fabric weave tightness.

Comparison of analysis results between the uniform shell model and experiment: (a) residual velocity, (b) energy absorption, and (c) ballistic limitation.
The deformation history of the uniform shell model can be found in Figure 6 when subjected to impact at velocities of 140 m/s. Images show the development of deformation and failure for normal impact, while it has obvious distortion when compared with the actual test at velocities of 140 m/s by Shim .et al. Results of their high-speed photographs of the ballistic impact test show that deformation of the fabric exhibit a pyramidal shape as observed in Figure 7. As compared with Figure 6 in turn, such a deformation shape of the uniform shell model does not match the realistic morphology as shown in the ballistic impact test. At the moment of contact between the projectile and fabric, the conical shape deformation is obtained by the uniform shell model due to ignoring the wave propagation along the yarns. In addition, the phenomenon of yarn “pulling-out” is not yet predicted by the numerical model during perforation of fabric as observed in actual test.
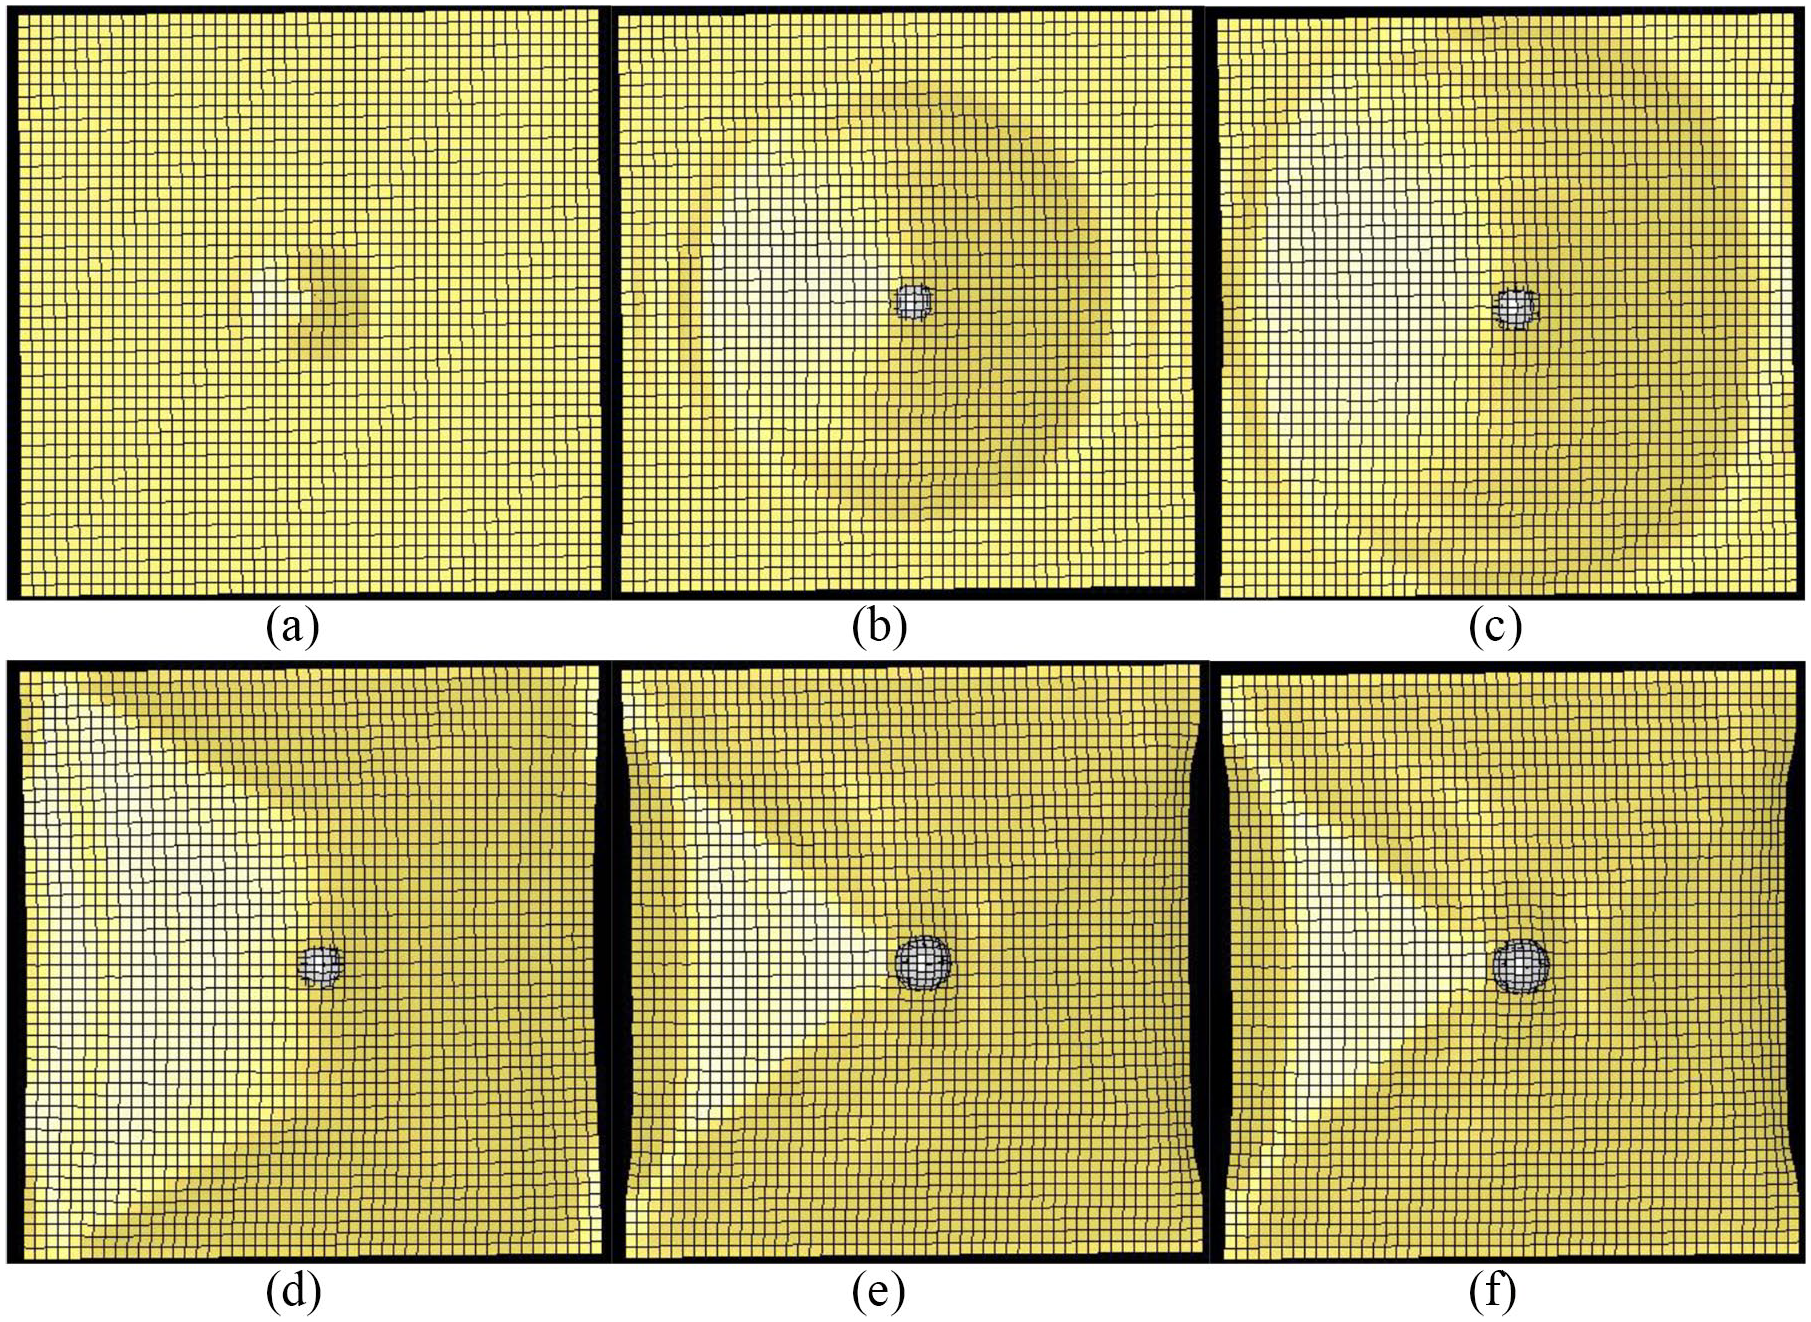
Deformation history of the uniform shell model: (a) 25µs, (b) 125µs, (c) 175µs, (d) 275µs, (e) 300µs, and (f) 325µs.

Comparison of deformation profiles for the 140 m/s impact velocity case at the time instants of: (a) 25 μs, (b) 125 μs, (c) 175 μs, (d) 275 μs, (e) 300 μs, and (f) 325 μs.
Results of the single 3D interlacing model
The impact deformation and penetration process are analyzed using the proposed 3D interlacing model. It can be seen that this computational simulation is able to capture many features observed in actual test very well. According to Figure 7, the pyramidal shape deformation is successfully obtained by the 3D interlacing model at the same impact velocities with that in actual experiment. The reason is that during the period of low speed impacts, the transverse wave arrived at the clamped edges in preference to complete penetration, which results in the formation of a pyramidal shape deformation. The pyramidal deformation profile shows good agreement with the experimental observations.
During the process of penetration, the projectile does not break through all the yarns impacting on at once. It is commonly that several yarns are broken to form a small opening first, then the projectile pushes the yarn aside and slips past through the remaining yarns. The model can simulate these phenomena only if yarn slippage is allowed. Owing to the 3D interlacing model in this study, this “wedge-through” phenomena is able to be well described as illustrated in Figure 7. Compared with Figure 6 above, this illustrates the importance of incorporating yarn slippage into the fabric model.
In addition to qualitative analysis, the computational model can also quantificationally predict the remaining velocity of the projectile well. Curves of the projectile remaining velocity obtained by computational model and experimental test are listed in Figure 8. Energy absorbed by fabric and ballistic limit velocity calculated by equation (3) are also plotted as shown in Figure 8. The results show that the computational model gives well coincident with the experimental data under a wide range of impact speeds. The matching coefficient of the curves in Figure 8 is apparently higher than that in Figure 5. It implies higher computational accuracy of the 3D interlacing fabric model when compared with the uniform shell model.

Comparison of analysis results between the 3D interlacing model and experiment: (a) residual velocity, (b) energy absorption, and (c) ballistic limitation.
Figure 9 gives the comparison of projectile velocity between the 3D interlacing model and uniform shell model. It can be seen that both curves decreased parabolically 200 μs ago. At this stage, the projectile velocity decreases very slowly at first. The reason is that only the contact point and the surrounding zone are deformed and stretched to absorb a small amount of kinetic energy. Then, the zones farther away from the point of contact are deformed as the stress wave passes. More fabrics join into it to increase the energy absorption so that the projectile speed drops rapidly. At the end of the parabolic stage, all the deformed zones are in a state of complete tension and the deceleration rate reaches a peak. In fact, the uniform shell model is in a state of complete tension at the moment of impact. While the 3D interlacing model has a buffer phase due to the additional tension deformation of the yarns. Thus, the tendency of the velocity decrease of the uniform shell model is more drastic and occurs earlier than that of the 3D interlacing model.

Comparison of projectile velocity between the 3D interlacing model and uniform shell model.
The units at the contact point begin to destroy after 200 μs when the failure limit stress is reached. The projectile penetrated rapidly and the speed is basically no longer changing in the uniform shell model. The failure mechanism can be observed in Figure 10(a). On the contrary, only the yarns in the vertical direction break in 3D interlacing model because of the upper and lower opposite sides are completely restrained. The yarns in the transverse direction slip to both sides and absorb a small amount of kinetic energy. Meanwhile, strain hardening capacity of yarns also enhance considering the strain-rate-sensitive property. Thus, the projectile velocity continues to decrease until it penetrates the fabric. The main mechanism of projectile penetration can be illustrated in Figure 10(b) in the 3D interlacing model. This phenomenon is very consistent with the experiment in Figure 7.

Comparison of failure mechanism between the 3D interlacing model and uniform shell model: (a) uniform shell model and (b) 3D interlacing model.
Validation of the single element modeling
The method suggested by Smith et al. 27 was common used to verify the individual yarn model. Where the velocities of longitudinal wave and transverse wave during impact were analyzed and compared with the computational and experimental data. The longitudinal wave velocity c and transverse wave velocity u can be calculated using equation (4). 28

where v is the initial velocity of the projectile, c is the longitudinal wave velocity in the yarn, E is the Young’s modulus and ρ is the yarn volume density. ε is its local in-plane strain oriented radially.
In this case, the initial impact velocity v of the projectile is 140 m/s, the Young’s modulus E and the volume density of the yarn ρ is assigned as 62GPa and 1.44 g/cm3, respectively. The longitudinal wave velocity c and theoretical transverse wave velocity u can be obtained as:
Images showing the deformation of the fabric simulated by uniform shell model and interlacing yarn model at time 125 μs are given in Figure 11. s1 and s2 are the maximum propagation distances of the transverse wave at 125 μs where the first transverse wave has not reached to the boundary. As shown in Figure 11, s1 is 43.2 mm and s2 is 44 mm, respectively. Hence, the numerical transverse wave velocity for the two numerical models can be obtained as:

The transverse wave velocity calculated by uniform shell model, interlacing yarn model and theory are summarized in Table.3. It can be seen from the calculation results that the numerical values are lower than the theoretical calculation. The main reason is that elastic modulus of materials is determined under the condition of quasi static experiment values in the theoretical calculation. However, in numerical simulation, the elastic modulus is increased with the changing of strain rate which leads to the transverse wave velocity lower than the theoretical calculation. However, the deviations of the numerical results are both within 10%. The deviation of the interlacing yarn model is decreased relatively that verify the accuracy of the interlacing yarn modeling.
Transverse wave velocity by numerical and theoretical calculation.

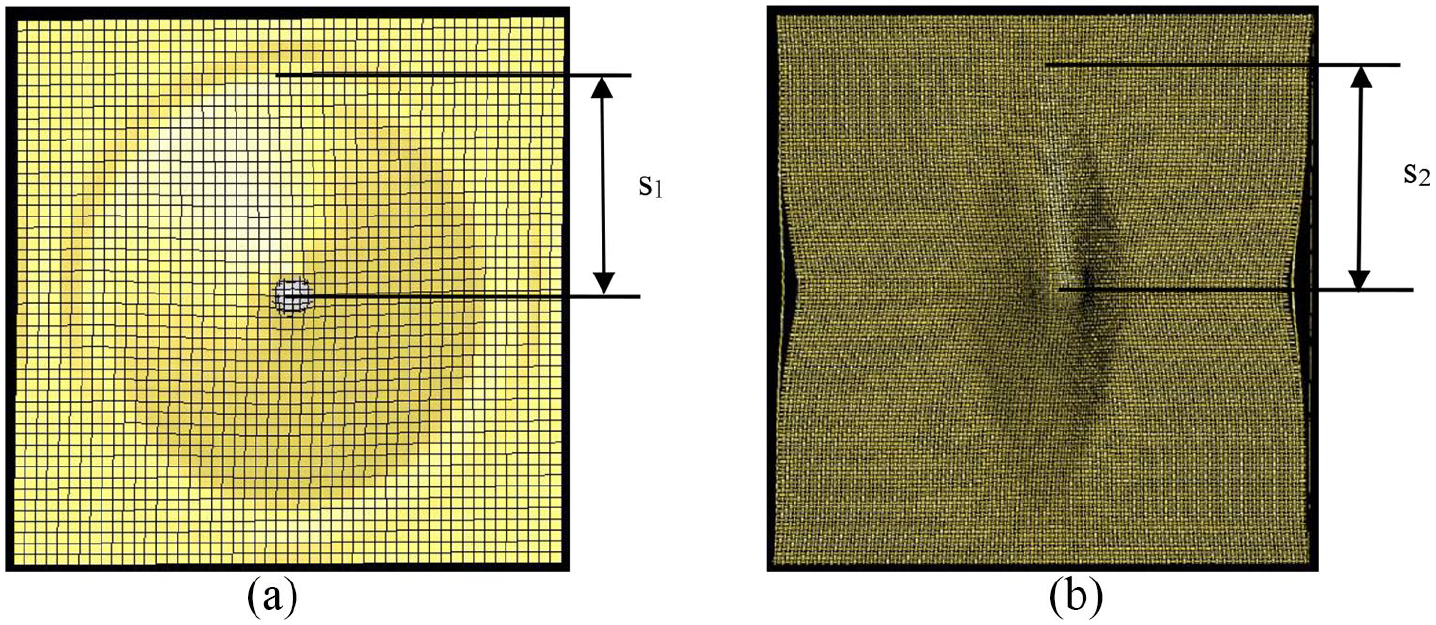
Propagation distances of the transverse wave: (a) uniform shell model and (b) 3D interlacing model.
Hybrid element analysis applied to the fabric
Results and analysis of the hybrid element modeling
Ballistic test results and FE results of remaining velocity, energy absorption and ballistic limit velocity under impact are shown in Figure 12. The plots show that the computational results still give good agreement with experimental data especially at the relative low impact velocities. Nevertheless, at the velocities 140~150 m/s, ballistic limit velocity and energy absorption are both decreased slightly when compared with the 3D interlacing model based on the standard of experimental data. One possible reason may be that the stress waves travel faster in continuous yarns than that in discontinuous counterpart. This may lead to the understanding that continuous composites absorb more energy than the discontinuous ones. 29

Comparison of analysis results between the hybrid element model and experiment: (a) residual velocity, (b) energy absorption, and (c) ballistic limitation.
Figure 13 gives the distribution of Von Mises stress in the fabric at different moments during the impact process. The nephograms in Figure 13 illustrate that the shock-induced stress wave is propagated from the shock point to the boundaries and the stress concentration is distributed along the central yarns of the intersection shocked by the vertex of the projectile. This could lead to the intuitive understanding that a pyramidal shape deformation is observed in the ballistic impact. One possible explanation may be that stresses are subjected to greater resistance in the plain woven structure when propagating along the unclamped direction.

Von Mises stress distribution in the fabric at different times: (a) 25µs, (b) 125µs, (c) 175µs, (d) 275µs, (e) 300µs, and (f) 325µs.
According to Figure 13, the stress concentration is mainly distributed along the clamping yarns that pass through the impact zone. The central yarns of the intersection shocked by the projectile transfer the force immediately to the boundaries along the length direction. On the contrary, the projectile can “push” the central yarns away from the moving direction, allowing the fabrics to be easily pierced due to the greater movement between the yarns. This may explain that the energy absorption capacity varies with the different structural fabric, since more yarns will be severely pressed and forced to move at tightly braiding structure model.
Figure 14 gives the comparison of projectile velocity between the 3D interlacing model and hybrid element model. It can be seen that projectile velocity in hybrid element model decreases faster than that in the 3D interlacing model. Because the stiffness and toughness of the uniform shell element are larger than that of the 3D interlacing model. Hybrid element model has less yarns than 3D interlacing model so that it has a more obvious resistance effect on the projectile. Fortunately, the tendency of the velocity decrease and residual velocity of hybrid element model is basically the same as 3D interlacing model.
Comparison of analysis results between the 3D interlacing model and hybrid element model.
Validation of the hybrid element modeling
In order to verify the effectiveness of the hybrid element model, three points A, B, C are chosen by comparing the displacement of these points against time calculated from our hybrid element model and interwoven yarn model. As shown in Figure 15, three points A, B, C were taken along the diagonal line on the quarter model of the fabric. The point A is located in the center of the “center-cross” modeling. The point B lies at the intersection of two models and point C is located in the center of the quarter flat shell modeling. The instance when the projectile contacted with the yarns is defined as zero. Displacements of the corresponding nodes at the impact velocities of 140 m/s are plot as shown in Figure 16.

The location of the three points A, B, C.

Comparison diagram of the corresponding displacement.
It can be seen from Figure 16 that the yarn displacement at point A calculated from the two models gives good agreement. While the values in hybrid element modeling are lower than that in the interwoven yarn modeling. It indicates that in hybrid element model, the flat shell element has impeded the deformation of the “center-cross” interwoven yarns at certain extent. The main reason is that the flat shell element model is much denser than the interwoven yarn modeling so that it is more difficult to be pulled out by the yarn around. The yarn displacement at point B is similar with point A and the movement is starting at the same time. It indicates that the propagation velocity of transverse wave is the same in the single elements model.
The point C in hybrid element model moves much earlier than that in the interwoven yarn modeling. It turned out that the transverse wave velocity in the uniform shell element modeling is faster. Similarly, in the time after moving the displacement of point C in hybrid element modeling is lower than that in the interwoven yarn modeling. However, the magnitude of deviation is very small and the hybrid element model is considered to be acceptable.
Simulation memory requirements and run times
The simulations were run on a 64 bit Dell workstation Precision 690 (4 Intel Xeon 3.0 GHz/RAM 16GB) using LS-DYNA version 971. Figure 17 compares the total run times for three analysis cases, that is, the uniform shell model, 3D interlacing yarn model and hybrid element model. These contours are indicative of the computational expense of the three simulation models. The single 3D interlacing shell model with plain woven structure ran much slower than uniform shell model due to the total number of finite elements and their shape. These savings are not just reflected in mesh density but also in the contact between yarns of woven fabric. It is also a significant consideration for reasons cited earlier.

The total run times for three simulation cases.
These savings in computational cost while still reappearing the response characteristics of the actual ballistic tests demonstrate the effectiveness of the hybrid element analysis method. These savings will become even larger along with the reduction of dimensions of the 3D interlacing yarns and surface contact. Figure 17 reveals the effectiveness of the hybrid element model in the case of the run times and it is more than twice as fast as the single 3D interlacing shell model.
Conclusion
To better understanding on the impact resistance behavior of woven fabric under projectile impact loading, a conceptual framework for the simulation model is proposed in this study. The fabric is modeled using a hybrid shell element analysis approach based on reducing the complexity and computational expense. That is, yarns are discretionally modeled using 3D undulating shell elements within the center of the intersection which extends all the way to the fabric boundary, while uniform shell model in the other global region. Material model considering the strain-rate-sensitive failure criterion was also explored based on the viscoelastic property of fabric. It provided much better description for the impact resistance behavior of woven fabric.
As a comparison, the single 2D uniform shell model and 3D interlacing model are established and analyzed. Strain rate sensitive properties of the materials are considered in all the models proposed. It is turned out that the resolution of the yarn level can better capture the unique properties of the woven fabric, such as yarn crimp, sliding contact between yarns, stress transmission on yarns and yarn broken. The pyramidal deformation profile and ‘wedge-through’ phenomena are able to be well described and elucidated. It gives a reasonable explanation for that the energy absorption capacity varies with the different structural fabric, since more yarns will be severely pressed and forced to move at tightly braiding structure model.
The hybrid shell element analysis approach is also beneficial to solve the contradiction between computational accuracy and precision of modeling resolution with computational requirements. It is can be seen from the comparison of numerical and experimental results that the hybrid model can accurately reflect the strain rate-dependent behavior of fabrics as the 3D interlacing model and has a relatively few computational consumption in addition.
Footnotes
Acknowledgements
The authors would like to acknowledge the support by the National Natural Science Foundation of China (NSFC) (No. 51575189) and Guangdong provincial science and technology plan project Foundation (No. 2019B090909001).
Declaration of conflicting interests
The author(s) declared no potential conflicts of interest with respect to the research, authorship, and/or publication of this article.
Funding
The author(s) received no financial support for the research, authorship, and/or publication of this article.